Probing Planet Forming Zones with Rare CO Isotopologues
Abstract
The gas near the midplanes of planet-forming protostellar disks remains largely unprobed by observations due to the high optical depth of commonly observed molecules such as CO and H2O. However, rotational emission lines from rare molecules may have optical depths near unity in the vertical direction, so that the lines are strong enough to be detected, yet remain transparent enough to trace the disk midplane. Here we present a chemical model of an evolving T-Tauri disk and predict the optical depths of rotational transitions of 12C16O, 13C16O, 12C17O and 12C18O. The MRI-active disk is primarily heated by the central star due to the formation of the dead zone. CO does not freeze out in our modeled region within around a sunlike star. However, the abundance of CO decreases because of the formation of complex organic molecules (COM), producing an effect that can be misinterpreted as the “snow line”. These results are robust to variations in our assumptions about the evolution of the gas to dust ratio. The optical depths of low-order rotational lines of C17O are around unity, making it possible to see into the disk midplane using C17O. Combining observations with modeled C17OH2 ratios, like those we provide, can yield estimates of protoplanetary disks’ gas masses.
1 Introduction
The mass and surface density of the inner of protoplanetary disks are critical parameters that control disk evolution and planet formation. Disk masses are currently determined by (sub)millimeter observations of dust, because the optical depth of continuum emission is low at radii much larger than (Williams & Cieza, 2011). However, observations begin to lose sensitivity to grains as they grow beyond the observing wavelength; millimeter wave observations may thus underestimate solid masses in the inner disk, where dust settling and higher densities lead to more rapid growth (Pérez et al., 2012).
On the other hand, commonly observed molecular lines often suffer from high optical depth, and are therefore unable to probe gas near the midplane. Molecules that are important mass contributors to outer Solar System objects, such as H2O and NH3, freeze out very close to the central star from the perspective of observers pc away. Thus, gas phase lines are hard to observe and most do not probe the giant planet-forming region. Here we seek a molecule that can be used to probe the conditions in planet-forming midplanes with rotational transitions observable from the ground. It must be present in the gas phase, even in a cold disk, and be optically thin enough that the disk is transparent in its rotational line emission. CO is volatile enough not to freeze out within a few tens of AU of the central star, so is able to probe a large disk area. Ali-Dib et al. (2014b) even find that, like H2O, CO may be an important planet-building molecule for ice giants. While rotational emission from 12C16O is optically thick due to the molecule’s high abundance, rare isotopologues of CO may provide optically thin lines due to their low abundances (Miotello et al., 2014). If so, CO isotopologue observations could lay the foundation for empirically determining the mass available for gas giant formation in nearby disks.
A clue that overall disk masses may be much larger than the MMSN (minimum-mass solar nebula) came from Bergin et al. (2013), who measured the mass of TW Hya using the optically thin J transition of HD with the Herschel Space Observatory. The -old transitional disk is estimated to have a mass of , much heavier than the of the MMSN, and larger than many measurements estimated from dust emission. This study has demonstrated the importance of measuring gas mass directly. However, the HD J state has a high excitation energy of K ( is the Boltzmann constant), so the line intensity depends on not only the mass available but also the temperature of the gas. Moreover, this transition is not accessible from the ground. Since there is no far-infrared space mission available, this method cannot be generally applied in the near future.
Extrapolating from line intensities to total disk mass requires knowledge of both the abundances and the isotopic ratios in the molecules being observed. Abundances are not constant throughout the disk, as freezeout rate, UV intensity, and X-ray intensity all change with distance from the star. Some chemical reactions are isotope-selective, so the isotope ratio in molecules is also a function of distance from the star. Miotello et al. (2014) have shown that the abundance ratio of rare isotopologues of CO to 12C16O (If not specified, CO means the most common isotopologue of CO - 12C16O - hereafter) can deviate from the atomic ratio significantly due to isotope-selective photodissociation; the extent of the effect depends on the strength of UV radiation and dust properties. Finally, disk temperature and density change over time, bringing changes in the molecular inventory as the disk evolves. Here we present chemical evolution models of protostellar disks to build a framework for translating observed fluxes into mass densities available for planet formation.
The disk model consists of three main components—the thermodynamic model, the chemical model, and the optical depth estimation. The workflow of the disk model is sketched in Fig. 1, and the structure of this paper follows the model workflow. The thermodynamic model (Section ) calculates the evolution of the disk thermal structure for Myr by adding the passive heating from the stellar irradiation to the viscous heating from the magnetorotational instability (MRI) turbulence (Balbus & Hawley, 1991). We construct D dust radiative transfer models with RADMC (Dullemond & Dominik, 2004) to calculate the passive heating, and adopt the viscous heating profile from an MRI-active disk model (Landry et al., 2013), which includes a viscosity prescription for accretion driven by MRI turbulence. The chemical model (Section ) then uses the density and temperature profiles from the thermodynamic model as input to calculate the disk’s chemical evolution for . After analyzing chemical model results and discussing the model dependencies on initial molecular cloud abundances, uncertainties in reaction rates, and different grain evolution scenarios in section , we estimate optical depths of various rotational emission lines from CO isotopologues (Section ), and calculate the optical depths contributed by dust at corresponding locations. Finally, we summarize the main results in section . A list of symbols and definitions used can be found in Table 1.
2 The Thermodynamic Model
The thermodynamic model provides density and temperature evolution profiles for both the chemical model and the optical depth calculation. Our thermodynamic model is built upon the D disk model by Landry et al. (2013), who calculated the structure and evolution of a disk with within of the star. The central star follows the evolutionary track of a star (D’Antona & Mazzitelli, 1994) from (, and ), roughly the beginning of the T-Tauri phase (Dunham & Vorobyov, 2012), to (, and ). Landry et al. (2013) followed the viscous evolution of the inner of the disk. Because our goal is to probe the giant planet-forming regions, we focus our study on the inner of the disk.
The disk is heated passively by stellar irradiation, and actively by viscous heating due to accretion. In order to determine the degree of viscous heating, Landry et al. (2013) evaluated whether MRI is present or not in each individual grid cell by considering both Ohmic resistivities and ambipolar diffusion. The MRI is shut down by Ohmic resistivity on the midplane, forming a deadzone extending to about . The disk has an MRI active layer near the surface, which provides an accretion rate of even when a dead zone is present. However, unlike models with assumed uniform turbulent efficiency [with a constant parameter, where viscosity , is the sound speed, and is the scale height; Shakura & Sunyaev (1973)], heating contributed by MRI (extracted from the energy of shear flow) only contributes slightly to the total heat budget of the disk because the power is deposited in the disk atmosphere at low optical depths.
Landry et al. (2013) calculated the heating from stellar irradiation in a D geometry using Rosseland mean opacities. Following Chiang & Goldreich (1997), Landry et al. (2013) considered stellar radiation entering the disk at a grazing angle, heating up the disk surface. Reprocessed stellar flux then traveled vertically from the disk surface to the midplane. However, long-wavelength radiation emitted by dust grains at the disk surface should travel unimpeded to the midplane, causing heating that is not captured by using Rosseland mean opacities. By assuming that heating propagates only vertically from the heated surface, one also neglects the heat transfer in the radial direction within the disk, which can be important when the wavelength of the re-emitted light is long enough to allow radial propagation. One therefore underestimates the disk temperature by using a D geometry and Rosseland mean opacities.
The stellar irradiation cannot heat the disk enough to ionize the disk interior, so the D approximation with Rosseland mean opacity in Landry et al. (2013) was useful to calculate ionization, making the disk evolution model tractable. However, the missing heating can be crucial for the disk chemistry. We improved the treatment of the stellar irradiation by including D dust radiative transfer models built with the publicly available code RADMC (Dullemond & Dominik, 2004). We then calculated the total temperature by taking a flux-weighted sum of the accretion temperature (Tacc) calculated from the MRI model and the equilibrium temperature (Teq) from stellar irradiation calculated from the D dust radiative transfer model at every point of the disk (as demonstrated in the upper half of Fig. 1.):
| (1) |
The D dust radiative transfer models are set up with gas density profiles calculated by Landry et al. (2013) and a constant gas/solid ratio throughout the disk. The main focus of Landry et al. (2013) was to study the mass transport. The disk is truncated at about two scale heights above the midplane. The model thus includes the majority of the disk mass, but the dust above the original disk surface in Landry et al. (2013) could affect disk thermal properties by absorbing the stellar radiation. We therefore extrapolate the density profile vertically with Gaussian distributions down to a background density of as input for the radiative transfer calculation.
Landry et al. (2013) found that if the mean grain size is as small as , the MRI shuts down completely. If the MRI drives accretion in the T-Tauri phase, some grain growth must have occurred, consistent with the findings of Oliveira et al. (2010). (See Gressel et al. (2015) for updated models suggesting that accretion is driven by winds, not MRI.) Evidence for rapid growth of solids in disks has been accumulating in the following ways: direct evidence from long-wavelength observations Isella et al. (2010), Guilloteau et al. (2011), Banzatti et al. (2011), Pérez et al. (2012), Pérez et al. (2015), and Tazzari et al. (2015); observations of forming planets in the LkHa 15 disk by Kraus & Ireland (2012); and the HL Tau images from the ALMA Partnership et al. (2015), which show gaps possibly sculpted by forming planets or resonances with planets.
The wavelength-dependent dust opacities that we use are taken from the
website111http://www.mpia.de/homes/henning/Dustopacities/Opaciti-
es/opacities.html,
which provides models whose Rosseland and Planck mean opacities are
described by Semenov et al. (2003), who updated earlier models by
Henning & Stognienko (1996) for dust in protoplanetary disks. The
available dust models include those with different assumptions about
the iron mixture in the silicates, different models of grain growth,
and different grain topologies. The dust grains are aggregated from
“sub-grains”, which themselves follow an MRN distribution extended up
to 5 µm (Mathis et al., 1977; Pollack et al., 1985). The
dust model that we use assumes a “normal” mix of iron [Fe/(FeMg) =
0.3] and that grain growth has occurred through particle cluster
aggregation (PCA in the nomenclature of Semenov), which leads to
roughly spherical grains. We use the multishell spheres topology and
take the models for temperatures up to 155 K, in which ices and
volatile organics are retained. Figure 2
shows the opacity per gram of gas versus wavelength for the adopted
dust properties. There are a number of resonances and a relatively
slowly declining opacity out to a wavelength of about 1.5 mm, beyond
which the opacity declines rapidly. The opacities are given per gram
of gas.
In our standard model, the dust has already grown and aggregated at the start of disk evolution - 0.1 after the formation of the central star. We further assume that 90% of the dust has grown to still larger sizes (pebbles, rocks, etc.), which we no longer describe as dust. This further growth decreases the grain surface area for chemical reactions and makes these solids essentially invisible even to millimeter wavelength observations (Birnstiel et al., 2011; Garaud et al., 2013). Consequently, we take a gas to dust ratio of 1000, so we divide the opacities from Semenov et al. (2003) by 10. In this model, there is a constant replenishment of dust by collisions between larger objects and the size distribution of dust does not evolve. We consider a different model for grain evolution as a variation of our standard assumptions in §4.5.3.
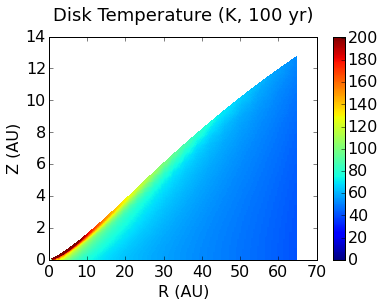
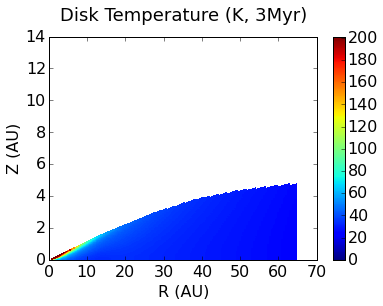
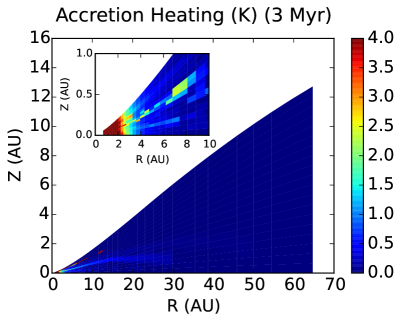
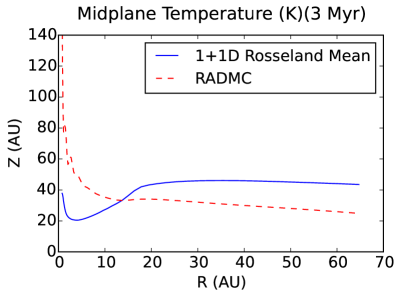
The temperature color coded plots (at the beginning and end of the evolution) with Teq computed from the D dust radiative transfer model are shown in the upper panels of Fig. 3. In both cases, the temperature is the highest on the disk surface due to the heating from the central star, and gradually decreases at larger radius and into the disk interior. The temperature almost everywhere in the disk decreases due to the star evolving down the Hayashi track ( decreases from to ) and the flattening of the disk itself (cf. the top two panels in Fig. 3). The accretion heating (Tacc) contributed by the MRI turbulence is shown in the lower left panel of Fig. 3. Accretion heating contributes less then in the majority of the disk, rising to about within from the central star.
We compare the midplane temperature with Teq computed from the D model after Myr years of evolution in Landry et al. (2013) and the one computed from the D dust radiative transfer model in the lower right panel of Fig. 3. The temperature is much higher in the D model in the inner . The D model misses heating in the inner part of the disk where the optical depth is larger, and therefore produces artificially lower temperature on the midplane closer to the central star. For example, the Rosseland mean optical depth is at AU, but at AU, so AU is more severely affected—even though its surface temperature is higher. Moreover, once the temperature is down to K, the black-body radiation re-emitted from dust peaks at far-infrared wavelengths. The mean free path is a significant fraction of the scale height and the assumptions used to justify using Rosseland mean opacity breaks down.
Our treatment of temperature is not ideal in the sense that the vertical density structure and the temperature structure are not calculated consistently. However, as an experiment we artificially increased the scale height everywhere in the disk by percent and did not find significant changes to the midplane temperature. We also assume the gas and dust are well mixed and have the same temperature in this paper, which is a valid assumption except for the very surface of the disk. Since the purpose of this project is to find an optical depth in the vertical direction and we mainly focus on the disk midplane where most of the disk mass resides, the combined accretion and passive heating models, assuming the same temperature for the gas and dust, meet our needs.
In the next sections, we describe our standard model and results. Then we describe two variations in the chemistry and one variation in the model of dust evolution.
3 Chemical model
The disk temperature and density evolution described in Section 2 allow us to compute the chemical evolution of the disk.
We also need initial chemical abundances, which we obtain from a simplified model of the molecular cloud.
We construct chemical evolution models including C, H, O, N, and different C and O isotopes based on the UMIST database RATE06 (Woodall et al., 2007), and follow the chemistry of species, gas-phase and ices. The reaction network contains reactions, including gas-phase reactions, grain-surface reactions, freezeout, thermal desorption, and reactions triggered by UV, X-rays and cosmic rays, such as isotope-selective photodissociation. The carbon isotopic chemistry network was developed by Woods & Willacy (2009) and was extended to include oxygen isotopes for this work.
We calculate the chemical evolution at each grid point independently. By doing this, we assume that the radial and vertical motions of gas and dust are slow compared to chemical reaction timescales, and that mixing is not important in determining the chemistry. This is a valid assumption for gas-grain reactions or grain surface reactions due to their short reaction timescale, but might not work as well for gas-phase reactions. However, given that turbulence in the inner AU is restricted to the disk surface, we do not expect vertical mixing to contribute much to disk chemistry.
In order to calculate the chemical evolution over a lifetime, we use an extension of the computationally efficient rate-equation method to compute reaction rates for grain-surface reactions under the “mean field” approximation (as used by Dodson-Robinson et al. 2009). Rate equations neglect the stochastic variation of abundances on different grains and are not appropriate when the number of reacting particles per grain is less than one. We modify our reaction rates following the method of Garrod & Pauly (2011), which considers the competition between thermal hopping of mobile species and reactions on the grain surfaces. We assume that only atoms and simple hydrides are mobile on the grains. Our treatment of gas phase reactions, freezeout, and thermal desorption is similar to that of Dodson-Robinson et al. (2009). After describing the molecular cloud preprocessing model in section 3.1, we focus the rest of this section on the treatment of photochemical and cosmic-ray reactions, which are new to this work.
3.1 Preprocessing in the molecular cloud
We model the chemical evolution in the molecular cloud stage to derive input abundances for the protoplanetary disk models.
The input abundances are listed in Table 2 (Graedel et al., 1982). Throughout this paper, abundances are presented as the number density normalized to the number density of hydrogen nuclei, nx/(n).
The molecular cloud model is run for 1 Myr with a density of cm-3, at a temperature of K and with a visual extinction of magnitudes.
The abundances at the end of the molecular cloud phase are given in Table 4. The 12C/13C is in CO gas, in CO ice and in CO2 ice at the end of the molecular cloud model – all lower than the initial elemental 12C/13C ratio. The reduction is caused by the preferential formation of heavier isotopomers of CO arising from the small energy different in the ion exchange reaction.
| (2) |
13CO has a lower ground-state vibrational energy due to its slightly larger mass compared to CO, and is therefore more energetically favorable. At K Equation 2 dominates the carbon fractionation, leading to lower 12CO/13CO than the elemental 12C/13C ratio (see also Visser et al. 2009, Langer & Penzias 1993). In other molecules, such as CH4 ice, the opposite effect is seen, with enhanced abundances of condensed 12C leading to higher 12CH4/13CH4 ratios in the ice.
3.2 UV ionization, photodissociation and photodesorption
In addition to ionizing and dissociating gas phase species, UV photons also desorb molecules from grain mantles. The UV flux generated by a young star has been observed by France et al. (2014) who found a median value of ISRF (1 ISRF = 1.6 10-3 ergs-1 cm-2; Habing (1968)) at AU. Theoretical studies of Alexander et al. (2006) suggest a UV flux of 50 ISRF at AU is required to drive photoevaporation of the disk. We choose a UV flux between these two values of ISRF at AU.
The UV field is attenuated by the disk and the resulting visual extinction can be related to the column density by
| (3) |
where is the mass fraction of hydrogen in the Sun (Grevesse & Sauval, 1998), and is the horizontal column density integrated from the inner edge of the disk.
For photodesorption we adopt the reaction rate of Hollenbach et al. (2009)
| (4) |
where F(r,z) is the UV flux in ISRF, is the grain cross-section and Y is the photodesorption yield. The average grain radius is taken to be µm, and is assumed to be 10-3 for all molecules (based on laboratory measurements of H2O photodesorption by Ly photons (Westley et al. 1995a, b).
3.3 X-ray photoionization
We follow the X-ray ionization prescription of Bai & Goodman (2009), using a value of the ionization rate for direct absorption of X-rays, = 6 x 10-12 s-1, and for scattered photons, = 10-15 s-1 (Igea & Glassgold, 1999). We assume a stellar X-ray luminosity = 20 1029 erg s-1 based on the median observed value from a Chandra survey of solar mass young stars in the Orion Nebula (Garmire et al., 2000). Similar values have also been observed in the Taurus-Auriga complex by Telleschi et al. (2007) and Robrade et al. (2014). The X-ray ionization rate is assumed to be the same for all reactions because of the lack of laboratory measurements.
3.4 Cosmic Rays
Cosmic rays can ionize and dissociate molecules in the gas directly, or by producing secondary photons (Gredel et al., 1989). The intensity of cosmic rays decreases exponentially with a characteristic attenuation depth of 96 g cm-2 (Umebayashi & Nakano, 1981, 2009). The large penetration depth means that our model disk is transparent to cosmic rays outside of 4 AU at the beginning of the T Tauri phase and outside of AU at the end of evolution. Cosmic ray reaction rates are taken from UMIST06 with an assumed cosmic ray ionization rate of 1.3 10-17 s-1.
3.5 A summary of ionization processes
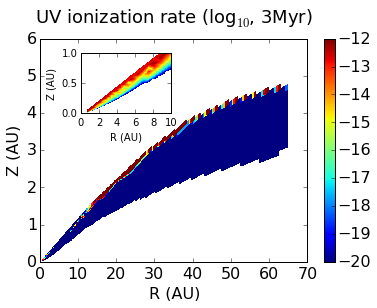
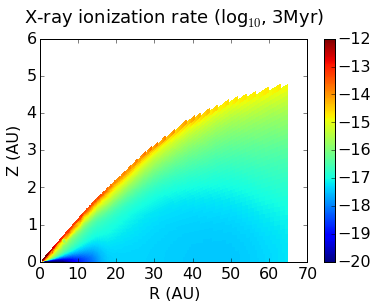
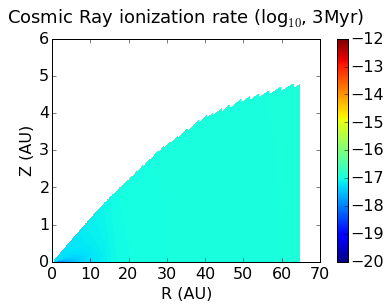
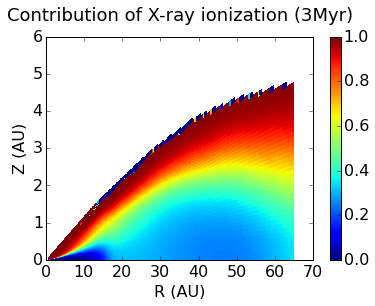
Ionization rates contributed by the above three ionizing sources are shown in Fig. 4. The upper left panel shows an order-of-magnitude estimate of the UV ionization rate based on the H2O molecule, which is the molecule most commonly ionized by UV. The ionization rate decreases very rapidly due to the small penetration depth of UV photons, and it is negligible except for the very surface layer of the disk. X-rays are able to reach most of the disk except for the inner near the disk midplane (shown in the upper right panel in Fig. 4). They provide ionization rates of s-1 to s-1 near the disk surface, and a modest ionization rate around s-1 in the disk interior due to scattering. In the lower left panel, we show the cosmic-ray ionization rate of H2, the most common cosmic-ray reaction partner. Cosmic rays provide a steady ionization rate around s-1 throughout the disk. The fractional contribution of X-ray ionization is plotted in the lower right panel of Fig. 4. Roughly speaking, X-rays dominate the ionization rate above one scale height of the disk where the vertical column density is less than a few g cm-2, and the cosmic ray ionization dominates the disk interior within one scale height of the midplane. Cosmic ray-induced photons are abundant enough to cause ionization and photodissociation throughout the disk due to the efficient penetration of cosmic rays. Ionization rates due to cosmic ray-induced photons are different for each reactant and are not shown in Fig. 4. However, cosmic ray-induced photons are important contributors to the chemical evolution.
Cleeves et al. (2013a) showed that stellar winds can power a “T-Tauriosphere” that shields the disk from external cosmic rays, leading to cosmic ray ionization rates of s-1 or lower. A decreased cosmic-ray flux would reduce the rates of reactions with both cosmic rays and cosmic ray-induced photons. On the other hand, the decay of shortlived radionuclides (SLRs) such as 26Al can provide an ionization rate on the order of s-1 to s-1 (Cleeves et al., 2013b), which may help to drive the chemistry in the disk interior. Since our chemical evolution models are computationally expensive, we do not explore different values of ionization rates.
4 Chemical model results
The results of our chemical model give the abundances of CO isotopologues that we need for the optical depth calculation. First, we discuss the ice line locations for different volatiles (Section 4.1). Knowing the ice line locations is important for interpreting observed radial abundance gradients. Second, we discuss the active reaction network involving carbon-bearing molecules, which causes the CO abundance to change with both radius and time (Section 4.2). In Section 4.3, we demonstrate that dissociation of CO and subsequent formation of complex organic molecules (COM) can produce CO depletion that mimics an ice line. In Section 4.4, we assess how computational limits on the number of species in our reaction network impact our COM abundances. We discuss our model’s dependence on initial cloud abundances, reaction rates, and grain evolution in Section 4.5. We show that despite the uncertainty in the exact end product of COM formation, the formation of ices as carbon sinks on grain surfaces is robust, and leads to the depletion of CO in the gas phase. In order to connect the abundances of rare CO isotopologues with the overall disk mass, we examine the carbon fractionation in CO and other major carbon-bearing molecules in section 4.6.
4.1 Locations of ice lines
Due to efficient heating from the central star, CO and CH4 do not freeze out in our modeled region—the inner of the disk—at any time in our 3 Myr of evolution (though disks with different grain properties or less luminous host stars may be colder than our model disk). Using CO isotopologues to estimate planet-forming mass therefore does not require correcting for CO freezeout, at least in disks surrounding proto-Sunlike stars. However, as we will see in Section 4.3, freezeout of other organic molecules affects the gaseous CO abundance. H2O and CO2 freeze out at and at the beginning of disk evolution, and their condensation fronts move inward to and as the disk becomes cooler. We see ices of hydrocarbons and other carbon-bearing molecules formed from CO after a few hundred thousand years of disk evolution. The abundance of an ice depends on both condensation temperature and formation pathway: a molecule may have been chemically destroyed and simply not be present to freeze out. Our discussion of ice lines focuses only on locations where the relevant molecule exists. We defer the discussion of molecule formation and destruction to the next two sections.
The binding energies and the locations where different ice species exist after 3 Myr of disk evolution are shown in Table 3. Species with larger binding energy can form stronger bonds with the grain surface, and therefore freeze out at higher temperature. In our model, species with binding energy larger than K can freeze out well within the giant planet-forming region at AU (Tsiganis et al., 2005; Thommes et al., 2002); species with binding energy of K can only freeze out in the outer part of the disk or at later stage of evolution when the temperature is lower, and species with binding energy lower than K—including CO—do not freeze out.
The condensation of volatiles is important for the growth of planets due to the increase of available solid surface density (Dodson-Robinson & Bodenheimer, 2010; Ali-Dib et al., 2014b), and is crucial for determining the chemical composition of giant planets (Öberg et al., 2011b). Moreover, the effect of radial drift and gas accretion may cause further movement of ice lines and changes in chemical composition (Ali-Dib et al., 2014a; Piso et al., 2015). However, the above studies assumed CO to be a major carrier of carbon and oxygen, which may not be true throughout the disk evolution. Our results indicate that it is important to take into account the possibility that CO ice is not a mass source for giant planets in some systems. Instead, CO2, hydrocarbons, and methanol may be the major carbon ice reservoirs that contribute to planet growth.
Furthermore, because of the unprecedented sensitivity and resolving power of (sub)mm interferometers such as the Atacama Large Millimeter/submillimeter Array (ALMA), the location of the CO ice line has been considered an important temperature tracer of giant planet-forming regions (Qi et al. 2011, 2013). Qi et al. (2013) use observations of N2H+, which CO destroys, to infer a CO snow line radius of AU in the disk surrounding TW Hya. If some combinations of grain size, star luminosity and UV/X-ray/cosmic-ray flux push CO ice lines outside of AU, CO freezeout may not trace the region of giant planet formation. Even TW Hya, at 0.8 and 10 Myr, is luminous enough to push its disk’s CO snow line beyond the likely formation locations of Uranus and Neptune in the solar nebula.
4.2 Time evolution and spatial distribution of CO gas
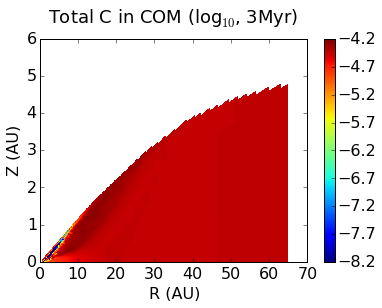
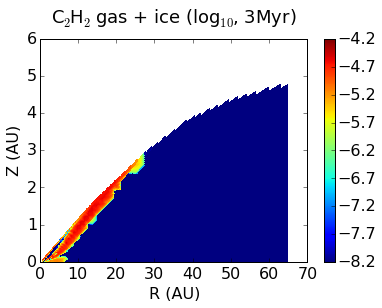
Inferring disk structure based on CO line intensity is complicated by the fact that the abundance of CO evolves significantly as a function of time. In the inner from the central star when the temperature is high enough for CO2 to be in the gas phase, CO2 is dissociated into CO + O by cosmic ray-induced photons at a rate around per second, which leads to an increase of CO abundance on a time scale. On the other hand, although CO does not freeze out in our modeled region within , the abundance of CO drops beyond because carbon is tied up in hydrocarbons, methanol, and ketene (complex organic molecules or COMs), mimicking the effect of CO freezeout. Abundant carbon-bearing species include C2H2 (acetylene), C2H5, CH3CHO (acetaldehyde), CH3OH (methanol), and H2CCO (ketene). The CO depletion rate is driven by the ionization rate of He+ from X-rays and cosmic rays, as He+ drives the breakup of CO (section 4.3). The depletion of CO beyond happens on a time scale. As a result, the CO abundance depends strongly both on location and time. As long as the disk is opaque to the UV photons that dissociate CO, the column density of CO can increase in the inner part of the disk even as the overall disk mass is decreasing.
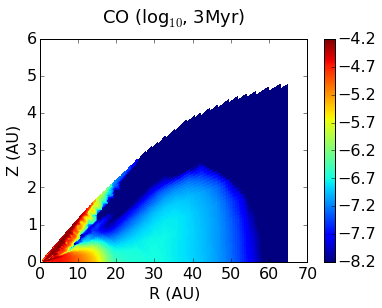
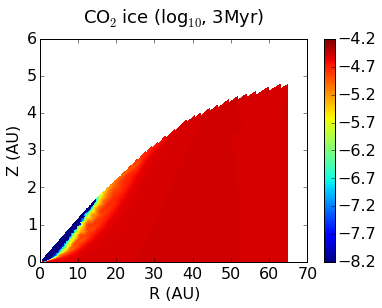
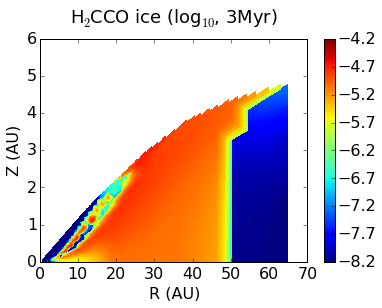
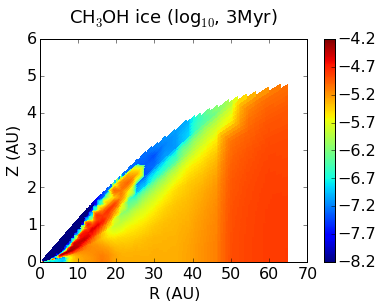
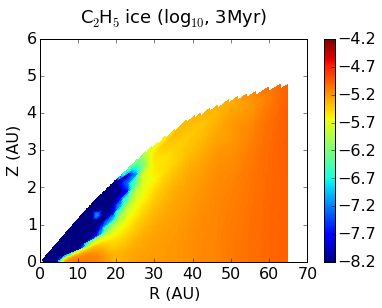
Color-coded plots of abundances of major carbon-bearing molecules are shown in Fig. 5 and Fig. 6. We see abundant CO within AU from the central star, and abundant CO2 ice in parts of the disk where the temperature is low enough for it to stay on the grain surface. H2CCO (ketene) ice is found to be the major carbon sink between AU and AU from the central star in our model. Other COMs such as C2Hx, CH3OH (methanol) and CH3CHO (acetaldehyde) exist in a layer between AU, closer to the disk surface, or the whole disk thickness beyond AU from the central star (lower right panel of Fig. 5). Again, the change of abundance can be very gradual. Here we quote the boundary location where of carbon is stored in corresponding species. At the end of our Myr disk evolution, of available carbon is contained in CO gas, in CO2 ice, and in complex organic molecules. The above values are integrated over the entire disk, weighted by the disk mass in different locations. A detailed breakdown of abundances of various species can be found in the first column of Table 5. We present abundances in the form of percentage of carbon contained in each species, integrated over the entire disk, and weighted by disk mass in different locations.
The time evolution of the CO/H2 abundance ratio (Fig. 7) over 3 Myr is substantial. The variation is not well-represented by a step function as in simple freeze-out models. Models of CO abundance versus radius appropriate to the star’s age must be used to compute available planet-forming mass from CO isotopologue line intensities.
While this paper does not contain a parameter study of CO/H2 abundance ratio as a function of disk mass and UV/X-ray/cosmic-ray flux, we suggest that flux in high-velocity line wings (produced by CO gas near the star) may increase as the star ages, even despite an overall reduction in disk mass. Furthermore, depletion of CO gas in the outer disk does not necessarily mean there is CO frozen on grain surfaces, an idea we explore further in the next section.
4.3 CO depletion due to the formation of complex organic molecules
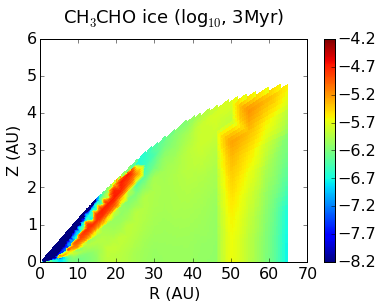
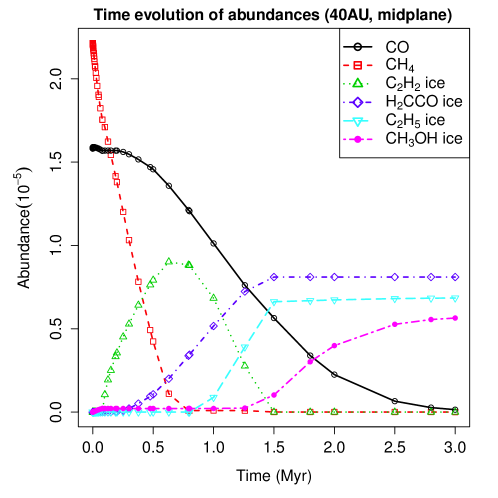
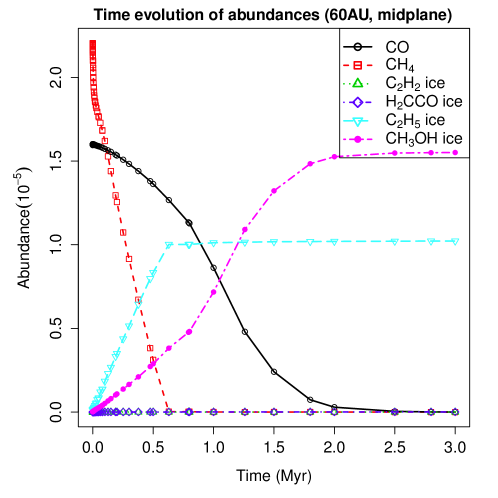
Here we investigate the causes of CO depletion in the outer disk, beyond AU. As we can see in Fig. 5 and Fig. 6, H2CCO (ketene) ice is the dominant form of carbon within from the central star in the CO-depleted region. Beyond 45 AU, CH3OH, C2Hx, and CH3CHO ice are more abundant. To demonstrate the chemical evolution in these two different locations, we plot the abundances of major carbon-bearing molecules as a function of time in Fig. 7 for two locations of the disk: on the midplane and on the midplane.
At on the midplane, the depletion of CO happens in three stages. In stage 1, the first , CH4 and CO react to form C2H2 through two different paths (Path and Path , see the next paragraph for details), both of which depend on the existence of CH4 gas. This leads to a net destruction of CO and methane and increase in C2H2 abundance. C2H2 freezes out on grain surfaces, but because of the low binding energy of C2H3, C2H2 can not efficiently hydrogenate until the temperature decreases. The formation of more complex organic molecules such as H2CCO and C2H5 happens roughly between to (Stage 2) and only after the reactions in Stage 1 have already begun to deplete CO. CH3OH ice forms in Stage 3 after the formation of H2CCO and C2H5 ices. The CO gas abundance continues to decrease through all three stages. At on the midplane where temperature is lower, C2H3 can stay on the grain surface and hydrogenate to C2H5 early in the disk evolution. We see rapid C2H5 formation in the first , and the formation of hydrocarbons stops after CH4 is depleted. Instead, the net transfer of carbon is from CO to CH3OH.
The formation of COM primarily follows two paths: reactions between CHx radicals (Path ), and ion-neutral reactions between C+ and CHx (Path ). The first pathway starts from CH4 dissociation by secondary photons (h) generated by cosmic ray ionization:
| (5) |
CH2 then reacts to form CH and subsequently combines with CH4 to form C2H4.
| (6) | ||||
| (7) |
Similar reactions involving other CHx radicals include:
| (8) | ||||
| (9) |
In a relatively high temperature and hydrogen rich environment, C2H3 and C2H4 formed in above reactions quickly react into a more stable form - C2H2.
| (10) | ||||
| (11) |
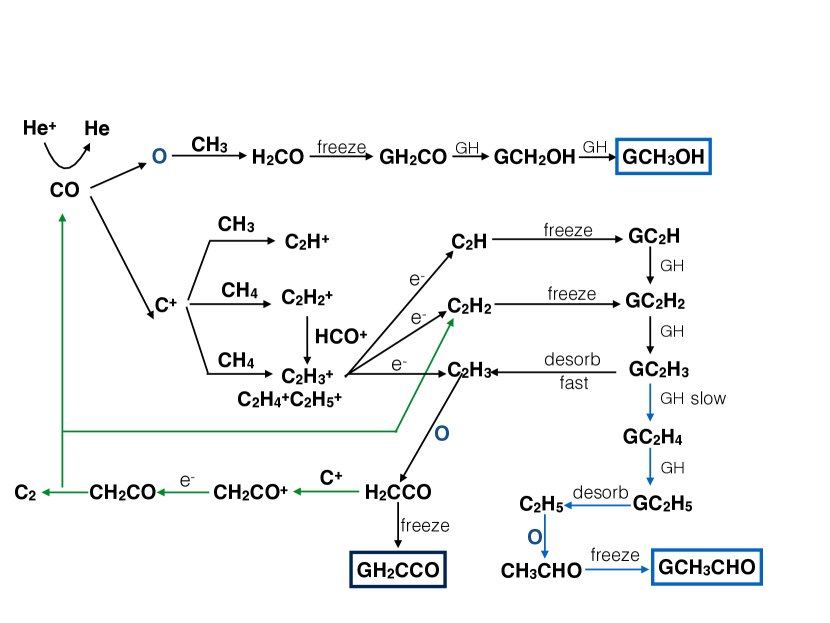
While the major carbon source for the first pathway is CH4, this pathway also creates molecules that react with byproducts of CO destruction. Since CO abundance is our focus in this work, we direct our attention to the second pathway. The reaction network that moves carbon from CO into COM is sketched in Fig. 8. The formation of COM following CO destruction is primarily driven by helium ionized by cosmic rays and X-rays. Of the resulting He+ ions, more than half go on to dissociate CO (creating C+ and O), while other He+ ions end up ionizing molecules such as H2, C2H2, N2 and CH4. C+ rapidly reacts with CH4 and CH3 to form hydrocarbon ions. Hydrocarbon ions can go through a series of charge-exchange reactions until they eventually recombine with an electron to form neutral hydrocarbons. If the binding energy of the resulting neutral molecule is large enough, the neutral will quickly freeze onto the grain surface and remove carbon from the gas-phase chemistry. Key reactions that initiate hydrocarbon formation are:
| (12) | ||||
| (13) | ||||
| (14) | ||||
| (15) |
This full reaction chain terminates in frozen-out methanol, acetaldehyde, and ketene sinks (see Fig. 8).
The electrons with which the C2-based hydrocarbon ions eventually recombine come mostly from cosmic-ray and X-ray ionization of H2. However, unlike He+, H does not contribute to hydrocarbon formation directly. The majority of H initiates HCO+ formation through:
| (16) | ||||
| (17) |
Reactions involving HCO+ often change the charge and/or saturation of a hydrocarbon (e.g. C2H HCO), but do not contribute to the initial formation of the carbon-carbon bond.
After hydrocarbon ions recombine with electrons, the resulting neutral molecules may freeze onto grain surfaces. The dissociative recombination reactions
| (18) | ||||
| (19) | ||||
| (20) | ||||
| (21) | ||||
| (22) |
contribute the most to the total neutral C2Hx abundance, and to the C2Hx ice budget (recombination pathways are marked with e- in figure 8). As a result, the reaction of CO with He+ starts a chain that moves carbon atoms from CO to hydrocarbons on million-year timescales.
4.4 Chemical pathways in the formation of complex organic molecules
We have seen how the CO abundance beyond 20 AU decreases over time due to complex organic molecule (COM) formation. Here we trace the chemical pathways that transfer carbon from CO to COM and assess whether the outer-disk CO depletion is robust given the construction of our reaction network.
4.4.1 Ketene as a carbon sink
Our chemical model does not include any molecule with more than two carbon atoms. Without more complex species available for reaction outcomes, H2CCO (ketene) is the most abundant two-carbon molecule found in our model and serves as a “sink” for frozen-out carbon on the grain surfaces (as seen in Fig. 5). The low binding energy of C2H3 also contributes to the H2CCO abundance by shutting off the hydrogenation pathway from C2H3 to C2H6 on the grain surfaces and ensuring that saturation must take place in the gas phase. (The binding energies of abundant COMs are shown in Table 3.) Finally, the activation barrier of K for the reaction (Hasegawa et al., 1992), which has to break the strong C–C triple bond, means that at the cold temperatures required for acetylene to freeze onto grain surfaces, hydrogenation proceeds slowly.
The most common reaction for C2H3 in the gas phase is
| (23) |
followed by C2H2 re-freezing onto grain surfaces. A small fraction of C2H3 gas reacts with ions such as C2H, HCO+, and forms more saturated hydrocarbons, then refreezes onto dust grains:
| (24) | |||
| (25) |
At the same time, a small fraction of C2H3 forms a double bond with free oxygen released in Eq. 12:
| (26) |
Since H2CCO has very high binding energy (only slightly smaller than CO2), and we are not including destruction of H2CCO ice other than desorption, H2CCO ice serves as a sink for COM in our model. Although the rate for reaction 26 is low, ketene can nevertheless accumulate on million-year timescales. The reaction pathway leading to ketene formation is sketched in the lower left part of Fig. 8, with the sink molecule H2CCO enclosed in a solid box. One should note that ketene is a representative of the presence of complex organic molecules in our model. In a real disk, other forms of COM will likely exist.
Densities on grain surfaces are usually much higher than in the gas phase, so reactions such as hydrogenation on grain surfaces typically happen very quickly. However, due to the rapid thermal desorption of C2H3 from the grain surface, more saturated hydrocarbons cannot be formed efficiently. In most of the disk within , only a small amount of more saturated C2 hydrocarbons can be formed in the gas phase through ion-neutral reactions, with a negligible amount formed though hydrogenation on the grain surface.
4.4.2 Acetaldehyde as a carbon sink
Ketene is no longer the sink in regions where the temperature is high enough for it to be in the gas phase, or where the temperature is low enough for C2H3 to stay on the grain surface and continue hydrogenating to form more saturated hydrocarbons. In those regions, ice molecules such as CH3CHO (acetaldehyde), CH3OH (methanol), and C2H5 (ethyl) serve as the carbon sinks, keeping carbon from re-entering the gas phase.
Green lines in Fig. 8 show the ketene recycling pathway in a small region below the disk surface between , where the temperature is high enough that H2CCO stays in the gas phase and the ionization rate is s-1. H2CCO gas reacts with C+ to form CH2CO+:
| (27) |
CH2CO+ then recombines with an electron and undergoes one of three dissociative recombination reactions to form C2, C2H2, or CO, with roughly equal branching ratios (see green lines leading from CH2CO molecule in lower left corner of Fig. 8). Moreover, due to the high ionization rate, the rate of reaction 12 can be as much as twice the value on the disk midplane. The abundance of free hydrogen atoms is also high due to photodissociation of H2 and H2O. Efficient C+ production and high atomic hydrogen abundance speed the production of C2H2 and allow more saturated hydrocarbons to form on grain surfaces, despite the volatility of C2H3. The temperature in the region is high enough for C2H5 to evaporate into the gas phase once it is formed. C2H5 then reacts with atomic oxygen to from the more stable molecule CH3CHO (acetaldehyde), which refreezes on to the grain surface due to its high binding energy and serves as another carbon sink:
| (28) |
To summarize, the acetaldehyde-forming reaction pathway (Fig. 8) differs from the ketene-forming pathway simply because of the warmer temperature that keeps ketene in the gas phase, the high C+ abundance from reaction 12, and the high atomic hydrogen abundance. Note that our reaction network does not include the grain-surface hydrogenation pathway (ethane ice). However, Dodson-Robinson et al. (2009) found low grain-surface hydrogenation efficiency, leading to significant amounts of ethane ice only near the acetylene sublimation temperature of 55 K.
4.4.3 Ethyl and methanol as carbon sinks
In the outer disk where AU, and after in most of the disk, C2H3 is able to stay on the grain surface and hydrogenate to C2H5, and C2H5 serves as a carbon sink.
Due to the lack of C2H3 in the gas phase, and the low temperature that allows H2CO to freeze out, the reaction
| (29) |
becomes the dominant reaction with atomic oxygen, rather than reaction 26. H2CO then freezes onto the grain surface, reacts with H atoms on the grain surface, and finally forms CH3OH (methanol), another carbon sink in our model, as follows (letter G denotes species that are frozen out on grain surfaces):
| (30) | ||||
| (31) |
This reaction path explains the evolution of abundances of carbon-bearing molecules demonstrated in the lower panel of Figure 7. These reactions start to happen at where the temperature is about , and at on the midplane at when the temperature drops below .
In summary, as Fig. 5 and Fig. 6 show, H2CCO dominates in most of the COM-forming region where the temperature is low enough for H2CCO to remain on the grain surface, but high enough for C2H3 to evaporate into the gas phase. In the small region above the disk midplane (r , z ), where the temperature is high enough for H2CCO and C2H5 to stay in the gas phase and atomic hydrogen is abundant, CH3CHO serves as the sink for carbon chemistry. In the outer region where the temperature is low enough for C2H3 to stay on the grain surface and hydrogenate to C2H5, we are seeing CH3OH and C2H5 as the end products of COM chemistry.
The reaction pathways described above demonstrate how H2CCO, CH3CHO, C2H2 and CH3OH stand in for complex organic molecules in our model. In reality, organic molecules may grow more complex as ketene, acetaldehyde, ethyl, and methanol ice react with other species in ways not included in our model. Despite our upper limit of two carbon atoms per molecule, the net movement of carbon from CO to ices should be a robust result for ionized regions that contain CH4 gas. In order to demonstrate that our reaction network does not falsely predict carbon depletion from the gas phase, we investigate an alternative network with a low ketene formation rate in the next section. We also compare our model abundances with results from the c2d (cores to disks) Spitzer Legacy Program as summarized by Öberg et al. (2011a), and discuss the effect of different assumptions about grain evolution.
4.5 Model dependence on reaction rates, initial conditions, and grain evolution models
Our model results depend on the disk physical conditions, initial cloud phase abundances, and reaction rates. In this section, we present a detailed study of how results depend on reaction rates, initial abundances, and grain evolution. In section 4.5.1, we verify that our ketene ice sink does not artificially remove carbon from the gas phase by running a model with the ketene formation rate decreased by 10 orders of magnitude. In Section 4.5.2, we compare the abundances from our molecular cloud preprocessing model with the ice abundances observed by the Spitzer c2d team in the envelopes of low-mass protostars (Öberg et al., 2011a). In Section 4.5.3, we investigate the effects of grain evolution on the disk temperature and chemistry.
Our current model cannot consider gaps or inner holes without significant modifications. The effects of such structures on chemical evolution requires further study.
4.5.1 Models with low H2CCO formation rates
The formation of carbon sinks such as ketene greatly reduces the gas-phase CO abundance in our model and suggests that observations of CO depletion may trace complex-molecule formation instead of freezeout of CO. In this section, we test the robustness of our result by artificially suppressing ketene formation rates. The CO abundance is independent of the exact form of carbon-bearing ice as long as our model does not artificially remove carbon from the gas phase. However, having H2CCO ice instead of C2Hx ice as a sink in the model can potentially reduce the amount of oxygen in the gas phase, therefore affecting the CO abundance. To test the effect of H2CCO formation rate on CO abundance, we ran the chemical model with H2CCO formation rates artificially turned down by ten orders of magnitude while keeping other parameters the same.
We compare output abundances at the end of the Myr evolution of this experiment with those from our fiducial COM-forming model (described in Section 4.3) in Table 5.
The H2CCO formation is strongly suppressed as expected, resulting in a negligible abundance. Without the pathways that convert hydrocarbons (C2Hx) to ketene, the abundance of hydrocarbons (C2Hx) is significantly higher, but most other abundances show little change. The gas-phase CO abundance increases from 13.6% to 17.3% of the elemental carbon.
To summarize, the choice of end-member species in the chemical reaction network can affect the gaseous CO abundance. Translating observed CO isotopologue line intensities into disk surface densities would include an uncertainty of at least a factor of two for any given disk annulus. However, the effect of the ketene sink on the CO gas abundance in our modeled 70 AU disk as a whole is small. One would be able to translate a measurement of the mass of C17O or C18O gas in the planet-forming region of a disk into a total mass available for giant planet formation without large uncertainties due to the chemistry of complex organic molecule formation.
4.5.2 Comparing with the c2d cloud abundances
We test the sensitivity to initial conditions in our chemical reaction network by comparing the abundances at the end of our molecular cloud preprocessing model with measured ice abundances in low-mass protostellar envelopes. Öberg et al. (2011a) combined Spitzer/ IRS spectra for about 50 low-mass protostars with infrared ice features with near-infrared ground-based observations of ice features such as H2O, CO, and CH3OH, presenting an overview of the ice inventory during the embedded phase of star formation. Because the absolute ice abundances vary from source to source, Öberg et al. (2011a) presented the median ice abundance ratio with respect to water ice abundance in the combined sample. The chemical compositions observed in low-mass protostellar envelopes are expected to be similar to those at the end of the molecular cloud phase, because the materials are not yet heavily heated by the central star or processed by shocks.
We compare cd observed ice abundance ratios and outputs of our cloud phase model (as described in Section ) in the first two columns of Table 4. The CO2, CH4, and CO abundances with respect to the water ice abundance in our cloud model are about 1.2, 5, and 0.5 times the values observed in nearby star-forming regions, respectively (Öberg et al., 2011a). While not an exact match, our computed abundances relative to water ice are of the same order of magnitude as observed values for major carbon-bearing species.
To test how our disk model varies based on small changes in input abundances, we conduct an experiment using the Öberg et al. (2011a) observed abundances as the initial conditions for the chemical evolution, while keeping other parameters the same. We keep the same abundances as predicted by our molecular cloud model for H2O ice and minor species not observed by the cd team, but scale the abundances of other c2d-observed ices to match the cd results. The abundances predicted by the molecular cloud model, and the abundances adjusted according to cd ratios, are listed in the last two columns of Table 4. This experiment is only to demonstrate the model dependence on initial input abundances. We do not conserve the total number of C and O atoms per hydrogen atom by artificially scaling the molecular abundances.
The change of input abundances does not change CO abundance significantly in our experiment. Integrated over the entire disk, the total available carbon in the form of CO gas increases from 13.6% to 18.3%, while the carbon locked in COM decreases from 44.8% to 37.0% However, the dominant kind of COM is different from that of the standard model. Due to the significantly lower input methane abundance, the percentage of molecules that contain two carbon atoms is only one third of the value in the fiducial model, and the methanol abundance is three times the original value. The paucity of ices that contain two carbon atoms when the initial methane abundance is low suggests that even though the formation of the carbon-carbon bond relies on both CH4 and C+ liberated from CO, the formation of carbon chain depends largely on the methane abundance the disk inherits from the cloud.
We find that the abundances predicted by our molecular cloud model agree with observational results within a factor of two. In our experiment, adjusting the abundances inherited by the disk to match observed abundances in cold protostar envelopes can lead to a higher abundance of methanol and a smaller overall COM abundance than in our fiducial model. However, the computed CO abundance is only 1.35 times higher.
4.5.3 Different models of grain evolution
In the fiducial model, we assume by mass of the of dust has already grown to larger than mm size, and use a gas to dust ratio of throughout. However, grain evolution could be slower than what we assume. Specifically, the disk could have a larger portion of dust than what we assumed at the beginning of the evolution. Small dust grains provide most of the opacity that is important for heating and attenuating UV and x-ray radiation, and they also provide most of the surface area available for freeze-out and grain surface reactions. Miotello et al. (2014) have found that the evolution of dust grains can change the disk opacity, which can further increase the significance of isotopologue-selective photodissociation, and change the CO fractionation.
To investigate the effect of grain evolution, we construct a series of models with gas to dust ratio gradually evolving from 100 to 1000, assuming the same opacity profile for the dust grains. We choose to change the gas to dust ratio to trace the loss of solid material to bigger bodies, rather than changing the grain size distribution, because a balance between collisional aggregation and fragmentation yields a size distribution whose slope at the small end is insensitive to the dust abundance (Birnstiel et al., 2011).
In the models considering grain evolution, the total dust opacities are larger than those in the fiducial model, resulting in lower disk temperature. On average, the disk temperature is lower at yr where the gas-to-dust ratio is times the fiducial value, and lower at when the gas-to-dust ratio is one third of the fiducial value.
The output abundances averaged over the entire disk are presented in the last column of Table 4. Despite the decrease of temperature, the carbon content in the grain evolution model is very similar to that in our fiducial model by the end of the evolution. This is because CO depletion happens on a time scale when grain evolution has already started, and the grain surface area is not limiting the freeze-out time scale as long as some dust grains are present. The final CO abundance relative to total carbon decreases from 13.6% in the standard model to 11.8% in this model, a change in the opposite direction to that found in the other model variations. The difference between the two models is largest at 1 Myr, when the CO/C ratio is 27.5% in the standard model and 21.8% in the grain evolution model. Unlike in Miotello et al. (2014), considering grain evolution does not significantly change abundance ratios of CO isotopologues in our models. We defer detailed discussions on isotopic ratios to section 4.6.
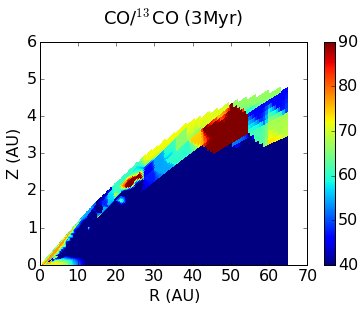
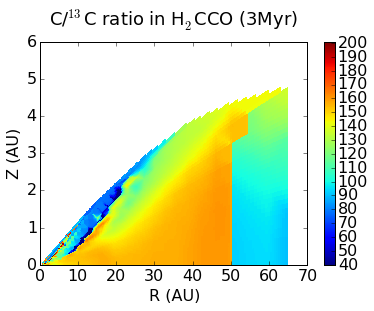
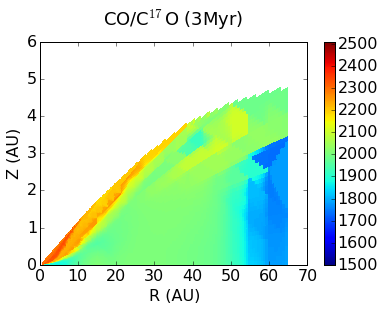
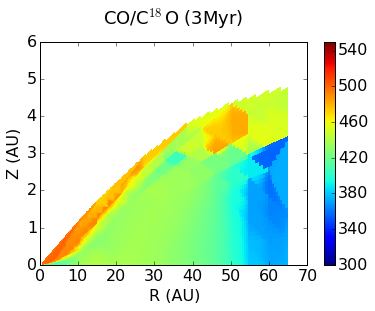
4.6 Fractionation of CO isotopologues
In addition to understanding the formation and destruction pathways of CO, one also needs to know how C and O isotopes fractionate among different molecules in order to link 13CO, C17O, and C18O observations with disk masses. The isotopologue ratio in CO and the major carbon sink H2CCO are presented in Figure 9. The CO/13CO ratio is close to the elemental isotopic value of 77.15 in the inner where CO gas is abundant. In regions where CO is depleted, the CO/13CO ratio is about , much smaller than the input atomic abundance ratio. The low CO/13CO ratio is inherited from the molecular cloud model.
In the inner disk, where new CO molecules are forming from recycled ketene that originally gained its carbon atoms from both CH4 and CO, the CO/13CO ratio approaches the input, atomic C/13C ratio. Integrated over the entire disk, the average CO/13CO ratio is . Disk mass estimates based on optically thin 13CO rotational emission (possible beyond AU; see Section 5) should account for isotopic fractionation.
In the shielded interior of our disk, we predict C16O/C17O and C16O/C18O ratios similar to those measured by Smith et al. (2009) from observations of the envelope of protostar Reipurth 50. Our computed CO/C17O and CO/C18O ratios are slightly smaller than the input and ratios throughout most of the disk, though the recycling of ketene back to CO pushes C16O/C17O and C16O/C18O higher near the disk surface. The CO oxygen isotope fractionation identified in our model has an average effect of less than (averaged over mass). We find that oxygen isotope fractionation would not significantly bias disk mass estimates based on C17O or C18O emission.
We also caution against over-interpretation of the oxygen isotope fractionation found in this model, as variations in UV flux that are well within observed ranges (France et al., 2014) can affect isotope ratios. In Miotello et al. (2014), UV radiation is not attenuated efficiently in disks with only larger grains. Rare CO isotopologues only exist in a smaller region further below the disk surface due to photo-dissociation, resulting in larger CO to rare CO ratios. In contrast, our models include a population of small dust grains even for models with grain evolution (Section 4.5.3), and therefore the UV radiation is sufficiently absorbed. Moreover, following Landry et al. (2013), our disk models only follow the disk up to about two scale heights, and do not follow the disk atmosphere, where photochemical reactions matter the most. This explains why unlike in Miotello et al. (2014), considering grain evolution does not significantly change the CO isotopologue ratios.
Having verified that our predicted 13CO, C18O, and C17O abundances are robust results that (1) do not depend heavily on our reaction network choice and (2) closely track observed values, we are now ready to calculate the optical depths of rotational emission lines.
5 Optical depth of rotational emission from CO isotopologues
Our goal is to demonstrate that rare CO isotopologues can provide a window into the planet formation zone through their rotational emission lines. The ideal emission line would be optically thin all the way to the disk midplane, but still detectable with ALMA. We calculate the optical depth of CO rotational emission lines at each disk radius by integrating the absorption efficiency through the disk. We first calculate the total absorption efficiency across the emission line as
| (32) |
in which
| (33) | ||||
| (34) | ||||
| (35) |
is the absorption coefficient, , and are the number of molecules in states i and j (i is the lower state), and and are the fraction of molecules in states i and j. and are the degeneracies; is the frequency of the transition; is the matrix element of the electric dipole moment for the transition; and and are the Einstein coefficients of the transition. Substituting into equation 32, we have:
| (36) |
We take as the local thermodynamic equilibrium (LTE) value set by the Boltzmann distribution.
To estimate the absorption at the line center , we divide the total absorption efficiency by the full-width half-maximum of the Doppler broadening profile:
| (37) |
where is the mass of the molecule. We then have
| (38) |
Finally, we compute face-on optical depths as a function of distance from the star by integrating the absorption efficiency over the disk’s vertical direction as
| (39) |
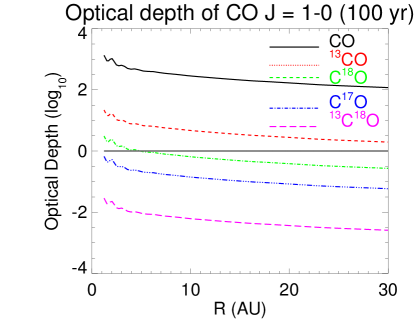
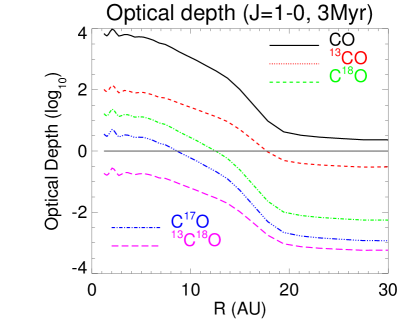
The optical depths of J lines for CO isotopologues are shown in the upper panels of Figure 10. The upper-left panel shows optical depths after 100 years of disk evolution (i.e., a disk surrounding a just-emerged T-Tauri star), and the upper-right panel shows the disk after 3 Myr of evolution. We highlight the J transition because the temperature of CO gas is relatively high compared to the energy needed to excite the J rotational level (), therefore J line is the most optically thin line among low order rotational lines observable with ALMA. We can immediately see that C17O traces the disk midplane outside AU, and C18O traces the midplane outside AU. Observations of C17O and C18O emission from nearby disks would provide estimates of the amount of mass available to form planets like Uranus and Neptune, and place a lower limit on the mass available to form Jupiter and Saturn.
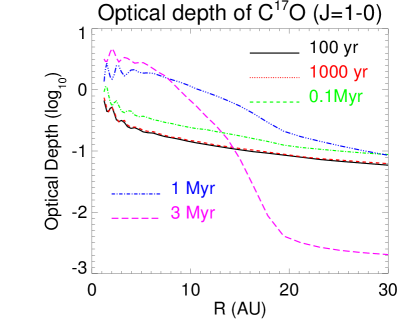
The optical depth of C17O as a function of radius is plotted for several epochs in the lower left panel of Figure 10. The optical depth is a strong function of radius and time. The optical depth in the inner part of the disk increases as the disk evolves due to the dissociation of CO2 into CO, while the optical depth beyond first increases, but then decreases and falls below the initial value due to the formation of more complex carbon-bearing molecules (sections 4.2, 4.3). At the optical depth remains above one out to about for CO, for 13CO, for C18O, and for C17O. The possibility that CO abundance changes over time due to chemical reactions means that disk masses measured by CO emission are degenerate with age.
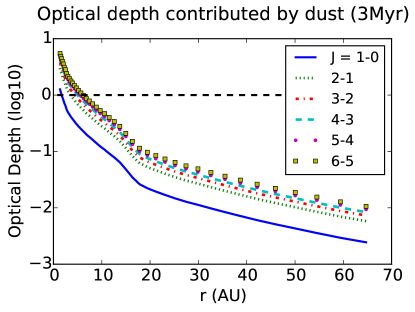
Continuum emission from dust also contributes flux at the frequencies of CO emission lines. Even if the emission from a CO isotopologue is optically thin, high optical depth in the dust could prevent us from seeing the disk midplane. To estimate the optical depth contributed by the dust, we integrate the dust opacity at the relevant wavelength over the disk height. We use opacities from Semenov et al. (2003), for grains with a 5-layered sphere topology. As in the thermodynamic model (see Section 2 for details), we use a gas to dust mass ratio of . We assume the dust has undergone some degree of grain growth, with remaining solids locked into larger bodies, consistent with our RADMC dust radiative transfer models. Optical depth contributed by dust is plotted in the lower right panel of Figure 10. The optical depths contributed by dust are almost the same for all isotopologues due to the small shift in frequency between emission lines, so we are only showing the frequency at the center of CO transitions. The optical depths contributed by dust are smallest for the J line due to lower frequency - less than one beyond , and less than beyond . The dust optical depth for higher order transitions become less then one within .
For low-mass disks that have experienced some grain growth, C17O is a promising tracer of the disk midplane in the giant planet-forming region. Outside of AU, where analogs to the Kuiper Belt may be forming (Bryden et al., 2009), C18O and 13CO may be useful midplane tracers. Note, however, that our fiducial model is a low-mass disk (), and the actual midplane locations traced by CO gas may therefore fall somewhat outside of AU. However, our results demonstrate the value of observing CO isotopologues to reconstruct the mass distributions in the inner AU of nearby disks.
6 Conclusions
Our chemical model of an MRI-active protoplanetary disk has led to the following conclusions.
CO does not freeze out anywhere in our modeled region - the inner of the disk - due to efficient heating by stellar irradiation. Instead, the abundance of CO is a complex function of both radius and time. This dependence must be modeled correctly in order to deduce gas properties from observations of CO isotopologues.
The fate of CO is tied up in the formation of complex organic molecules. While the detailed chemical evolution depends on the input abundances from the molecular cloud and which species are included in the network, the main result is robust to these variations. Different models of grain evolution also produce small changes in the outcomes. For three different chemical assumptions and two different scenarios for grain evolution, the partition of carbon, integrated over the modeled inner AU of the disk, ranges from to % in CO gas, % to % in CO2 ice, and to % in complex organic molecules.
Fractionation of oxygen isotopes appears not to play a major role in C17O abundances, though stars with unusually strong UV accretion luminosity may have disks depleted in C17O. The optical depth of low-J rotational lines of C17O are around unity in the giant planet forming region, while more common isotopologues are quite opaque. With our computed C17O/H2 abundance as a function of radius and an age, one would be able to translate the observed C17O line intensity into available planet-forming mass, to within a factor of a few. The optical depth of dust in the CO isotopologue (J) transition wavelengths is small enough to allow observations of the mid-plane beyond a few AU; for higher transitions the dust will be opaque within 5-8 AU. However, this result relies on our assumption of grain evolution, in which 90 of the solid mass has accumulated in pebbles and larger solid objects at the start of disk evolution at 0.1 , but our experiment with slower evolution of the gas to dust ratio produce similar results in the end.
Looking ahead to future work, we emphasize that emission lines from the CO isotopologues all have different optical depths and can probe different vertical layers of a target disk. Comparing line profiles of emission from multiple isotopologues could reveal vertical variations in turbulent velocity, and therefore constrain the angular momentum transfer mechanism that drives the disk evolution. The current leading angular momentum transfer mechanism—MRI turbulence—predicts non-turbulent “dead” zones on the disk midplane, which leads to a decrease of the turbulent velocity toward the midplane (Fromang & Nelson (2006), Simon et al. (2011)). However, new models by Bai & Stone (2013) and Gressel et al. (2015) suggest that magnetocentrifugal winds are more likely to drive accretion than the MRI. Aside from possibly driving accretion, turbulence also determines the behavior of dust grains to a great extent. An observational investigation of gas velocities in the midplanes of planet-forming disks would have profound implications for planetesimal growth models. ALMA is able to detect emission from multiple CO isotopologues in one observation. With its new long baselines and large collecting area, it is sensitive to the inner regions of disks, which have small emitting areas but contribute appreciably to line wings. CO observations may be able to probe not only the mass distribution in planet-forming regions, but the gas dynamics as well.
We conclude that CO isotopologue rotational emission can probe the mass distribution and chemical evolution of the inner radii of protostellar disks, allowing observers to peer directly into planet nurseries.
Acknowledgments: Work by MY, KW, SDR and NJT was supported by NASA grant NNX10AH28G. NJE and MY were supported in part by NSF Grant AST-1109116 to the University of Texas at Austin. This work was performed in part at the Jet Propulsion Laboratory, California Institute of Technology. NJT was supported by grant 13-OSS13-0114 from the NASA Origins of Solar Systems program. We are grateful to the referee for helpful suggestions. We would like to thank Edwin Bergin, Jacob Simon, Ilse Cleeves, Jeong-Eun Lee, Seok-Ho Lee, Jeffrey Cuzzi, Paul Estrada, Colette Salyk, Karin Öberg, and Raquel Salmeron for useful discussions.
References
- Alexander et al. (2006) Alexander, R. D., Clarke, C. J., & Pringle, J. E. 2006, MNRAS, 369, 229
- Ali-Dib et al. (2014a) Ali-Dib, M., Mousis, O., Petit, J.-M., & Lunine, J. I. 2014a, ApJ, 785, 125
- Ali-Dib et al. (2014b) —. 2014b, ApJ, 793, 9
- ALMA Partnership et al. (2015) ALMA Partnership, Brogan, C. L., Pérez, L. M., et al. 2015, ApJ, 808, L3
- Bai & Goodman (2009) Bai, X.-N., & Goodman, J. 2009, ApJ, 701, 737
- Bai & Stone (2013) Bai, X.-N., & Stone, J. M. 2013, ApJ, 769, 76
- Balbus & Hawley (1991) Balbus, S. A., & Hawley, J. F. 1991, ApJ, 376, 214
- Banzatti et al. (2011) Banzatti, A., Testi, L., Isella, A., et al. 2011, A&A, 525, A12
- Bergin et al. (2013) Bergin, E. A., Cleeves, L. I., Gorti, U., et al. 2013, Nature, 493, 644
- Birnstiel et al. (2011) Birnstiel, T., Ormel, C. W., & Dullemond, C. P. 2011, A&A, 525, A11
- Bryden et al. (2009) Bryden, G., Beichman, C. A., Carpenter, J. M., et al. 2009, ApJ, 705, 1226
- Chiang & Goldreich (1997) Chiang, E. I., & Goldreich, P. 1997, ApJ, 490, 368
- Cleeves et al. (2013a) Cleeves, L. I., Adams, F. C., & Bergin, E. A. 2013a, ApJ, 772, 5
- Cleeves et al. (2013b) Cleeves, L. I., Adams, F. C., Bergin, E. A., & Visser, R. 2013b, ApJ, 777, 28
- D’Antona & Mazzitelli (1994) D’Antona, F., & Mazzitelli, I. 1994, ApJS, 90, 467
- Dodson-Robinson & Bodenheimer (2010) Dodson-Robinson, S. E., & Bodenheimer, P. 2010, Icarus, 207, 491
- Dodson-Robinson et al. (2009) Dodson-Robinson, S. E., Willacy, K., Bodenheimer, P., Turner, N. J., & Beichman, C. A. 2009, Icarus, 200, 672
- Dullemond & Dominik (2004) Dullemond, C. P., & Dominik, C. 2004, A&A, 421, 1075
- Dunham & Vorobyov (2012) Dunham, M. M., & Vorobyov, E. I. 2012, ApJ, 747, 52
- France et al. (2014) France, K., Schindhelm, E., Bergin, E. A., Roueff, E., & Abgrall, H. 2014, ApJ, 784, 127
- Fromang & Nelson (2006) Fromang, S., & Nelson, R. P. 2006, A&A, 457, 343
- Garaud et al. (2013) Garaud, P., Meru, F., Galvagni, M., & Olczak, C. 2013, ApJ, 764, 146
- Garmire et al. (2000) Garmire, G., Feigelson, E. D., Broos, P., et al. 2000, AJ, 120, 1426
- Garrod & Pauly (2011) Garrod, R. T., & Pauly, T. 2011, ApJ, 735, 15
- Graedel et al. (1982) Graedel, T. E., Langer, W. D., & Frerking, M. A. 1982, ApJS, 48, 321
- Gredel et al. (1989) Gredel, R., Lepp, S., Dalgarno, A., & Herbst, E. 1989, ApJ, 347, 289
- Gressel et al. (2015) Gressel, O., Turner, N. J., Nelson, R. P., & McNally, C. P. 2015, ApJ, 801, 84
- Grevesse & Sauval (1998) Grevesse, N., & Sauval, A. J. 1998, Space Sci. Rev., 85, 161
- Guilloteau et al. (2011) Guilloteau, S., Dutrey, A., Piétu, V., & Boehler, Y. 2011, A&A, 529, A105
- Habing (1968) Habing, H. J. 1968, Bull. Astron. Inst. Netherlands, 19, 421
- Henning & Stognienko (1996) Henning, T., & Stognienko, R. 1996, A&A, 311, 291
- Hollenbach et al. (2009) Hollenbach, D., Kaufman, M. J., Bergin, E. A., & Melnick, G. J. 2009, ApJ, 690, 1497
- Igea & Glassgold (1999) Igea, J., & Glassgold, A. E. 1999, ApJ, 518, 848
- Isella et al. (2010) Isella, A., Carpenter, J. M., & Sargent, A. I. 2010, ApJ, 714, 1746
- Kraus & Ireland (2012) Kraus, A. L., & Ireland, M. J. 2012, ApJ, 745, 5
- Landry et al. (2013) Landry, R., Dodson-Robinson, S. E., Turner, N. J., & Abram, G. 2013, ApJ, 771, 80
- Langer & Penzias (1993) Langer, W. D., & Penzias, A. A. 1993, ApJ, 408, 539
- Lee et al. (1996) Lee, H.-H., Herbst, E., Pineau des Forets, G., Roueff, E., & Le Bourlot, J. 1996, A&A, 311, 690
- Mathis et al. (1977) Mathis, J. S., Rumpl, W., & Nordsieck, K. H. 1977, ApJ, 217, 425
- Miotello et al. (2014) Miotello, A., Bruderer, S., & van Dishoeck, E. F. 2014, A&A, 572, A96
- Öberg et al. (2011a) Öberg, K. I., Boogert, A. C. A., Pontoppidan, K. M., et al. 2011a, ApJ, 740, 109
- Öberg et al. (2011b) Öberg, K. I., Murray-Clay, R., & Bergin, E. A. 2011b, ApJ, 743, L16
- Oliveira et al. (2010) Oliveira, I., Pontoppidan, K. M., Merín, B., et al. 2010, ApJ, 714, 778
- Pérez et al. (2012) Pérez, L. M., Carpenter, J. M., Chandler, C. J., et al. 2012, ApJ, 760, L17
- Pérez et al. (2015) Pérez, L. M., Chandler, C. J., Isella, A., et al. 2015, ApJ, 813, 41
- Piso et al. (2015) Piso, A.-M. A., Öberg, K. I., Birnstiel, T., & Murray-Clay, R. A. 2015, ApJ, 815, 109
- Pollack et al. (1985) Pollack, J. B., McKay, C. P., & Christofferson, B. M. 1985, Icarus, 64, 471
- Qi et al. (2011) Qi, C., D’Alessio, P., Öberg, K. I., et al. 2011, ApJ, 740, 84
- Qi et al. (2013) Qi, C., Öberg, K. I., & Wilner, D. J. 2013, ApJ, 765, 34
- Robrade et al. (2014) Robrade, J., Güdel, M., Günther, H. M., & Schmitt, J. H. M. M. 2014, A&A, 561, A124
- Semenov et al. (2003) Semenov, D., Henning, T., Helling, C., Ilgner, M., & Sedlmayr, E. 2003, A&A, 410, 611
- Shakura & Sunyaev (1973) Shakura, N. I., & Sunyaev, R. A. 1973, A&A, 24, 337
- Simon et al. (2011) Simon, J. B., Armitage, P. J., & Beckwith, K. 2011, ApJ, 743, 17
- Smith et al. (2009) Smith, R. L., Pontoppidan, K. M., Young, E. D., Morris, M. R., & van Dishoeck, E. F. 2009, ApJ, 701, 163
- Tazzari et al. (2015) Tazzari, M., Testi, L., Ercolano, B., et al. 2015, ArXiv e-prints, arXiv:1512.05679
- Telleschi et al. (2007) Telleschi, A., Güdel, M., Briggs, K. R., Audard, M., & Scelsi, L. 2007, A&A, 468, 443
- Thommes et al. (2002) Thommes, E. W., Duncan, M. J., & Levison, H. F. 2002, AJ, 123, 2862
- Tsiganis et al. (2005) Tsiganis, K., Gomes, R., Morbidelli, A., & Levison, H. F. 2005, Nature, 435, 459
- Umebayashi & Nakano (1981) Umebayashi, T., & Nakano, T. 1981, PASJ, 33, 617
- Umebayashi & Nakano (2009) —. 2009, ApJ, 690, 69
- van Dishoeck & Black (1988) van Dishoeck, E. F., & Black, J. H. 1988, ApJ, 334, 771
- Visser et al. (2009) Visser, R., van Dishoeck, E. F., & Black, J. H. 2009, A&A, 503, 323
- Williams & Cieza (2011) Williams, J. P., & Cieza, L. A. 2011, ARA&A, 49, 67
- Woodall et al. (2007) Woodall, J., Agúndez, M., Markwick-Kemper, A. J., & Millar, T. J. 2007, A&A, 466, 1197
- Woods & Willacy (2009) Woods, P. M., & Willacy, K. 2009, ApJ, 693, 1360
| Symbol | Definition or Value |
|---|---|
| ISRF | Interstellar radiation field |
| for the ionizing UV radiation | |
| COM | Complex organic molecules |
| MRI | Magneto-rotational instability |
| Stellar mass | , we follow the stellar evolution from (, and ), to (, and ). |
| Disk mass | within from the central star |
| n | number density of hydrogen molecules |
| fH | 0.735, mass fraction of hydrogen |
| Abundance - A(B) | number density with respect to the number density of hydrogen nuclei (n). A(B) stands for A |
| T | disk temperature (same for dust and gas) |
| Teq | equilibrium temperature contributed by stellar irradiation |
| Tacc | accretion temperature contributed by the MRI turbulence |
| s-1, ionization rate for direct x-ray absorption | |
| s-1, ionization rate for scattered x-ray photons | |
| , stellar X-ray luminosity in units of | |
| gcm-2, characteristic column density of attenuation for cosmic rays | |
| cosmic ray ionization rate, s-1 for H2 molecules when calculating the reactions lead by cosmic ray induced photons, the total ionization rate is taken as s-1. |
| Species | Abundance 1,2 | Element | Abundance |
|---|---|---|---|
| H | 1.00 (-2) | He | 1.40 (-1) |
| C+ | 7.21 (-5) | 13C+ | 9.34 (-7) |
| O | 1.76 (-4) | 18O | 3.51 (-7) |
| 17O | 7.64 (-8) | N | 2.14 (-5) |
| Si+ | 3.00 (-9) |
1 Number density with respect to the number density of hydrogen nuclei (n). The abundances are taken from Graedel et al. (1982).
2 A(B) stands for A
| Species | Binding Energy (K) 1,2 | Ice line ( yr) 3 | Ice line () 3 |
|---|---|---|---|
| H2O | 5.77 (3) | ||
| CO2 | 2.86 (3) | ||
| CO | 8.55 (2) | ||
| CH4 | 1.08 (3) | ||
| Species | Binding Energy (K) | Ice location () 4 | |
| CH3 | 1.16 (3) | ||
| CH3OH | 4.23 (3) | rAU, z=AU, and rAU | |
| C2H2 | 2.40 (3) | surface | |
| C2H3 | 1.76 (3) | ||
| C2H4 | 2.01 (3) | ||
| C2H5 | 2.11 (3) | AU | |
| C2H6 | 2.32 (3) | ||
| H2CCO | 2.52 (3) | most of the disk AU | |
| CH3CHO | 2.87 (3) | rAU, zAU | |
| H2CO | 1.76 (3) | ||
1 Binding energy is cited in energy (E in erg)
divided by Boltzmann’s constant (kB in erg/K) for easy
interpretation, therefore has a unit of Kelvin.
2 A(B) stands
for A
3 The ice line (condensation front) location
on the disk midplane.
4 For CH3OH, C2H2, C2H5,
H2CCO, and CH3CHO, we mark the location where we see certain ice
species, which depend on both the condensation temperature and the
ability to form the molecule. The change of abundance can be
very gradual. Here we quote the boundary location where of
carbon is stored in corresponding species. We are only showing
results for the end of evolution () because those molecules are
not formed until about into the disk evolution.
| Ice species | MC fraction 1 | c2d fraction 2 | MC abundance 3 | c2d abundance 4 |
|---|---|---|---|---|
| H2O | 100 | 100 | ||
| CO2 | 35 | 28 | ||
| CH4 | 24 | 5 | ||
| CO | 15 | 29 | ||
| Gas species | ||||
| CO | NA 5 |
1 Fractional abundances in our molecular cloud model, normalized to
the H2O ice abundance.
2 Fractional abundances in the c2d result, normalized to
the H2O ice abundance.
3 Output abundances in our molecular cloud model.
4 Abundances scaled according to the c2d result, using the H2O
abundance as the reference.
5 Öberg et al. (2011a) does not include gaseous species.
| Ice | Standard1 | Low H2CCO2 | c2d3 | evolving D/G |
|---|---|---|---|---|
| CO2 | ||||
| CH3OH | ||||
| CH3CHO | ||||
| H2CCO | ||||
| C2Hx 4 | ||||
| COM 5 | ||||
| Gas | ||||
| CO | ||||
| CH4 |
1 Model with original reaction rates and the input
from our cloud model abundances. The percentage of total available
carbon contained in each species is shown in the table. All the
results are values integrated over the entire disk at the end of our
modeled disk evolution at .
2 Model with small H2CCO formation rates and the input from our cloud model
abundances.
3 Model with original
reaction rates and the input adjusted to the c2d fractional
abundances. See Table 4 for details.
4 Hydrocarbons that contain two carbon
atoms.
5 The total abundance of complex organic molecules,
including CH4, CH3OH, H2CCO, CH3CHO, and C2Hx.
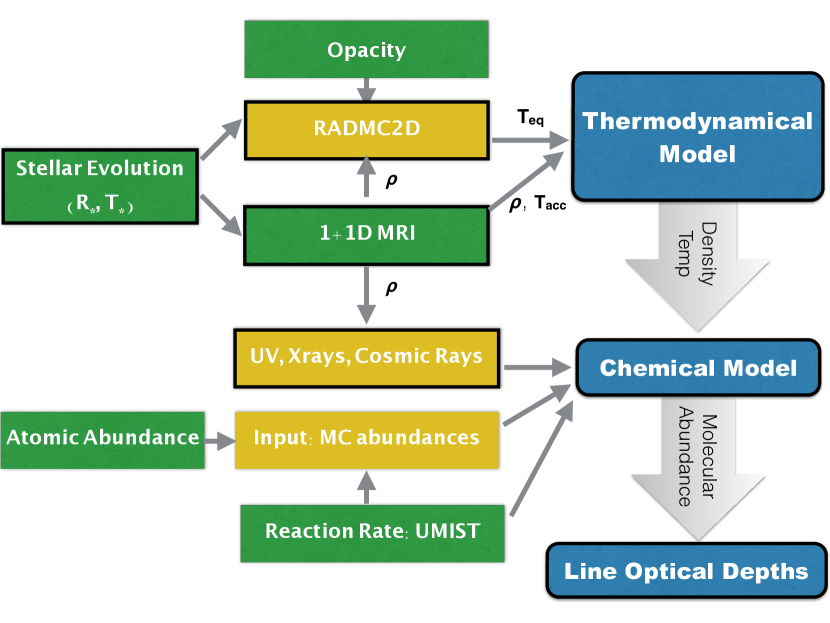
Blue boxes show three major components of our disk model. Green boxes show the model inputs taken directly from the literature, and yellow boxes are showing intermediate results computed in our study. Quantities in boxes with black borders evolve as a function of time, and the quantities in boxes without borders do not change over time.
The arrows and variables next to the arrows are showing how information is passed between different model components.

 |
 |
 |
 |
 |
 |
 |
 |
 |
 |
 |
 |
 |
 |
 |
 |
 |
 |
 |
 |
 |
 |
 |
 |
 |
 |