Inverse correlation between quasiparticle mass and in a cuprate high- superconductor
Abstract
Close to a zero temperature transition between ordered and disordered electronic phases, quantum fluctuations can lead to a strong enhancement of the electron mass and to the emergence of competing phases such as superconductivity. A correlation between the existence of such a quantum phase transition and superconductivity is quite well established in some heavy fermion and iron-based superconductors and there have been suggestions that high temperature superconductivity in the copper oxide materials (cuprates) may also be driven by the same mechanism. Close to optimal doping, where the superconducting transition temperature is maximum in the cuprates, two different phases are known to compete with superconductivity: a poorly understood pseudogap phase and a charge ordered phase. Recent experiments have shown a strong increase in quasiparticle mass in the cuprate YBa2Cu3O7-δ as optimal doping is approached suggesting that quantum fluctuations of the charge ordered phase may be responsible for the high- superconductivity. We have tested the robustness of this correlation between and by performing quantum oscillation studies on the stoichiometric compound YBa2Cu4O8 under hydrostatic pressure. In contrast to the results for YBa2Cu3O7-δ, we find that in YBa2Cu4O8 the mass decreases as increases under pressure. This inverse correlation between and suggests that quantum fluctuations of the charge order enhance but do not enhance .
Introduction
In a variety of systems: organics, heavy fermions, iron-pnictides, and copper-oxides (cuprates) superconductivity is found in close proximity to an antiferromagnetic phase (1-4). Starting with the non-superconducting parent antiferromagnetic phase, as the material properties are tuned by the application of pressure or chemical doping, the magnetic ordering temperature decreases. The doping/pressure where extrapolates to zero is known as a quantum critical point (QCP). In many systems the superconducting transition temperature is maximum close the doping/pressure where the QCP is located thus suggesting an intimate connection between the two. Close to a QCP, quantum fluctuations between the ordered magnetic phase and the disordered paramagnetic phase become strong and if such fluctuations produce electron-pairing this may enhance . The strong fluctuations also affect the normal-state properties, causing a strong increase in quasiparticle mass and non-Fermi liquid behavior of the transport properties. Hence close to a QCP the normal-state entropy is increased and this too could provide a boost for (1,3).
The applicability of such a quantum critical scenario to the cuprate superconductors is somewhat debatable, as in these materials is zero close to the QCP of the antiferromagnetic phase. Instead is maximal close to the end points of two other phases: the pseudogap phase and a charge density wave (CDW) phase. Whether there is a QCP at the end points of either of these phases is unclear, as is their exact position (5, 6). The nature and origin of the long established pseudogap phase, which can be characterized as a depression of the density of states at the Fermi level (7) and a decoherence of quasiparticles on certain parts of the Fermi surface (8), is not well understood. In contrast, the more recently discovered CDW phases (9-11) seems to be more conventional, although many aspects, such as the microscopic mechanism of their formation and their variation with pressure still need to be clarified. There are two distinct CDW phases. One phase, which is essentially two-dimensional, forms independent of magnetic field below K (10, 11), whereas a second distinct three-dimensional order forms for fields above 15 T and below K (9, 12, 13).
A CDW produces an additional periodic potential which reduces the size of the Brillouin zone and folds the Fermi surface into small Fermi pockets. There is compelling evidence that a CDW induced Fermi surface reconstruction is responsible for the small Fermi surface pockets which are observed in quantum oscillation (QO) measurements (14), so QO give a precise way of characterizing the normal state electronic structure and how this is affected by the CDW. In particular, from the thermal damping of the QO amplitude the quasiparticle mass can be inferred. is directly related to the renormalization of the band-structure close to the Fermi level coming from the interaction of the electrons with collective excitations such as phonons or spin/CDW fluctuations.
Recently, the variation of in the cuprate YBa2Cu3O7-δ (Y123) was measured over a wide range of hole doping () (15, 16). A dome shaped variation of versus was found, with extrapolating to zero at two points, , and . This is suggestive of QCPs close to and and as the latter value is close to the value () where is maximal (17) this may indicate that the interactions responsible for the mass enhancement also give rise to the high superconductivity (18). It is natural to assume that these interactions are the fluctuations of the CDW although additional coupling to the pseudogap fluctuations are also a possible cause (15).
Although chemical doping, for example by changing the oxygen content in Y123, is the most widely used method of tuning the properties of cuprates, pressure is another available tuning parameter, and indeed the highest transition temperatures are achieved under high pressure (19). Here we report measurements of quantum oscillations under high pressure in the stoichiometric cuprate YBa2Cu4O8 (Y124). This allows us to study how the electronic correlations evolve as is increased with pressure in a single sample with fixed stoichiometry.
Y124 has a similar structure to Y123 but with a double CuO chain layer. Unlike Y123, in Y124 the oxygen stoichiometry is fixed and so cannot be used to change the doping or . However, the application of hydrostatic pressure to Y124 leads to a strong increase in of 5.5 K/GPa at low pressure (20), increasing from 79 K at ambient pressure (20) [where (21)] to K at 8 GPa (22, 23) at which point it undergoes a structural phase transition and becomes non-superconducting (24, 25). While direct (x-ray or NMR) evidence for the existence of a CDW in Y124 is missing up to now, its existence is likely as the transport properties (26) show similar features to those in Y123 which have been ascribed to CDW formation and most importantly, QO with frequency similar to Y123, which is a key signature of the Fermi surface reconstruction caused by CDW formation, have been observed (21, 27).
Results
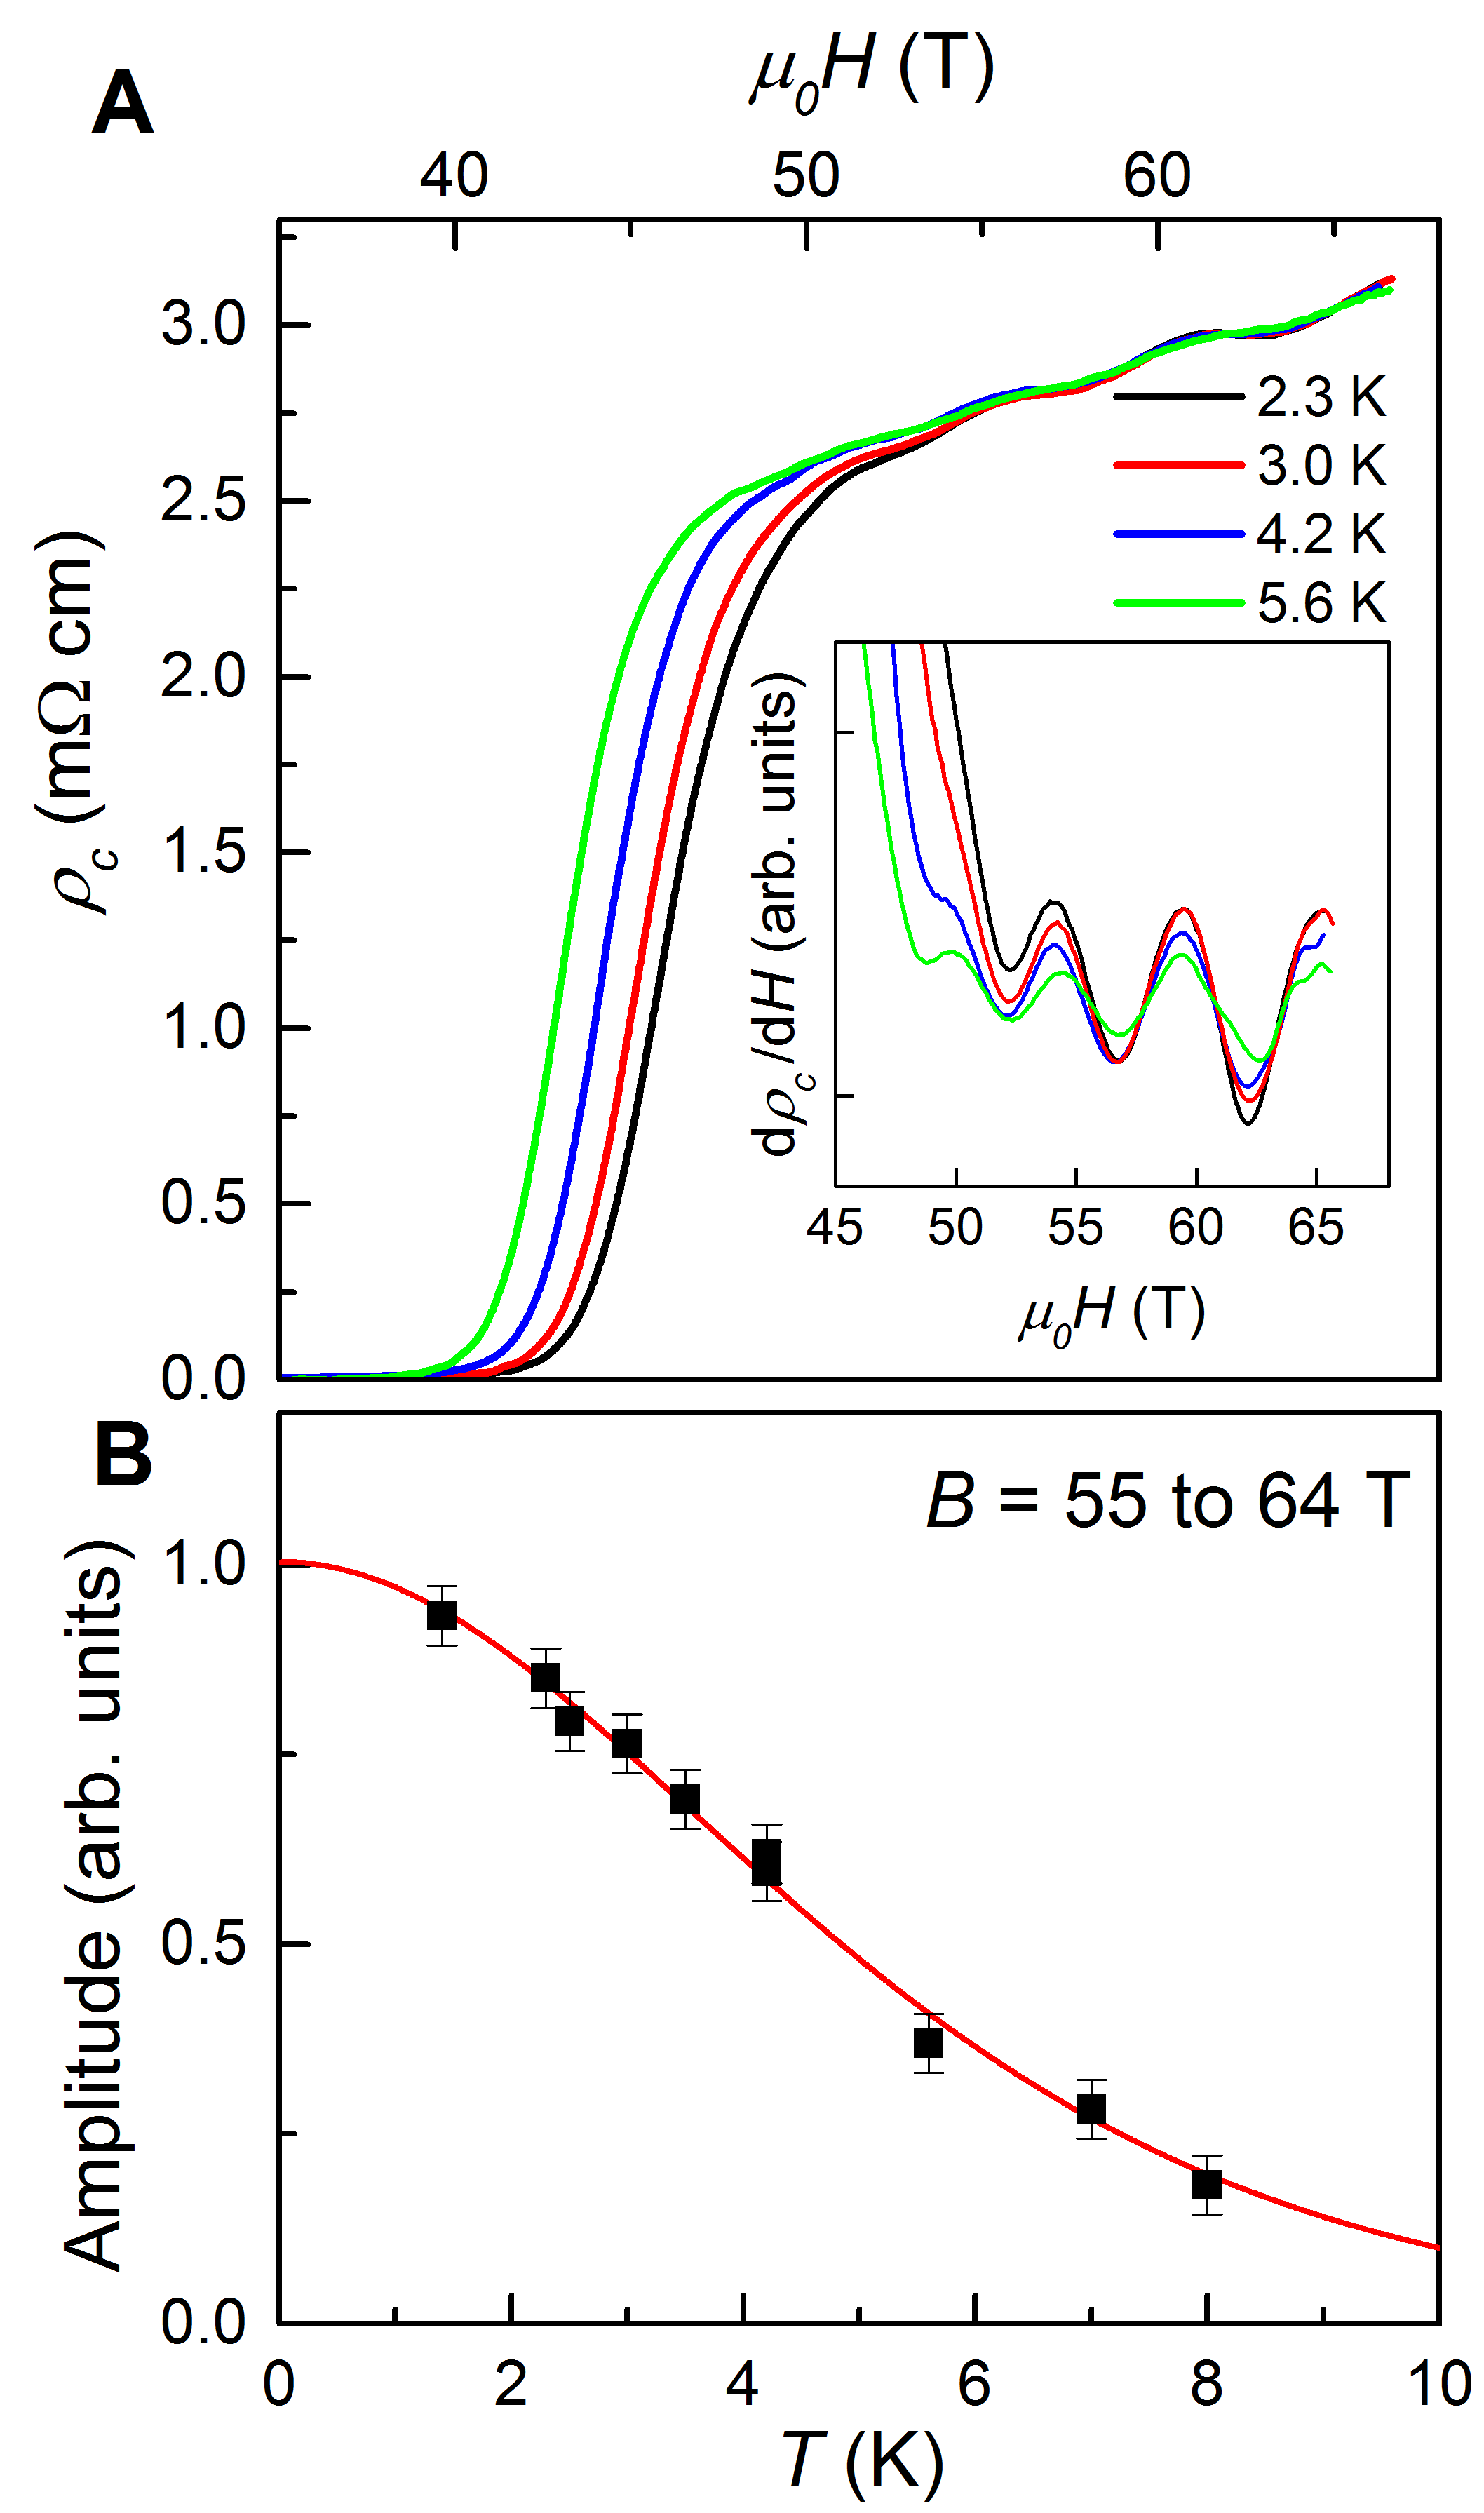
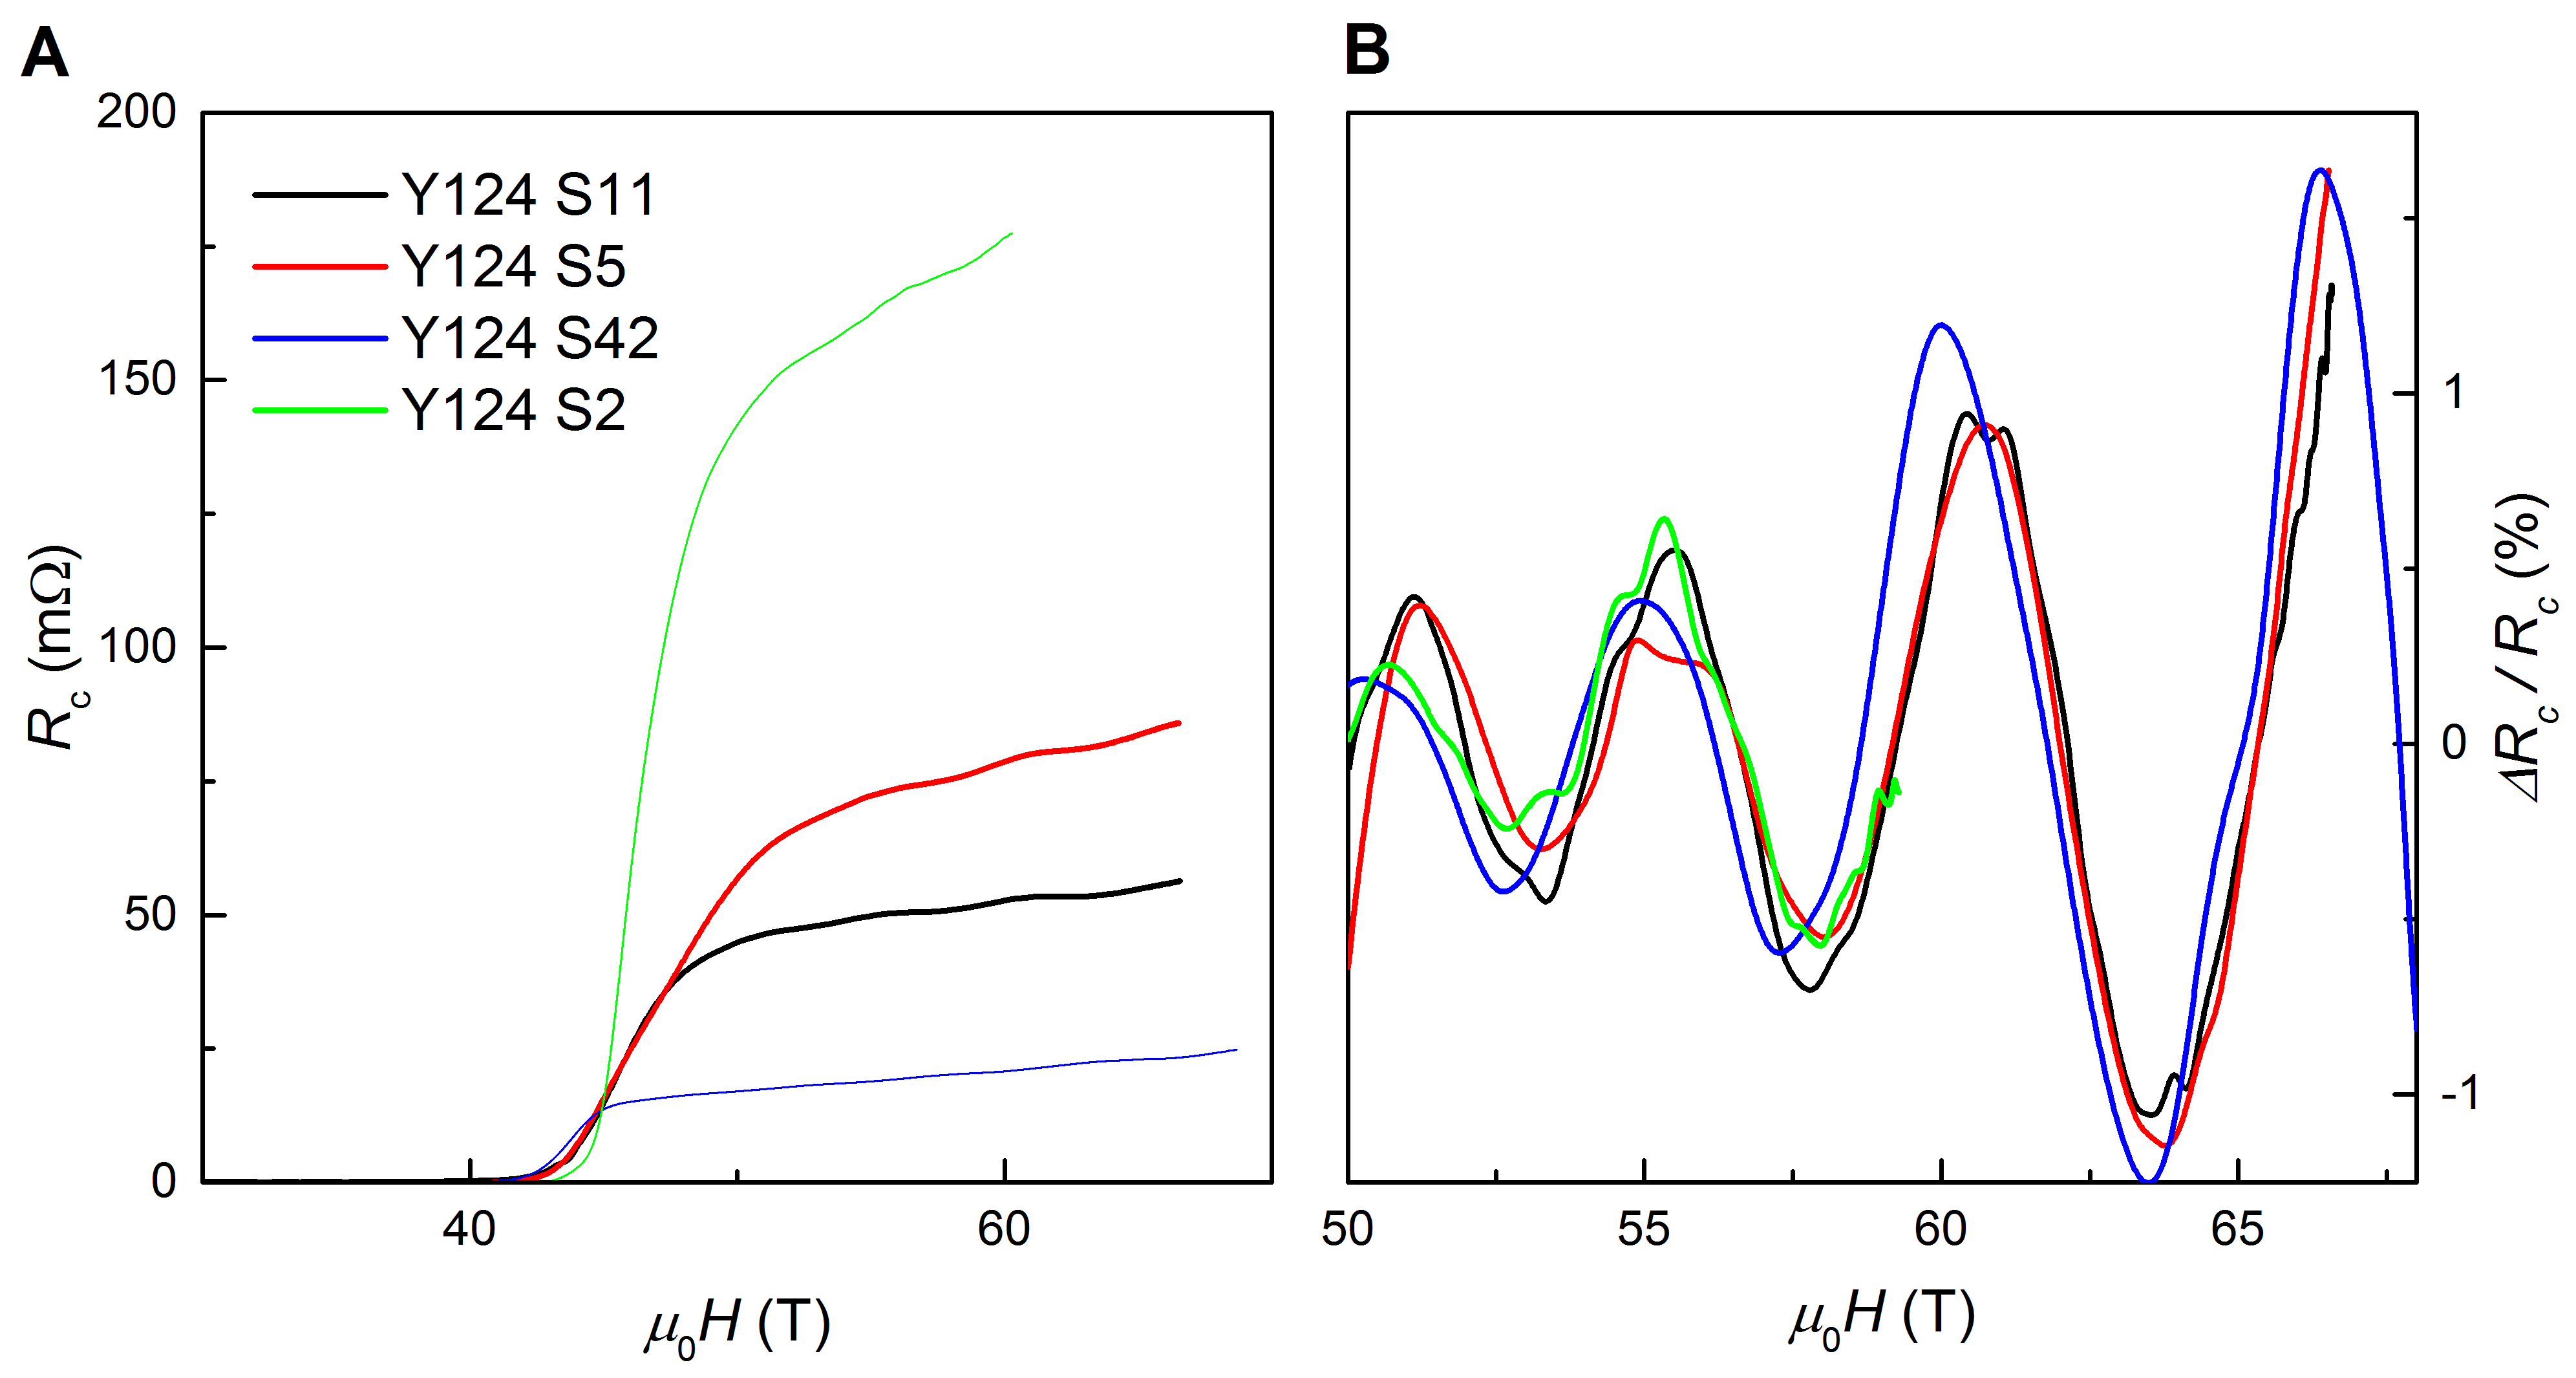
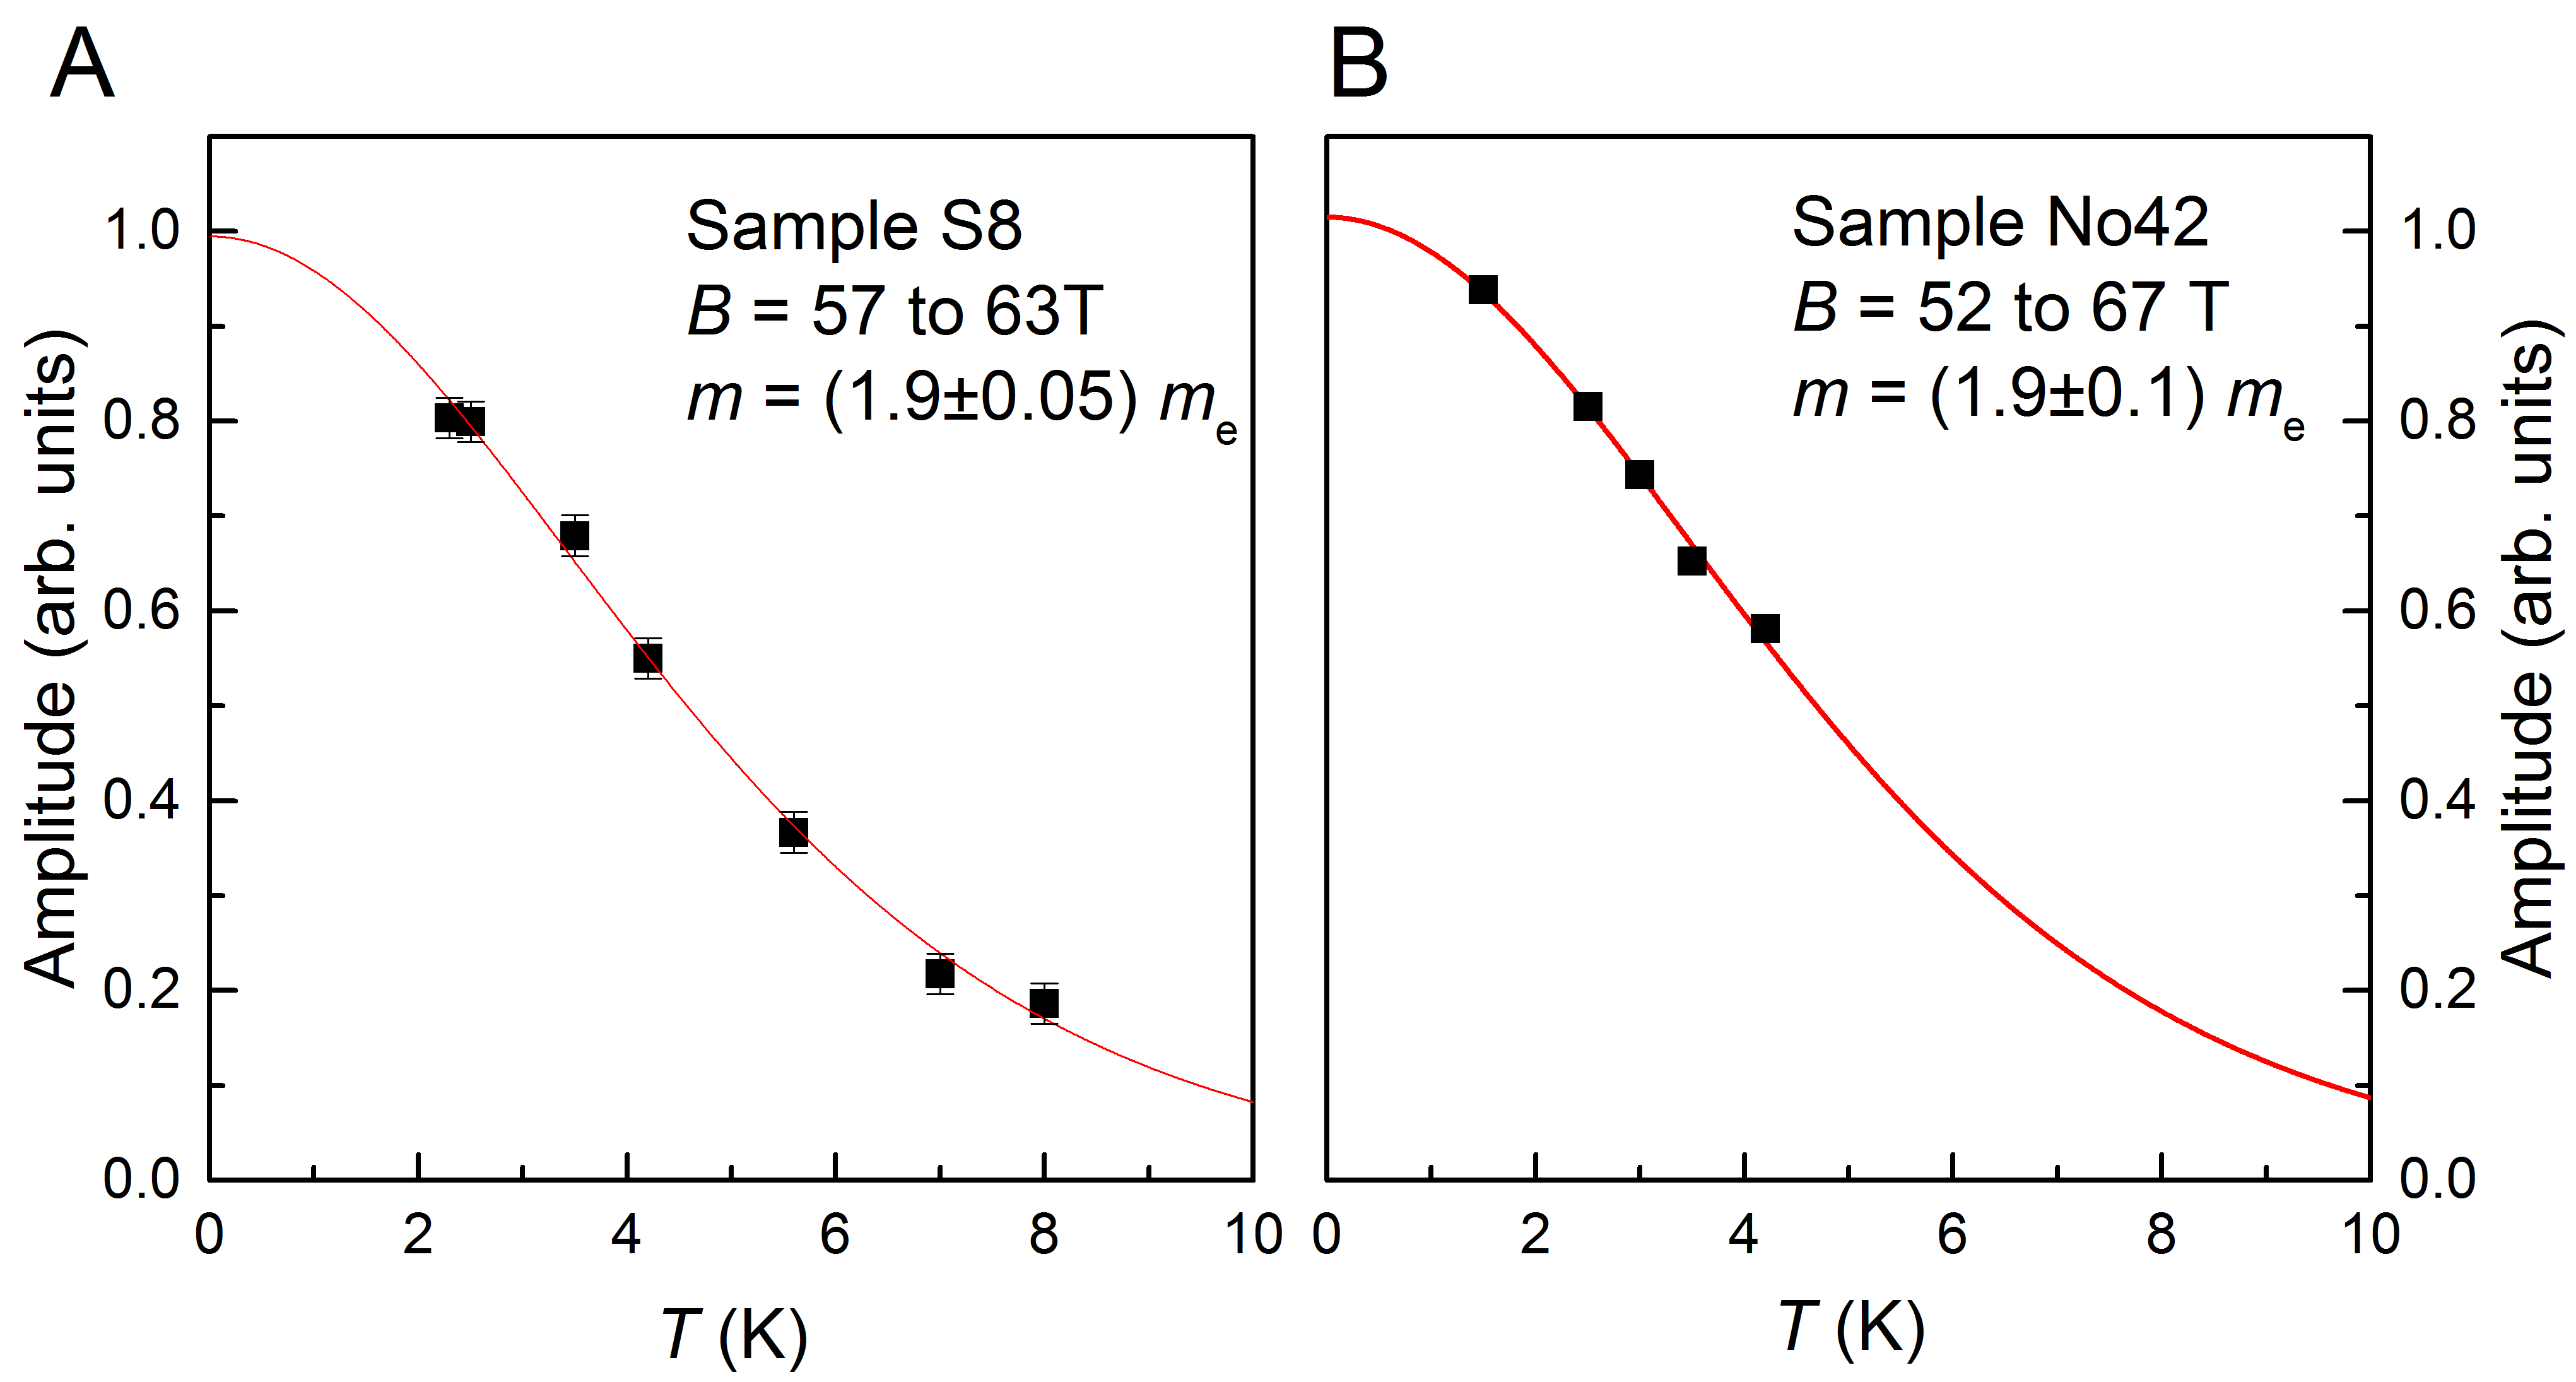
Ambient-pressure measurements of the -axis resistivity in pulsed magnetic field up to 67 T applied parallel to (perpendicular to the CuO2 planes) of a single crystal sample of Y124 are shown in Fig. 1. Shubnikov-de Haas quantum oscillations in the resistance are clearly visible in the raw data above 52 T, but are more clearly seen in the (inset Fig.1). The frequency (in inverse field) of these oscillations is 640 T consistent with previous reports (21, 27). The size of the oscillations is remarkably reproducible between different crystals (Fig. S1). By fitting the temperature dependence of the oscillation amplitude the quasiparticle mass can be extracted (Fig. 1B). We find a value of =1.80(5) (in units of the free electron mass). A value of =1.9(1) was measured in a two further samples (Fig. S2). This is consistent with another recent study (28) however older measurements (21, 27) found larger values of but the errors were considerably larger than in the present work (see also methods).
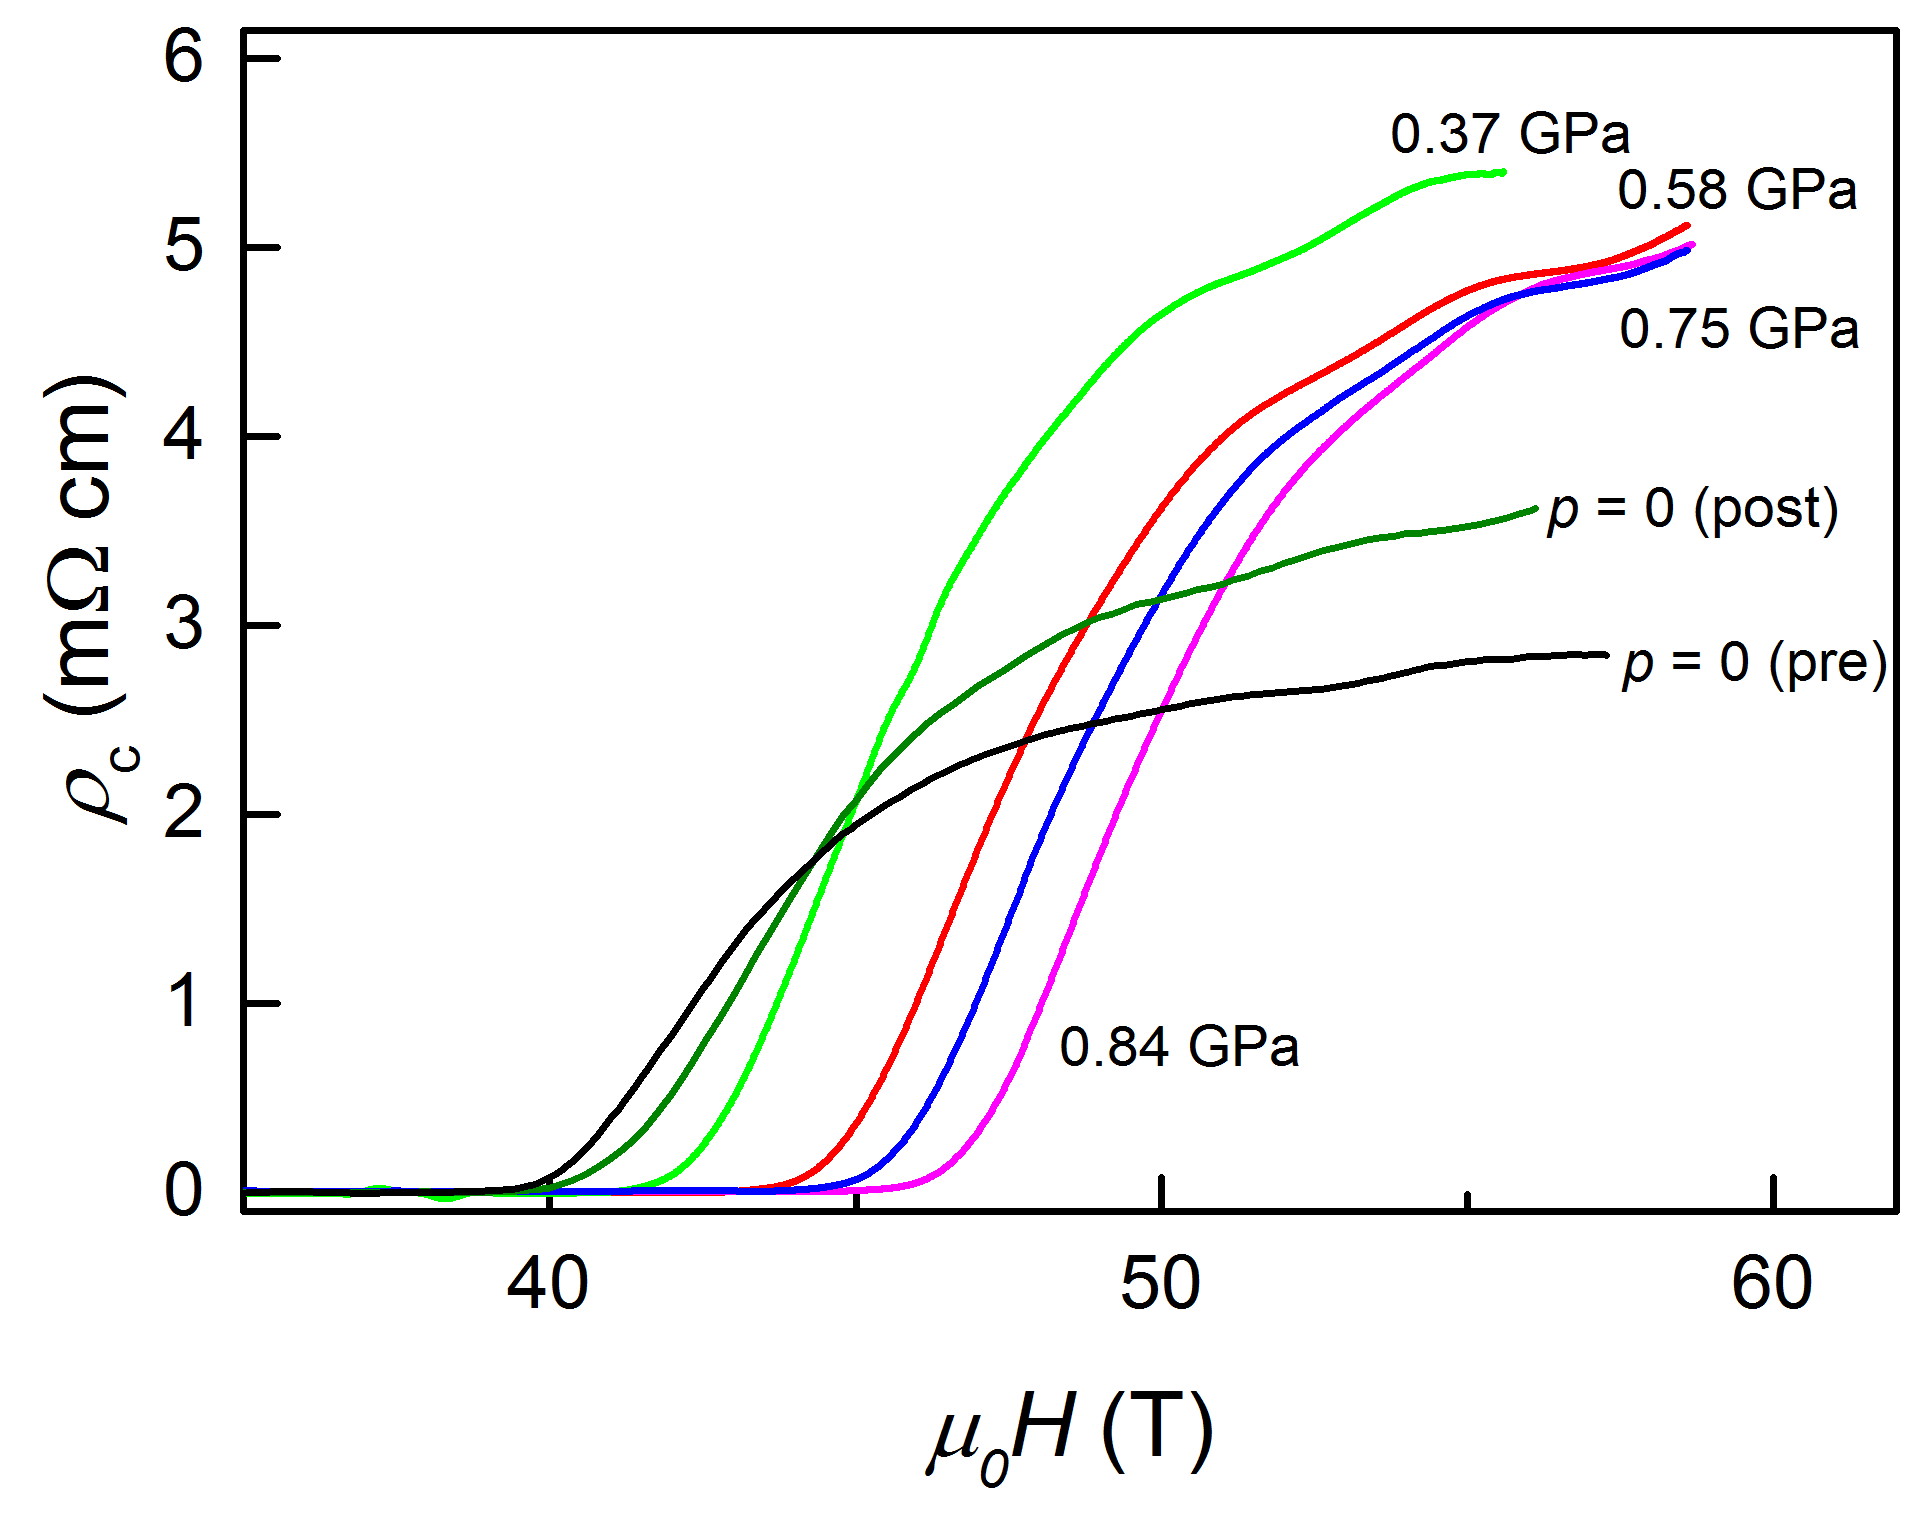
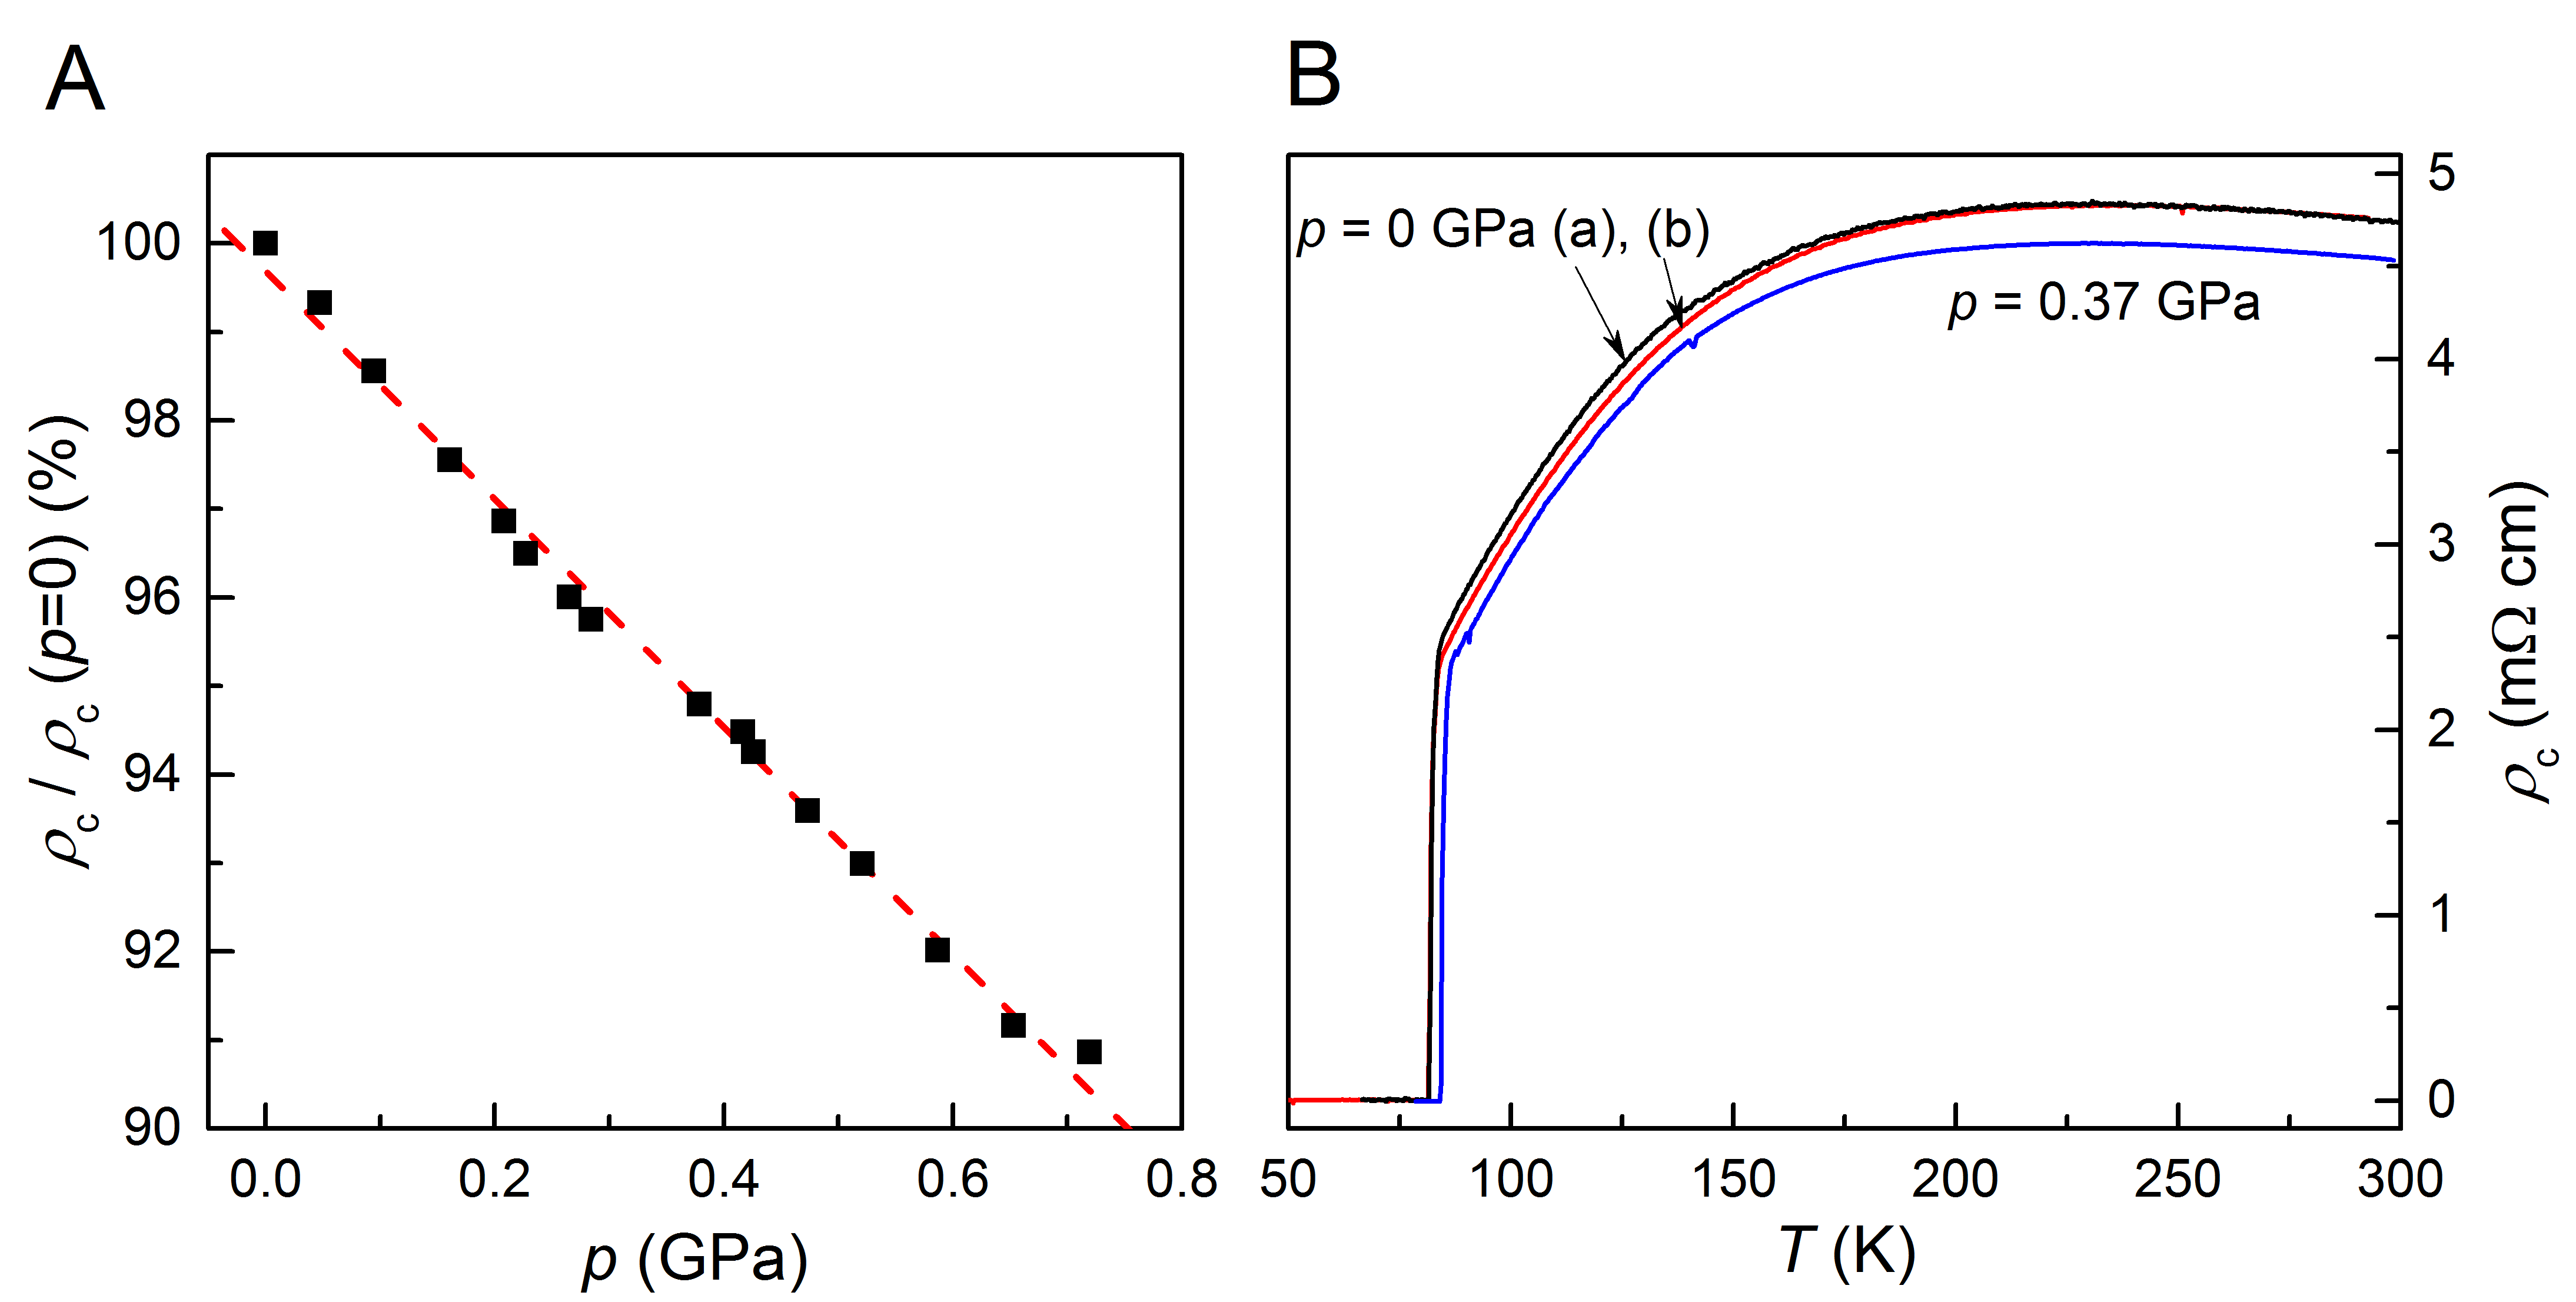
This same sample was then transferred to a non-metallic pressure cell (29). Measurements of at different applied pressures () up to GPa are shown in Fig. 2. Because of the larger bore of the magnet used for the pressure cell measurement, the maximum field here was 58 T. At room temperature decreases linearly with increasing pressure (Fig. S3A) and this decrease is essentially independent of temperature down to (Fig. S3B). However, when superconductivity is suppressed by field at low temperatures, a dramatically different behavior emerges. As can be seen in Fig. 2, both the magnitude of the resistivity and its slope at 2.5 K and 50 T almost doubles between and 0.37 GPa (which is the lowest pressure we are able to apply), which suggests that at low temperature, the size of the magnetoresistance has been significantly increased by the application of pressure, presumably due to an increase of the mean-free-path on some part of the Fermi surface. This result was reproduced in 3 samples.
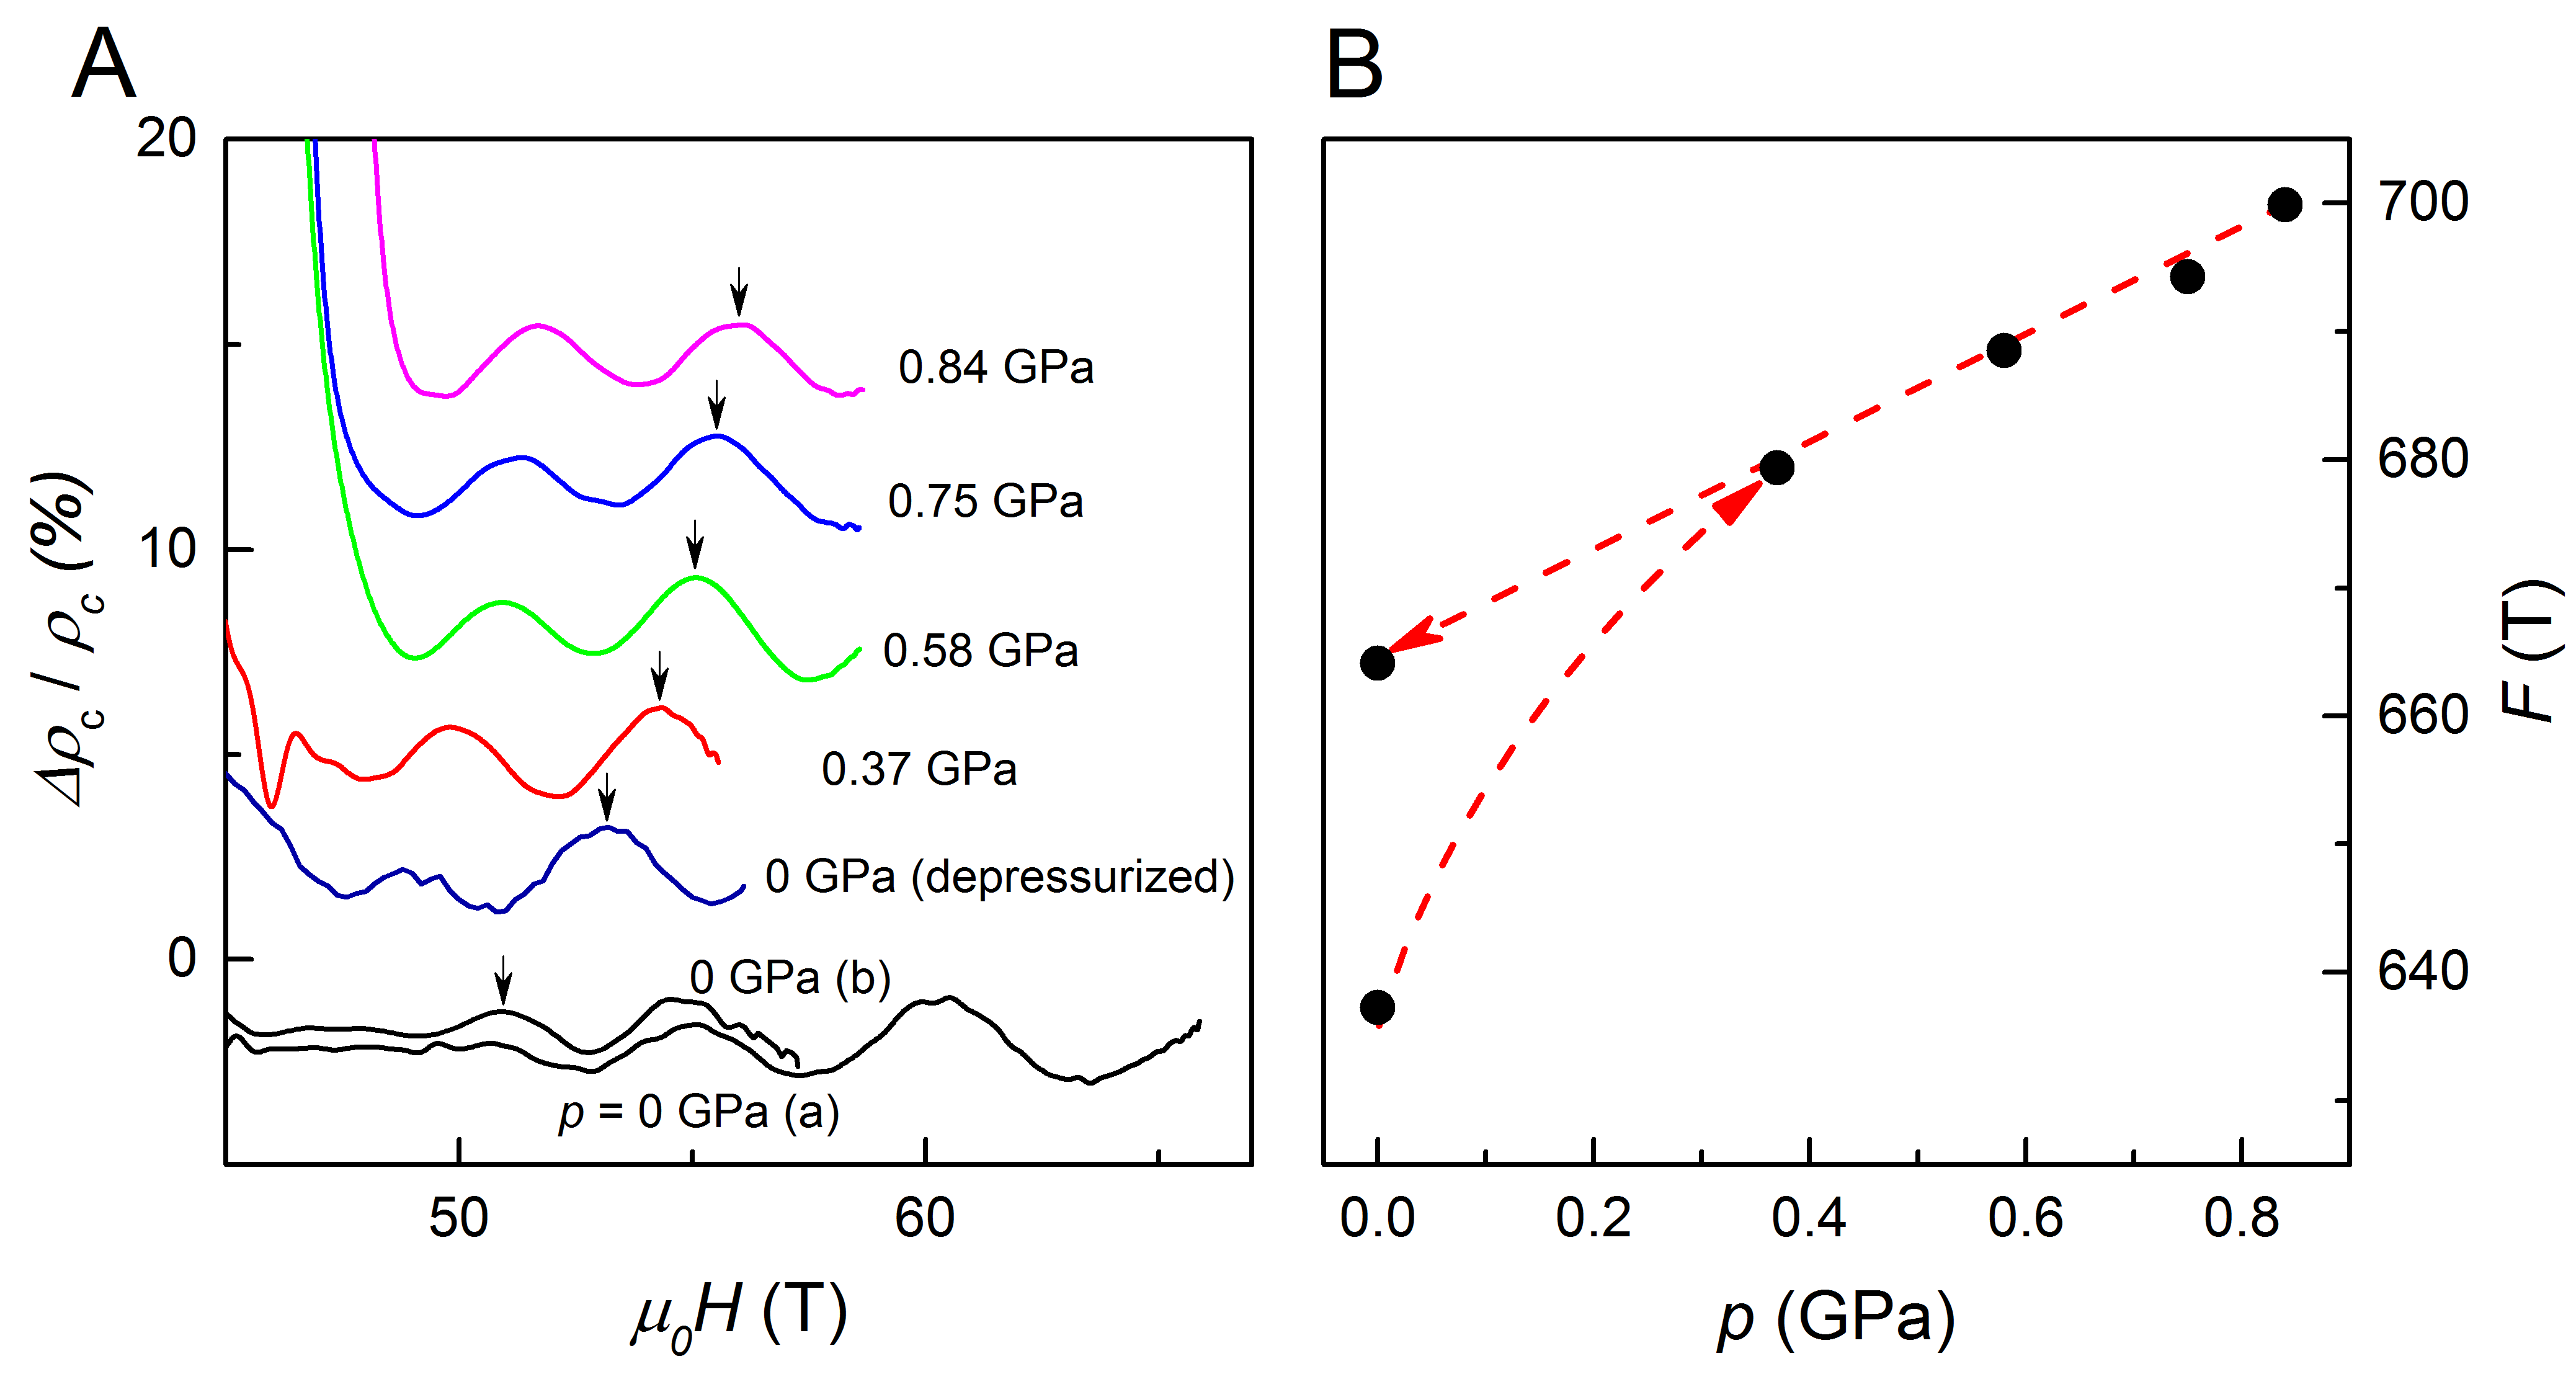
We were able to observe quantum oscillations at all pressures. The oscillatory part of the magnetoresistance at a fixed temperature of 2.5 K is shown in Fig. 3A. The relative oscillation amplitude () increases by around a factor 2 between and 0.37 GPa but then remains approximately constant as pressure is increased further. There is a shift in the phase of the oscillations as a function of which is consistent with a small shift of frequency, equivalent to the Fermi surface area changing by between 0 and 0.84 GPa (Fig. 3B). Again the change is largest between 0 and 0.37 GPa and then varies linearly for further increase in pressure. On depressurization to after the highest pressure, for approximately returns to the values before pressurization (Fig. S3) as does , but the magnetoresistance at low temperature (Fig. 2) remains larger. The phase shift in the depressurized (=0) state follows the linear relation found at higher pressures (Fig. 3B).
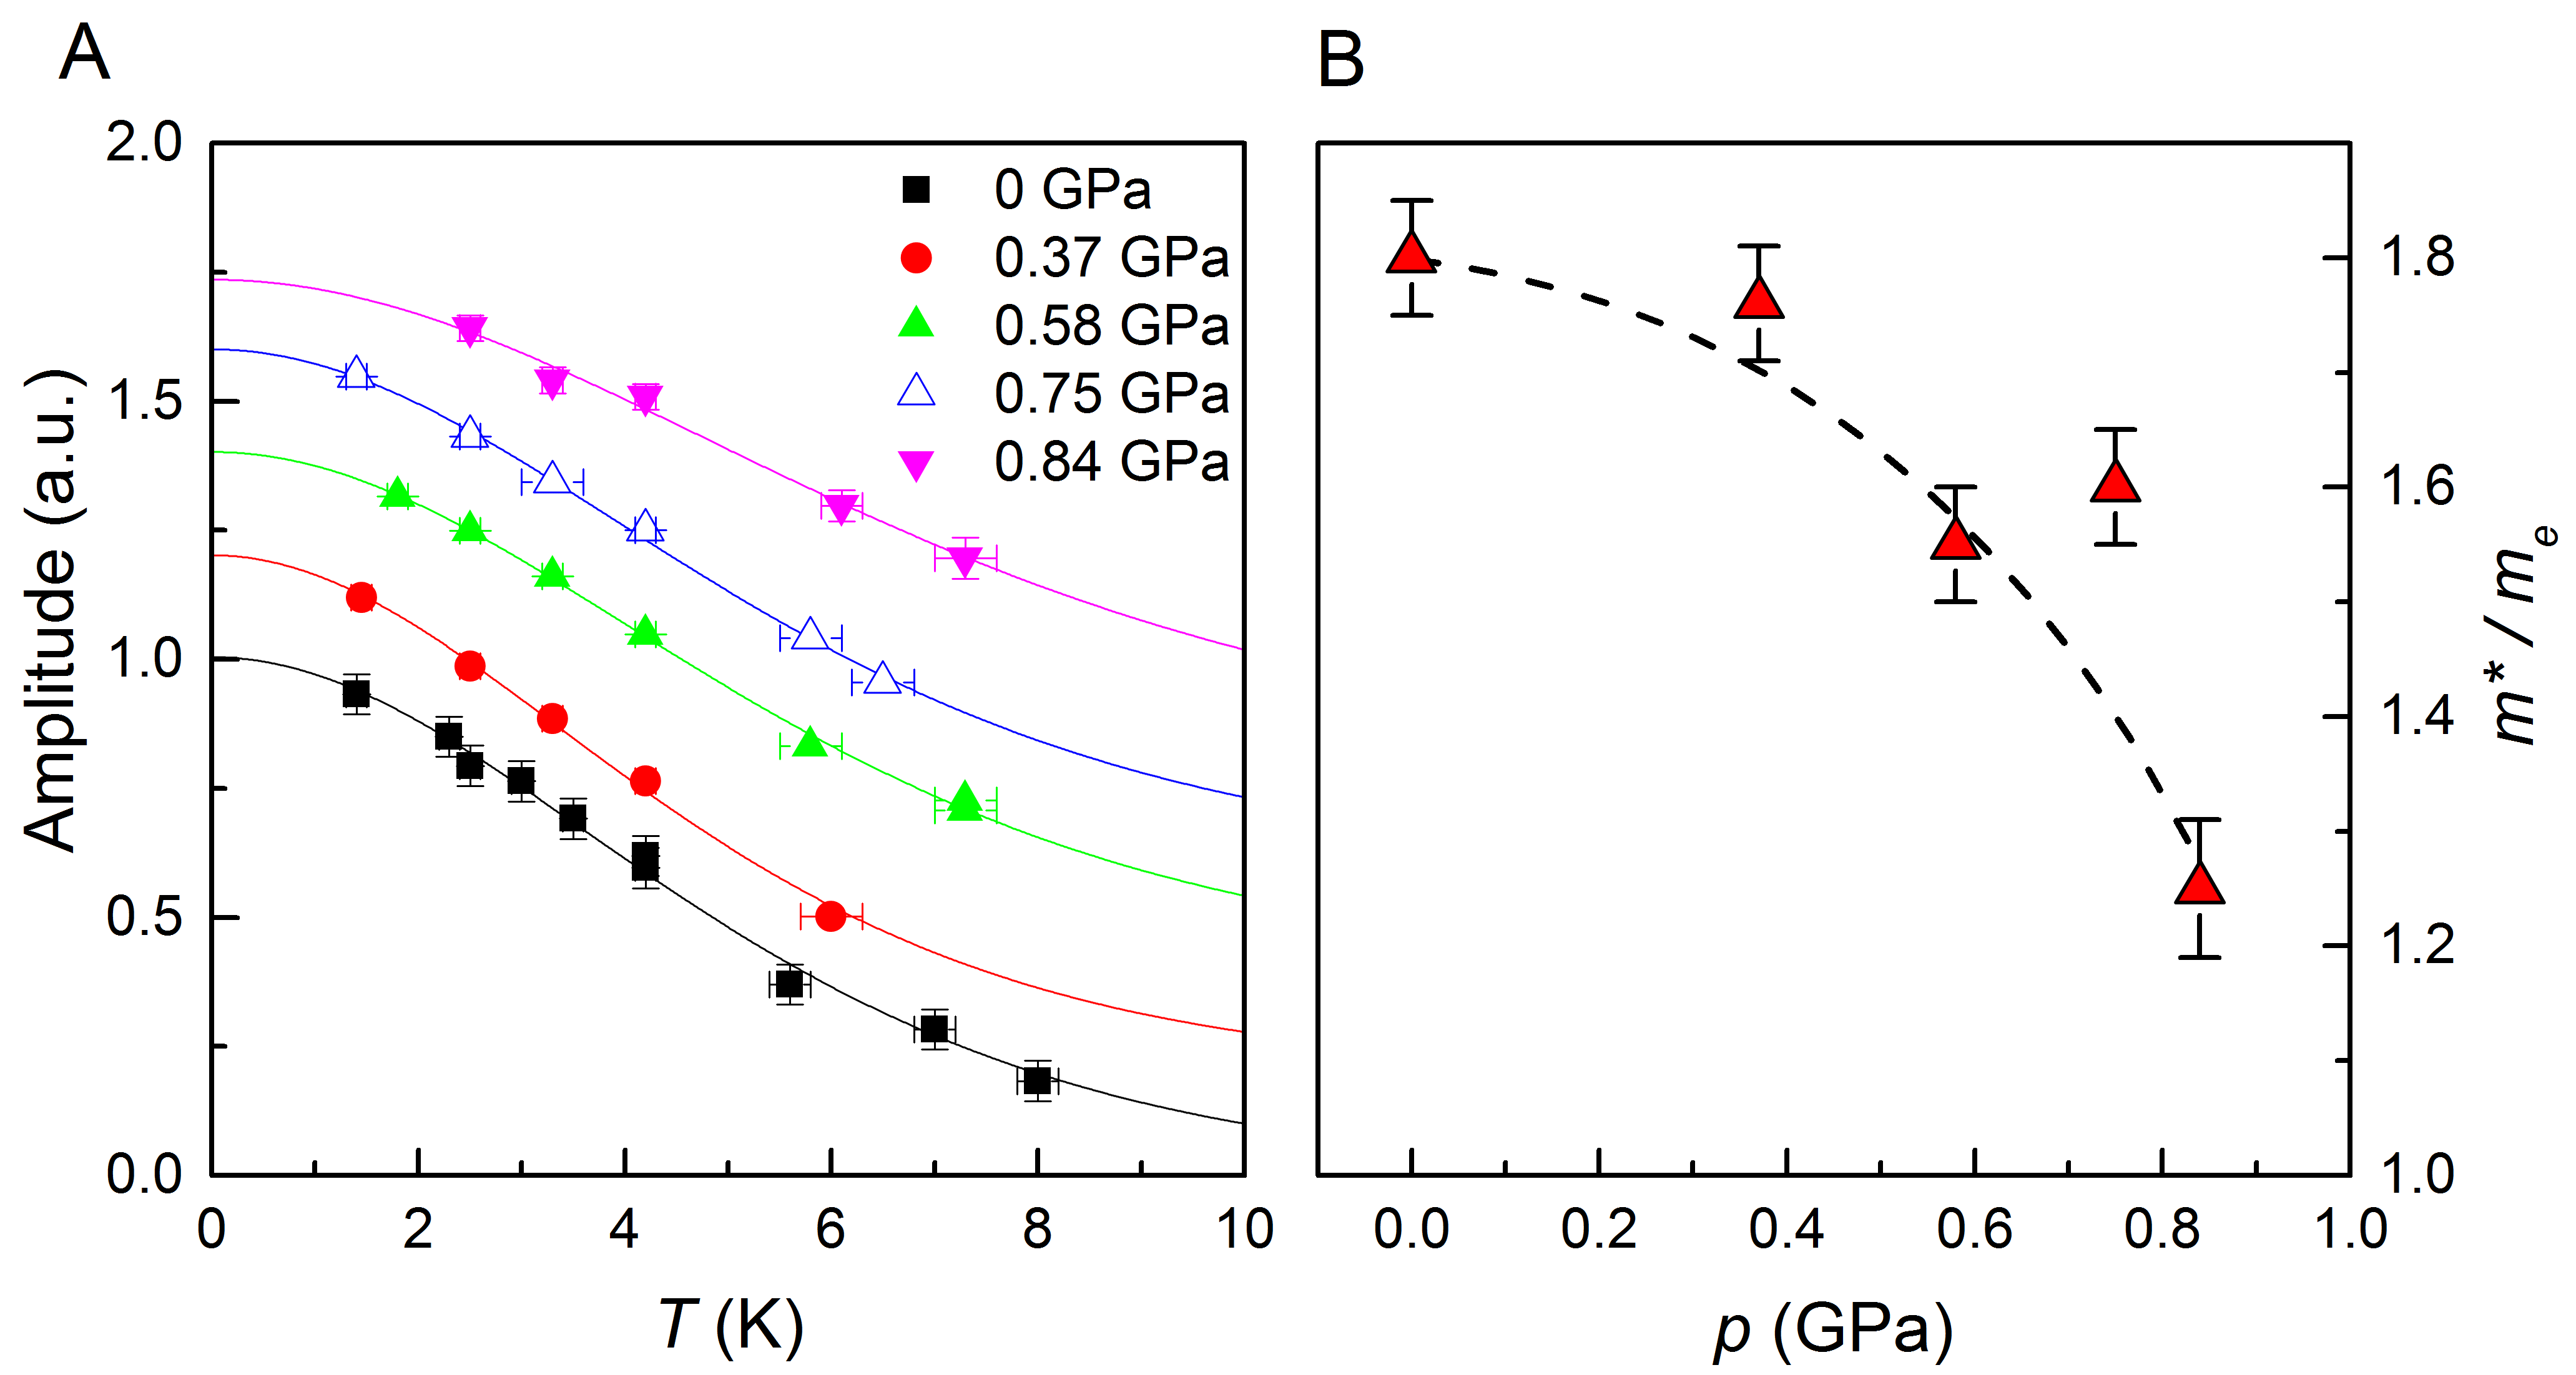
The temperature dependence of the oscillation amplitudes at the different pressures, along with the fits to determine the effective masses are shown in Fig. 4A. The mass found at low pressures measured inside the pressure cell is the same as the value measured outside the cell where the sample is in contact with liquid helium at low temperatures. This shows there are no systematic errors in the mass determination introduced by the pressure cell. Fig. 4B shows a central result of this paper, namely that the effective mass strongly decreases with pressure and hence has an inverse correlation with .
Discussion
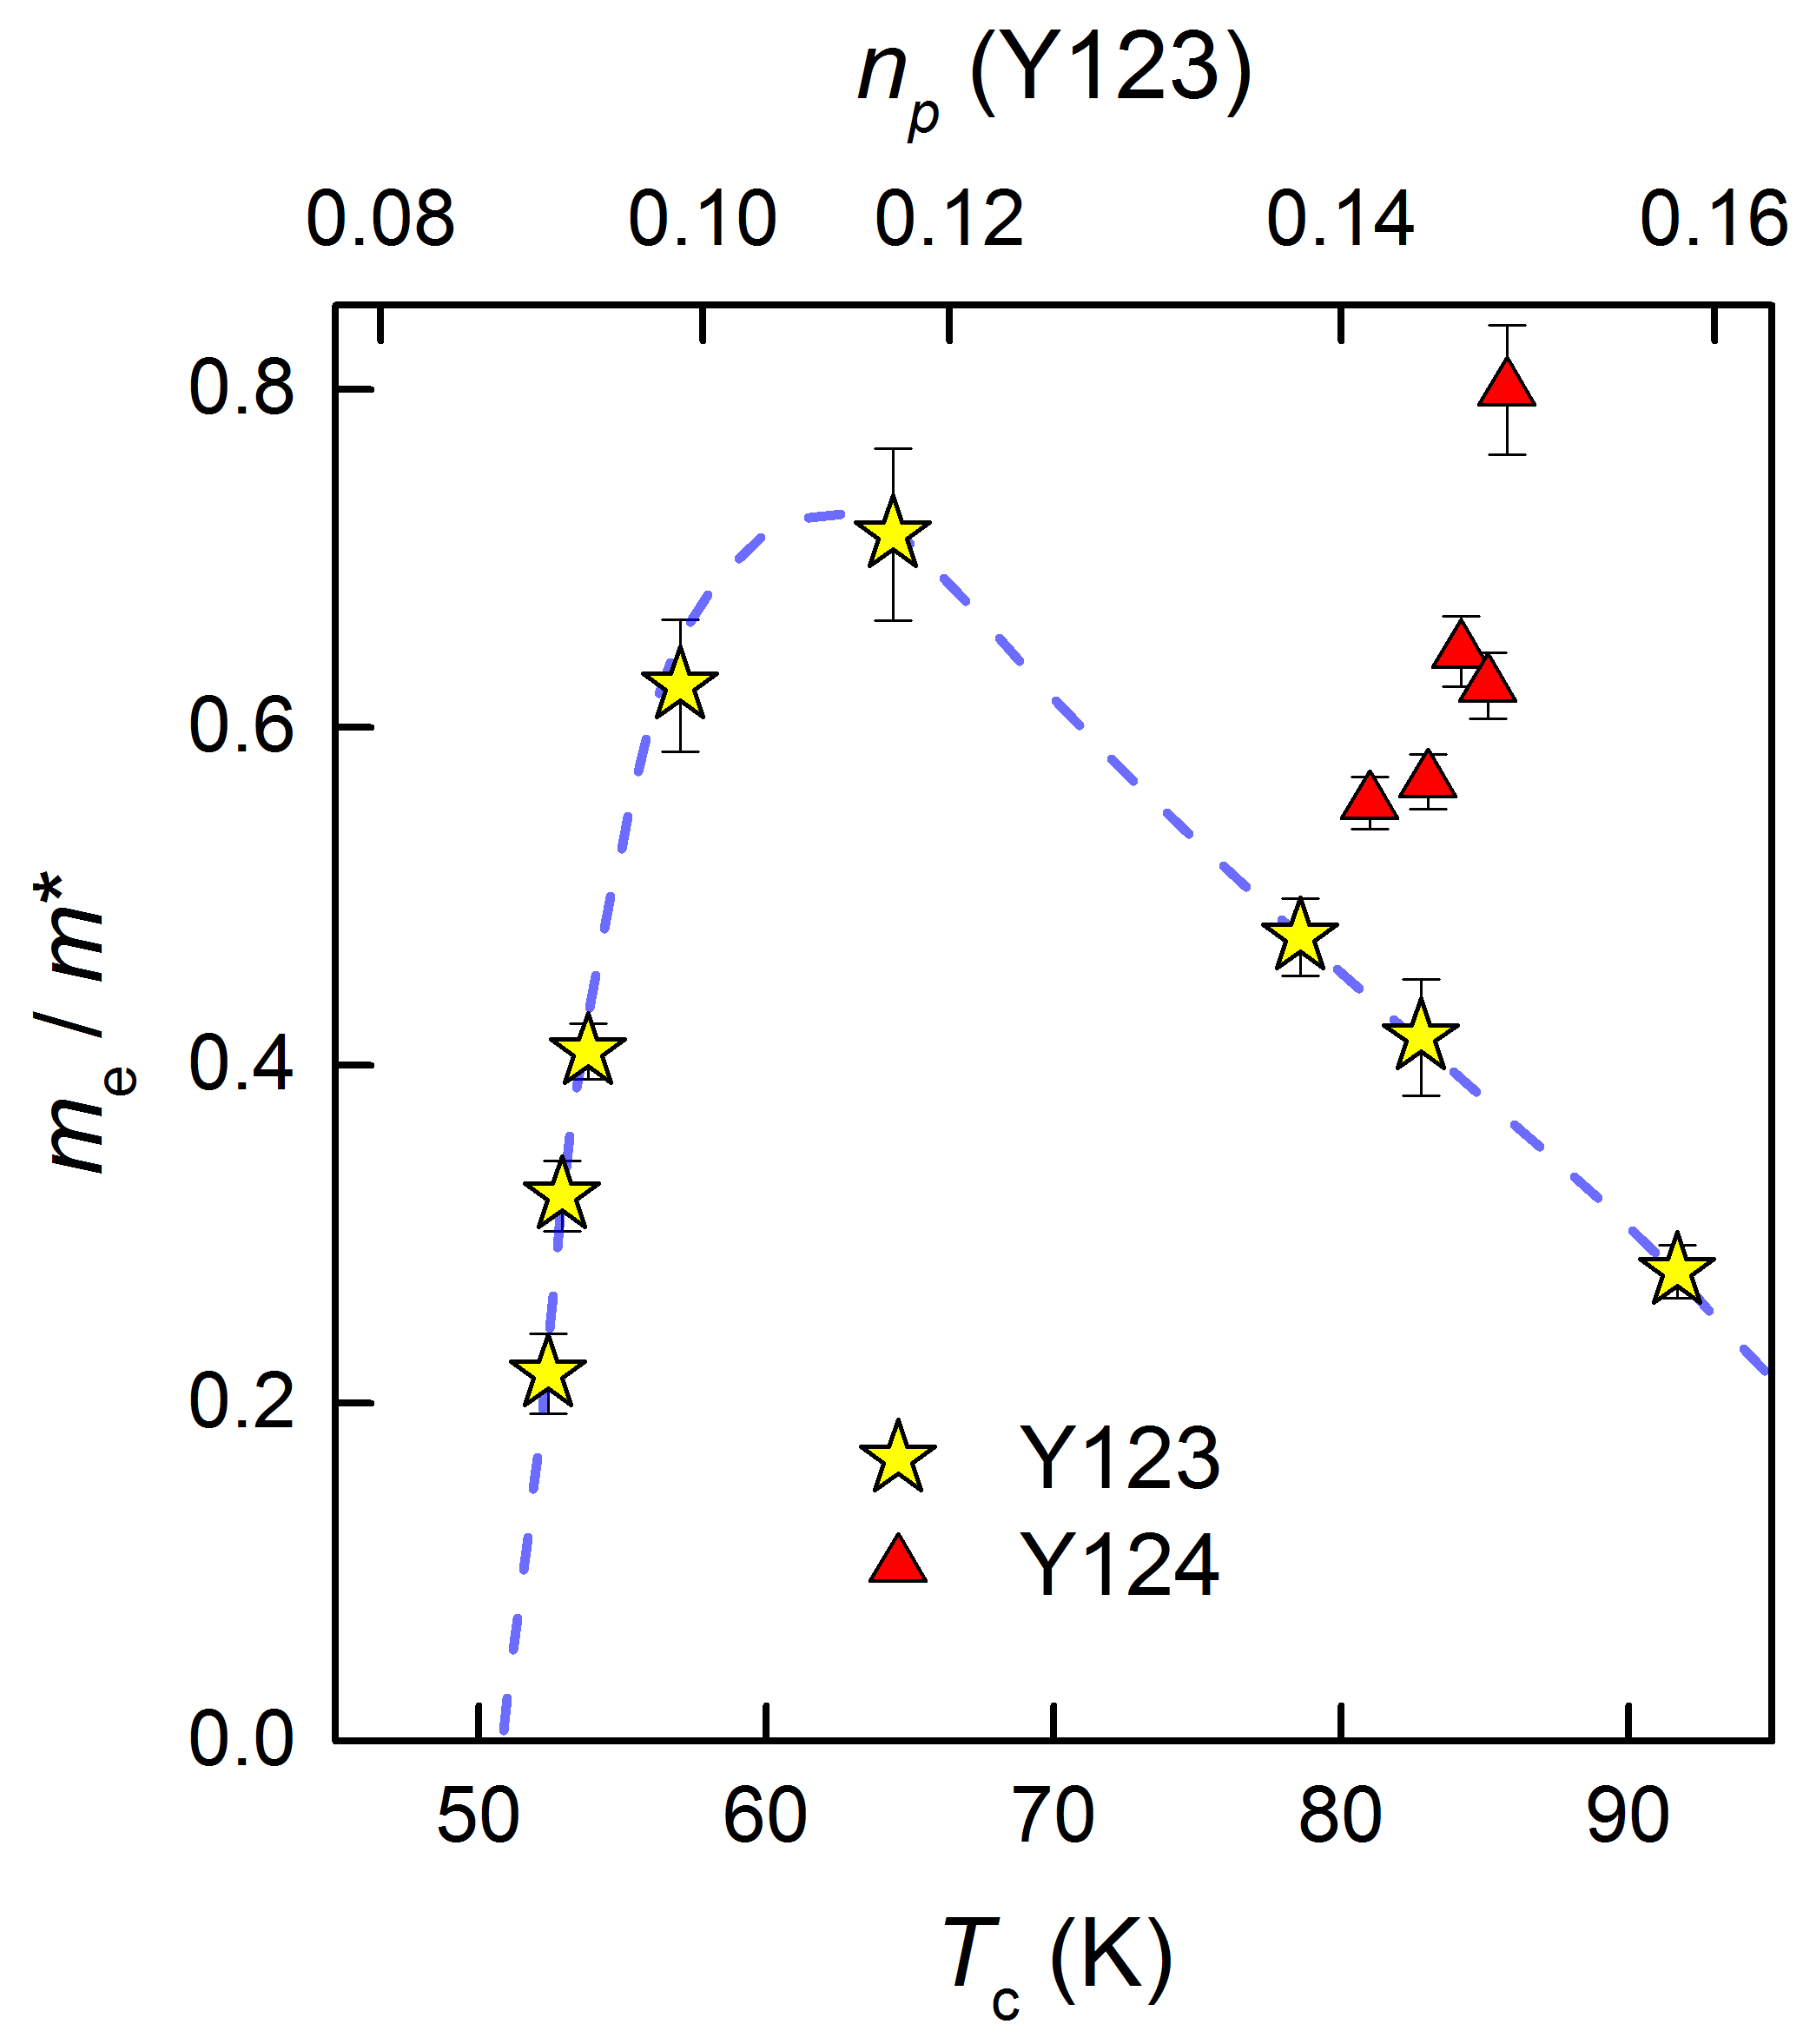
In Fig. 5, we make a comparison between the effective mass and in Y123 where is varied by changing oxygen content and in Y124 where is varied by pressure. The inverse of the mass is plotted to emphasize the almost linear relation between () and found in Y123 close to the two putative quantum critical points (15). It is clear that in Y124 the opposite trend is observed, so that the effective mass decreases as is increased towards the maximum.
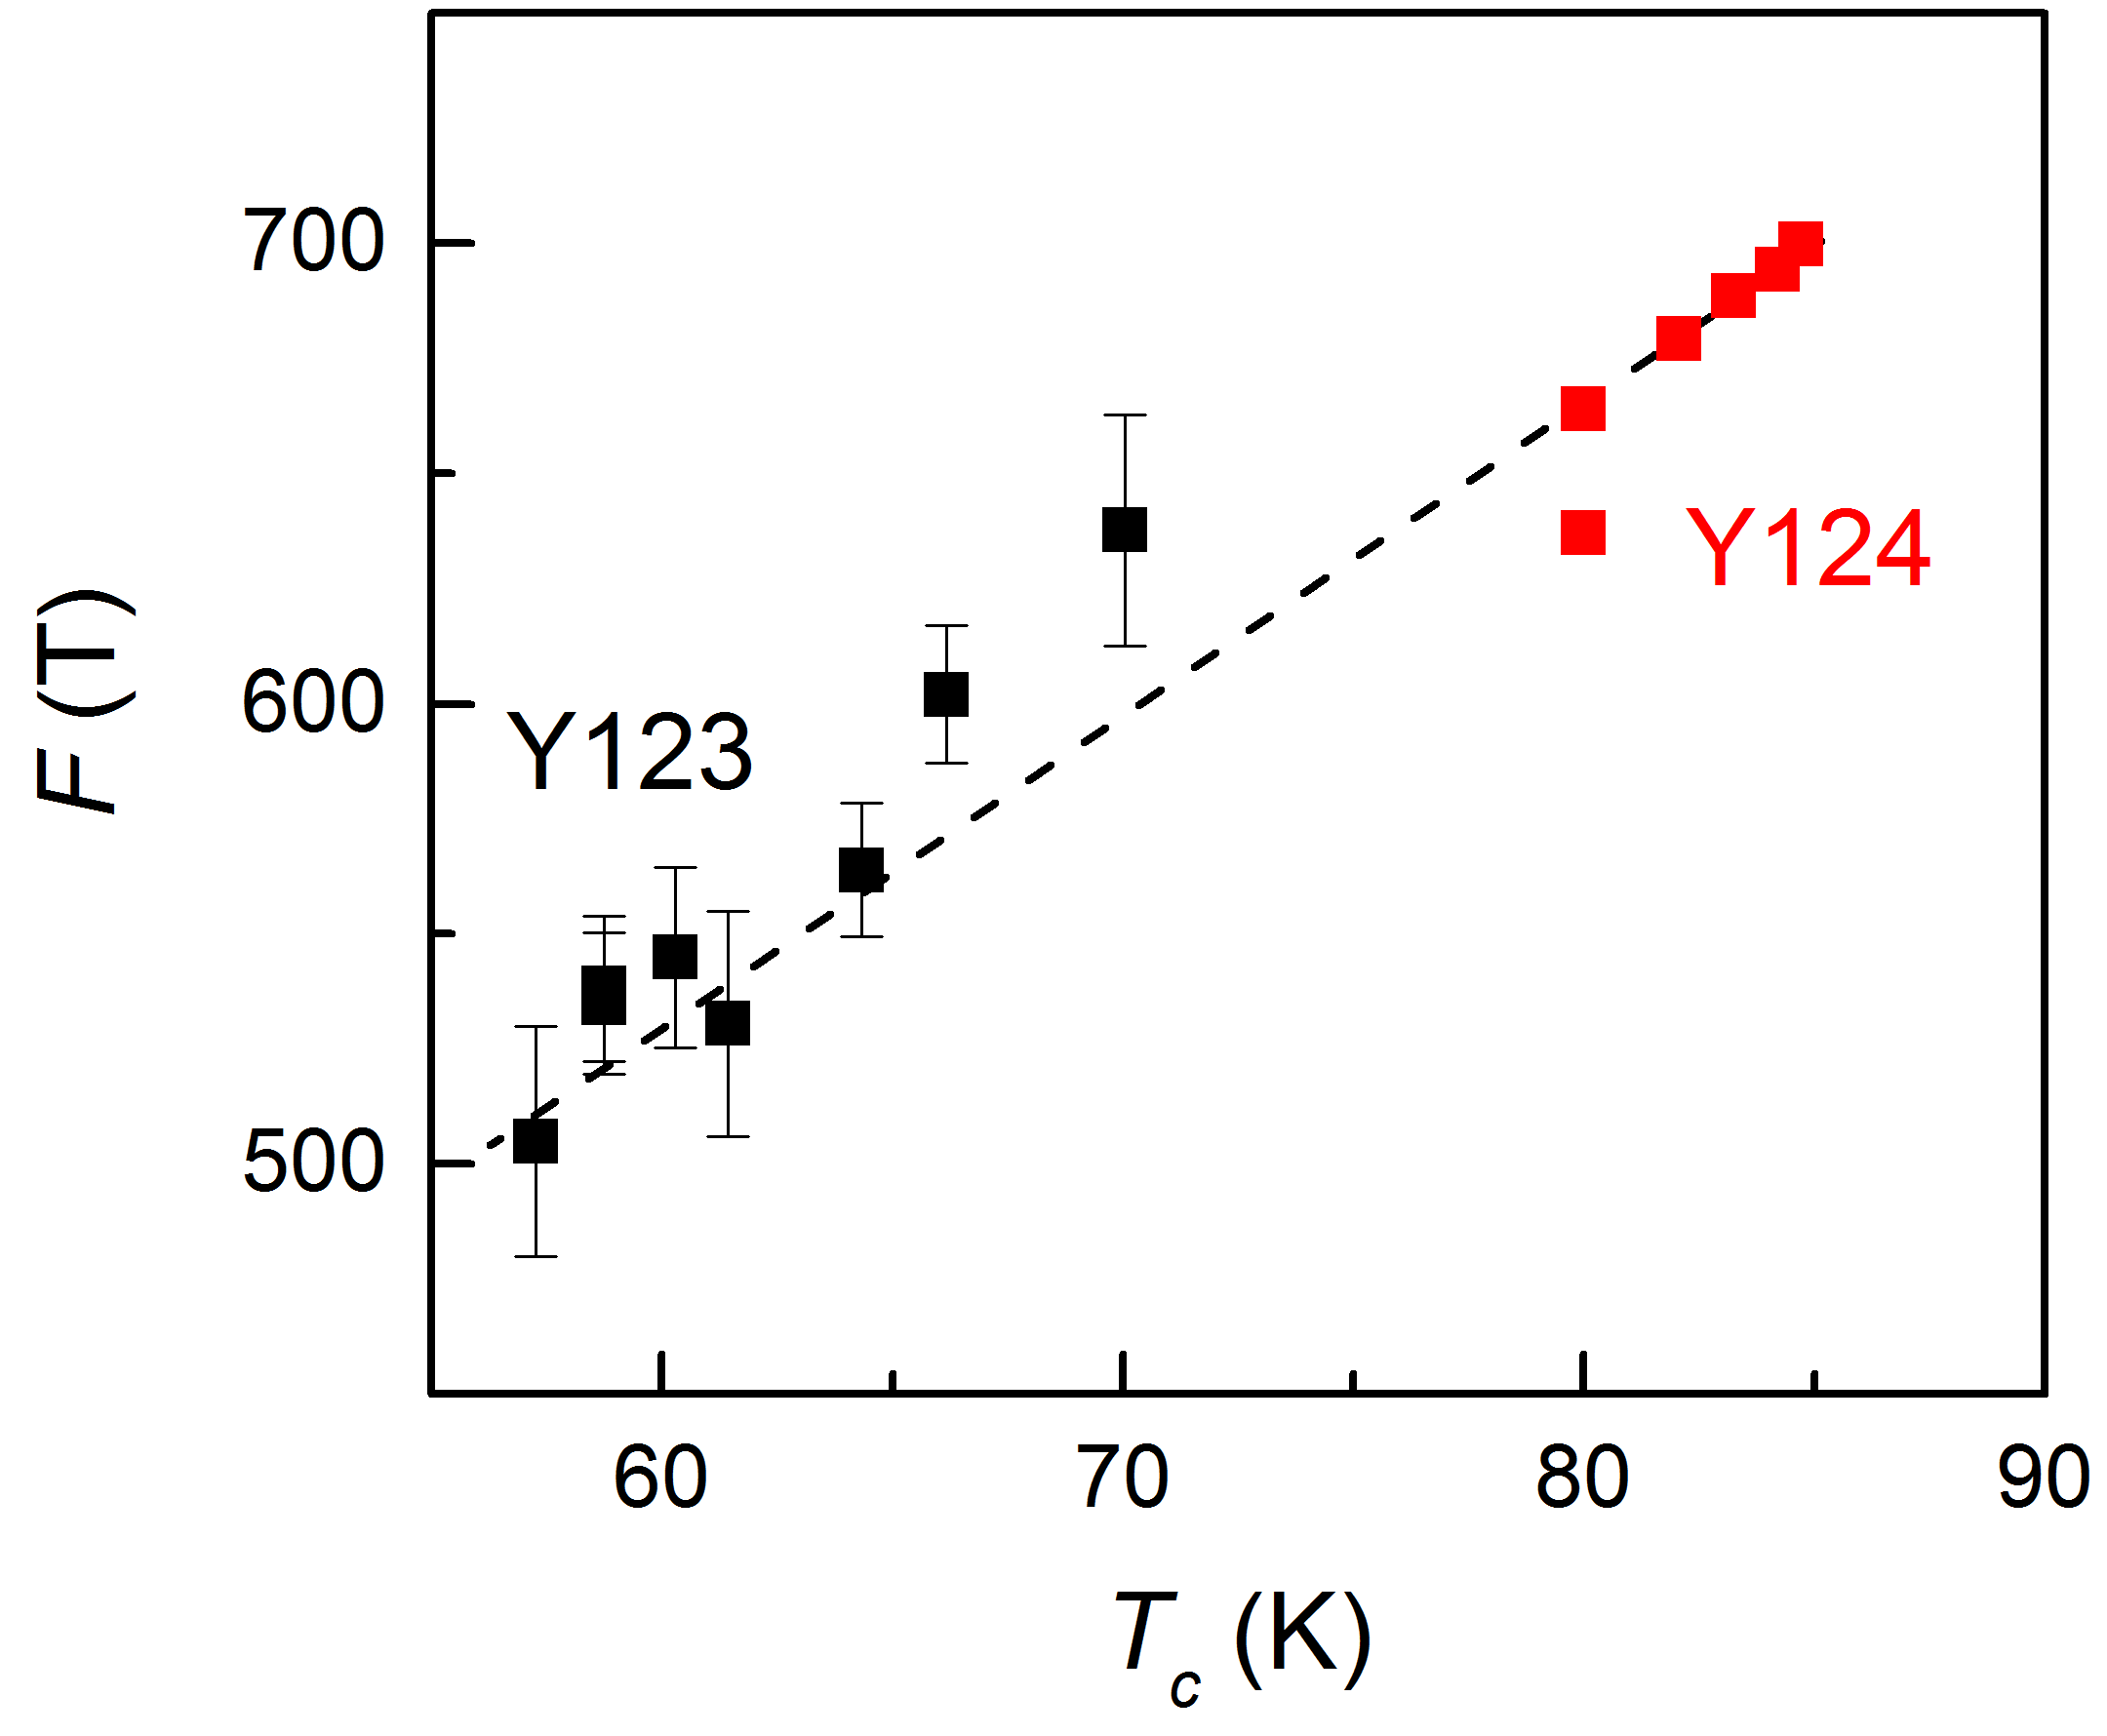
To interpret these results it is necessary to discuss both how the physical properties of Y124 are changed under pressure and also the mechanism of mass enhancement. The main effect of hydrostatic pressure on the structure of Y124 is to decrease all three lattice parameters, but the distance from the CuO2 plane to the apical oxygen reduces twice as rapidly as the -axis parameter itself (30). This distance is correlated with in Y123 (17, 31) and hence suggests that increases with increasing pressure in Y124 (30). This is supported by experiments which show that with increasing pressure the room temperature resistivity and thermoelectric power (32, 33) both decrease as does the pseudogap temperature as measured by NMR Knight shift (34). It is also supported by our observation that the QO frequency in Y124 increases with pressure. In Y123, an approximately linear increase in with increasing (35) has been found and it is interesting to note that when plotted against the data for for Y124 form an almost perfect linear continuation of the increase in with for Y123 (Fig. S4).
Quantitative estimates of (see Methods) and the fact that the maximum in Y124 and Y123 under pressure is K, which is considerably higher than the maximum of K that can be achieved by changing in Y123 alone, suggest that charge transfer is not the only pressure induced effect which increases . It has recently been proposed that an important additional effect could be a weakening of CDW order with pressure (36). As the CDW competes for states with superconductivity, as evidenced by the observed dip in and upper critical field at the value of where the CDW is strongest (37), then if the CDW is weakened, may be enhanced. Although weakening of the CDW order remains a possibility at higher pressures, we find no decrease in the amplitude of the QO with increasing (Fig. 3A). This strongly suggests that there is no significant decoherence of the high field CDW for GPa. In fact, the increase in QO amplitude with increased indicates an increase in the CDW coherence.
As increases linearly with (4 GPa) it is unlikely that the anomalously large effect of the initial pressurization on (Fig. 3B) and the magnitude of the magnetoresistance (Fig. 2) is due mainly to charge transfer. More likely it results from an increase in order of any residual vacancies in the material. This would lead to an increase in the mean-free-path, and in turn, the QO amplitude and the size of the magnetoresistance. When the pressure is removed this increased order may persist giving rise to the observed hysteresis of (Fig. 3B) and the magnetoresistance. We find however, that this increased order does not have any significant effect on (Fig. 4) and so does not affect our central conclusion.
The increase in in Y123 close to optimal doping (15) could be interpreted as resulting from enhanced coupling to fluctuations in either CDW or pseudogap order as these modes would be expected to soften close to their end points. Our key finding is that in Y124 decreases as increases under pressure, which clearly demonstrates that the enhancement found for in Y123 as is reduced, increasing towards optimal, is not universal. Rather it suggests that the approximate coincidence of (the doping where extrapolates to zero in Y123) and the doping where is maximum is accidental, so there is no causal connection between the fluctuations giving rise to the mass enhancement and . The decrease in in Y124 could be interpreted as resulting from a decrease in CDW fluctuations caused by the pressure-induced structural changes. For example, the reduction in -axis length caused by increasing pressure might help stabilize the high field CDW phase where three dimensional coupling is important and hence increase the CDW coherence, thereby reducing the mass enhancing fluctuations. Elucidation of the microscopic changes will require a structural study of the CDW at high pressure. Our results suggest that the proximity of the CDW end point to the maximum in with doping is coincidental and that therefore quantum fluctuations of the CDW order do not boost in the cuprates.
Materials and Methods
Crystals Growth and Characterization. Crystals of Y124 were grown from mixture of Y123 powder and CuO2 in a KOH-flux (38). The obtained crystals had a typical size of 200200100 with the shortest dimension being along the -axis. The composition was checked using x-ray diffraction and lattice parameters were found to be in agreement with previous reports. The samples displayed a sharp superconducting transition with =79 K. For resistance measurements, four contacts were made, two each on the top and bottom faces, using evaporated gold pads which were annealed onto the sample at 500∘C and then contacted with Dupont 4929 silver epoxy. Typical contact resistances were at 4.2 K. In zero field, resistance was measured using a standard low frequency lock-in-amplifier method, and in pulsed field using a numerical lock-in digitization technique operating at typically 54 kHz. Resistance versus temperature curves are shown in Fig. S3B. shows metallic behavior at low temperature and is similar to the results reported in Ref. (39).
Pressure cell. A non-magnetic pressure cell was used in the pulsed magnetic field system (29). Because of the limitation of space inside this cell, pressure was determined using the samples themselves as a manometer. Changes in of the Y124 samples were measured in the non-metallic cell at room temperature and these results were compared to measurements done in a different larger cell where the pressure was measured at low temperature using a Pb manometer and at room temperature using the resistance of a manganin wire (40). In this second cell it was verified, by -axis resistivity measurements, that d was 5.5(5) K/GPa in agreement with previous measurements (20).
Effective mass determination: Quantum oscillation data was analyzed by fitting the following function to the data
where . The first part of the function represents the field dependent part of the Lifshitz-Kosevitch formula (41) for the quantum oscillation amplitude in a three dimensional metal at . We fit this to a short section of data (field ranges for each pressure are given in Table S1) at the lowest temperature (typically K) and determine , and . These parameters are then left fixed and the oscillation amplitude was then determined as a function of temperature. The fourth order polynomial was used to subtract the non-oscillatory background resistance. The temperature dependence of was then fitted to the thermal damping factor , to extract the effective mass . In this formula is set to the average inverse field in the field range fitted.
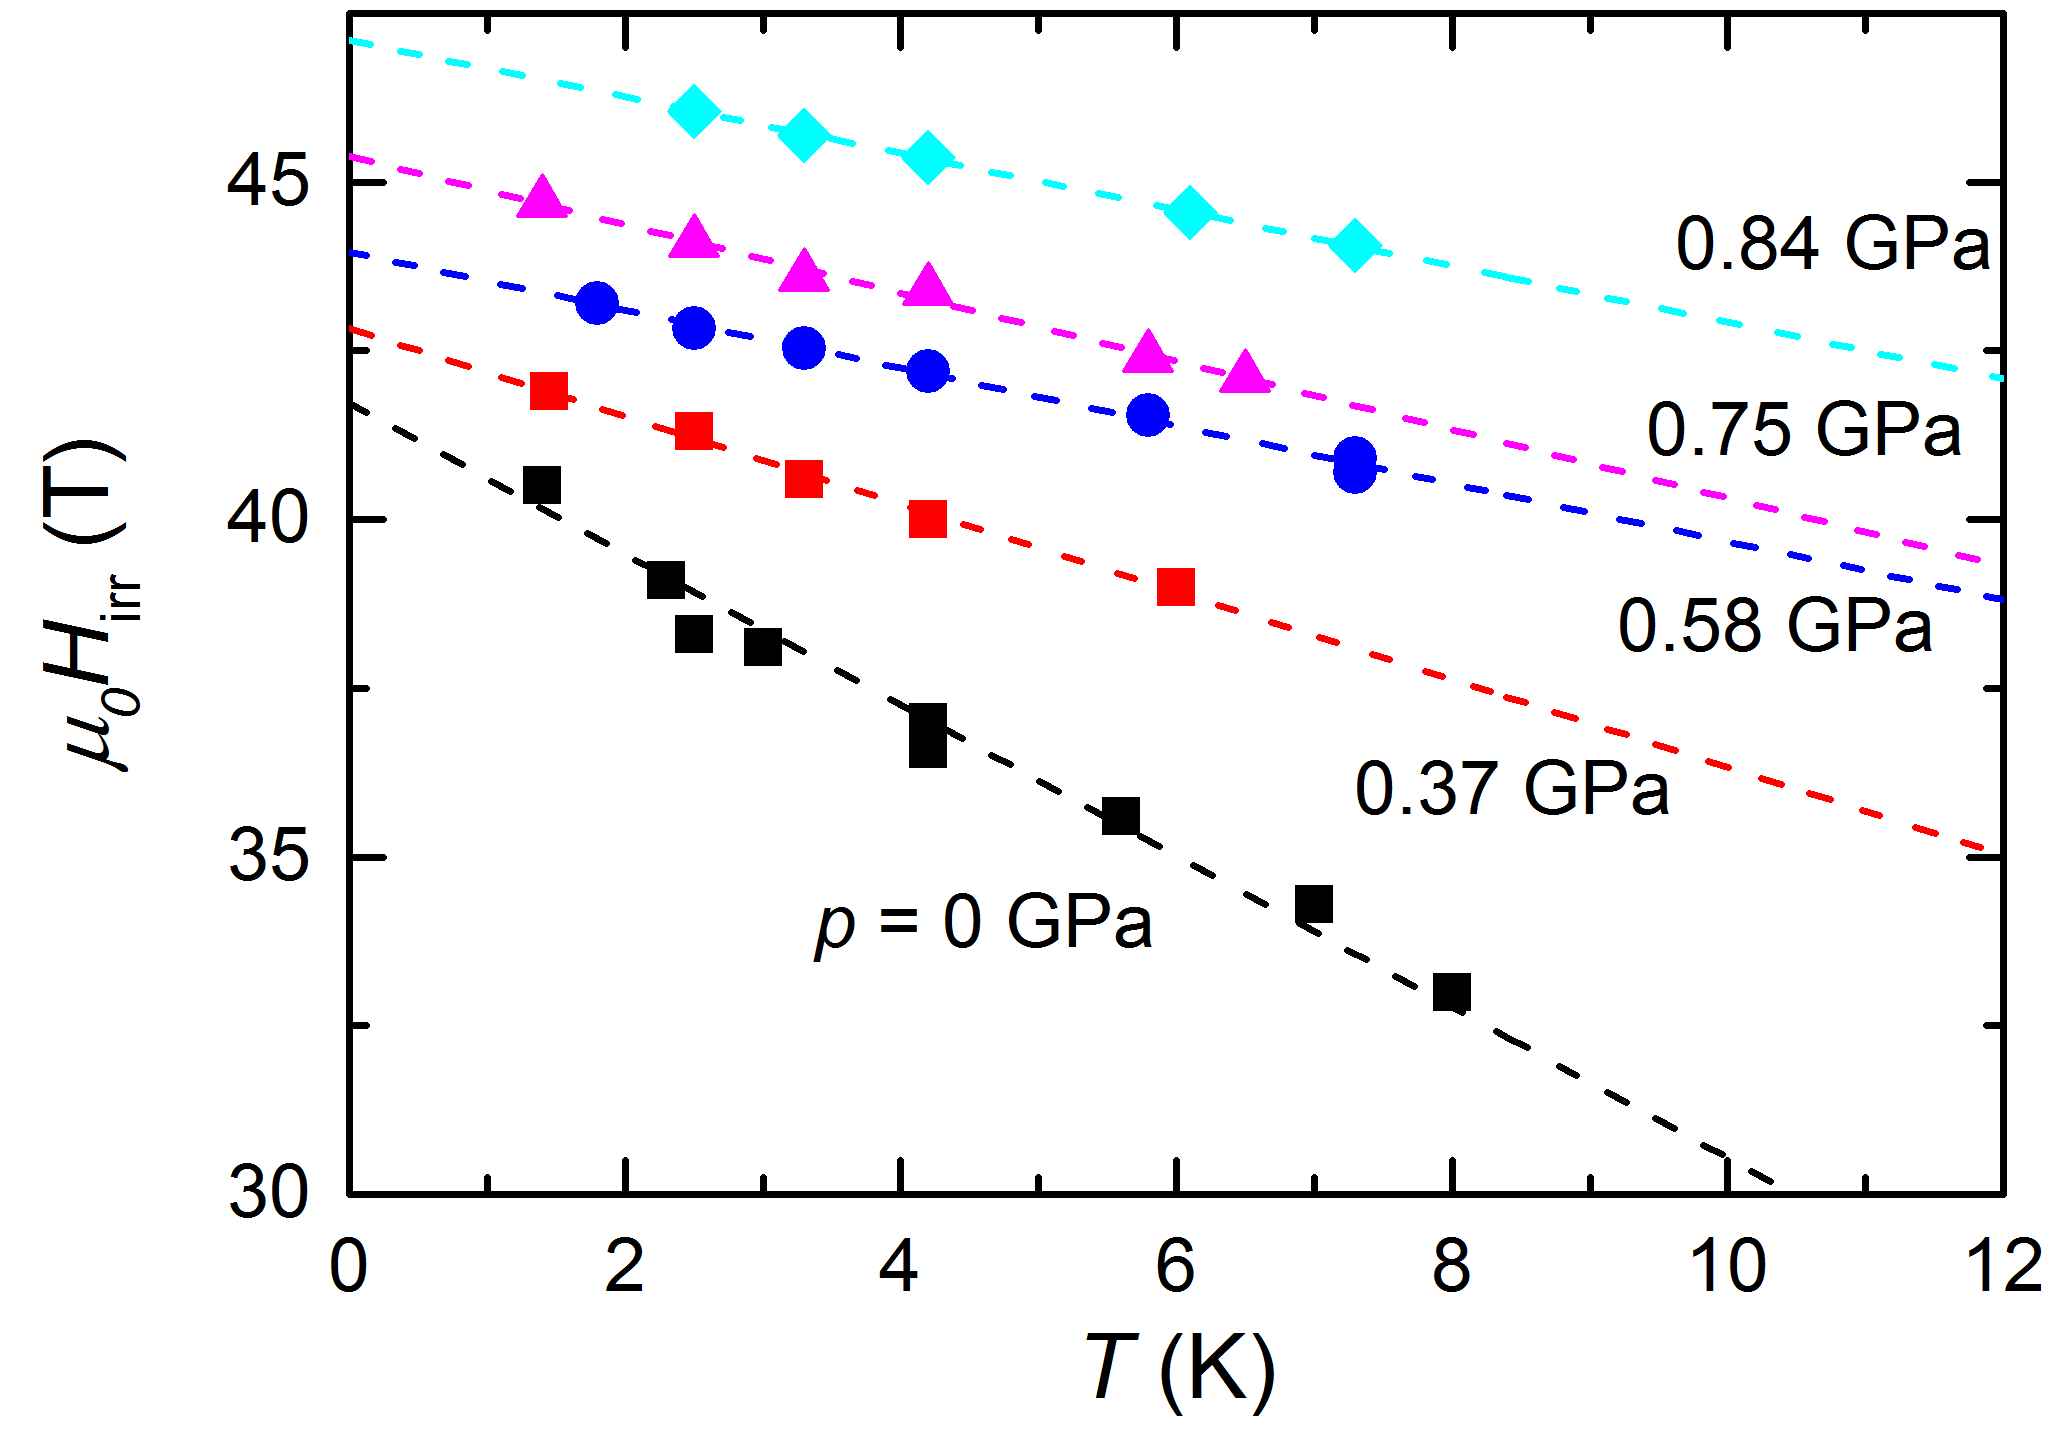
Thermometry in pulsed magnetic field: In order to accurately determine the mass it is important to be able to accurately measure the sample temperature. This is not trivial in a pulsed field system because the relatively high sample currents needed to get sufficient signal to noise ratio produce heating at the sample contacts. These effects were minimized in our measurements by obtaining very low contact resistances (around ) and having the sample in direct contact with liquid helium (for K) for the measurements outside of the pressure cell. For measurement inside the pressure cell the thermometer was mounted directly outside the cell. Tests using a miniature GeAu thermometer mounted inside the cell, attached to the sample showed that the two thermometers were in thermal equilibrium provided that the resistive heating at the sample contacts was sufficiently low. The maximum current used for the resistivity measurements was selected so that this was always the case. The strong increase in of the superconducting-normal transition with temperature was used as a second check of the temperature. The irreversibility field, , defined as the field where the resistance first increases above the noise, varies linearly with (Fig. S5). The continuity of this linear behavior when the sample is inside the cell provides an important check that the sample temperature has been correctly determined.
Estimates of change of doping with pressure: A quantitative estimate of the change in with can be made using the magnitude of the room temperature -axis thermoelectric power (). Using the data for Y124 in Ref. (32) along with the universal relation between and (33, 42) we obtain holes/GPa. A second estimate can be made using the pressure dependent NMR Knight shift 17O data for Y124 from Ref. (34). Following Ref. (43) we scale the temperature axis by the pseudogap energy so that the data for different pressures collapses onto a single curve and 17O() is approximately constant for . For =0 we estimate K which is consistent with the -axis resistivity data (39). From this we obtain holes/GPa, for GPa which is in reasonable agreement with the above estimate from . Taking an average of these two values and combining them with an estimate of d taken from Y123 at (17), would predict that for Y124 d=2.7(5) K/GPa, i.e. around 2 times smaller than the measured d=5.5(1) K/GPa (23).
Although the quantitative precision of this estimate should be viewed with caution because the universal relations between and (33, 42) and and (43) may not hold under finite pressure it is likely there are other effects which increase in addition to charge transfer.
In simple systems, the QO frequency , which is proportional to the Fermi surface extremal cross-section, can often be used to precisely determine the doping level. In cuprates however, this has so far only been successfully demonstrated in the overdoped cuprate Tl2Ba2CuO6+δ (44-46). For the underdoped materials the reconstruction of the Fermi surface complicates the analysis as the area of the reconstructed pocket will depend on the unknown details of the reconstructing potential as well as . In Y123, an approximately linear increase in with increasing (35) has been found. If we assume that in Y124 is the same as in Y123 for then the slope from the linear part of Fig. 3B would give holes/GPa which is around 3 times larger than the estimate from . However, as it is not known how universal is in the cuprates this estimate is probably the most uncertain.
Acknowledgments
We thank John Cooper, Sven Friedemann, Jeff Tallon, and Louis Taillefer for useful discussions. This work was supported by the Engineering and Physical Sciences Research Council (Grant No. EP/K016709/1). A portion of this work was performed at the LNCMI, which is supported by the French ANR SUPERFIELD, the EMFL, and the LABEX NEXT. We also acknowledge the support of the HFML-RU/FOM.
Data availability
Raw resistance versus field or resistance versus temperature data for all figures can be found at DOI:10.5523/bris.p6wv6g0eoh3t1fd2d4fjujuno.
References
- [1] S. Sachdev, B. Keimer, Quantum criticality. Physics Today 64, 29-35, (2011).
- [2] L. Taillefer, Scattering and pairing in cuprate superconductors. Annual Review of Condensed Matter Physics 1, 51-70, (2010).
- [3] T. Shibauchi, A. Carrington, Y. Matsuda, A quantum critical point lying beneath the superconducting dome in iron pnictides. Annual Review of Condensed Matter Physics 5, 113-135, (2014).
- [4] D. M. Broun, What lies beneath the dome ? Nature Physics 4, 170-172, (2008).
- [5] M. H cker, N. B. Christensen, A. T. Holmes, E. Blackburn, E. M. Forgan, R. Liang, D. A. Bonn, W. N. Hardy, O. Gutowski, M. v. Zimmermann, S. M. Hayden, J. Chang, Competing charge, spin, and superconducting orders in underdoped YBa2Cu3Oy. Physical Review B 90, 054514, (2014).
- [6] S. Blanco-Canosa, A. Frano, E. Schierle, J. Porras, T. Loew, M. Minola, M. Bluschke, E. Weschke, B. Keimer, M. Le Tacon, Resonant x-ray scattering study of charge-density wave correlations in YBa2Cu3O6+x. Physical Review B 90, 054513, (2014).
- [7] J. L. Tallon, J. W. Loram, The doping dependence of - what is the real high- phase diagram? Physica C 349, 53-68, (2001).
- [8] A. Damascelli, Z. Hussain, Z. X. Shen, Angle-resolved photoemission studies of the cuprate superconductors. Reviews of Modern Physics 75, 473-541, (2003).
- [9] T. Wu, H. Mayaffre, S. Kramer, M. Horvatic, C. Berthier, W. N. Hardy, R. X. Liang, D. A. Bonn, M. H. Julien, Magnetic-field-induced charge-stripe order in the high-temperature superconductor YBa2Cu3Oy. Nature 477, 191-194, (2011).
- [10] G. Ghiringhelli, M. Le Tacon, M. Minola, S. Blanco-Canosa, C. Mazzoli, N. B. Brookes, G. M. De Luca, A. Frano, D. G. Hawthorn, F. He, T. Loew, M. M. Sala, D. C. Peets, M. Salluzzo, E. Schierle, R. Sutarto, G. A. Sawatzky, E. Weschke, B. Keimer, L. Braicovich, Long-range incommensurate charge fluctuations in (Y,Nd)Ba2CuO6+x. Science 337, 821-825, (2012).
- [11] J. Chang, E. Blackburn, A. T. Holmes, N. B. Christensen, J. Larsen, J. Mesot, R. X. Liang, D. A. Bonn, W. N. Hardy, A. Watenphul, M. von Zimmermann, E. M. Forgan, S. M. Hayden, Direct observation of competition between superconductivity and charge density wave order in YBa2Cu3O6.67. Nature Physics 8, 871-876, (2012).
- [12] T. Wu, H. Mayaffre, S. Kramer, M. Horvatic, C. Berthier, W. N. Hardy, R. X. Liang, D. A. Bonn, M. H. Julien, Incipient charge order observed by NMR in the normal state of YBa2Cu3Oy. Nature Communications 6, 9, 6438, (2015).
- [13] S. Gerber, H. Jang, H. Nojiri, S. Matsuzawa, H. Yasumura, D. A. Bonn, R. Liang, W. N. Hardy, Z. Islam, A. Mehta, S. Song, M. Sikorski, D. Stefanescu, Y. Feng, S. A. Kivelson, T. P. Devereaux, Z. X. Shen, C. C. Kao, W. S. Lee, D. Zhu, J. S. Lee, Three-dimensional charge density wave order in YBa2Cu3O6.67 at high magnetic fields. Science 350, 949-952, (2015).
- [14] N. Doiron-Leyraud, C. Proust, D. LeBoeuf, J. Levallois, J.-B. Bonnemaison, R. Liang, D. A. Bonn, W. N. Hardy, L. Taillefer, Quantum oscillations and the Fermi surface in an underdoped high- superconductor. Nature 447, 565-568, (2007).
- [15] B. J. Ramshaw, S. E. Sebastian, R. D. McDonald, J. Day, B. S. Tan, Z. Zhu, J. B. Betts, R. X. Liang, D. A. Bonn, W. N. Hardy, N. Harrison, Quasiparticle mass enhancement approaching optimal doping in a high- superconductor. Science 348, 317-320, (2015).
- [16] S. E. Sebastian, N. Harrison, G. G. Lonzarich, Towards resolution of the Fermi surface in underdoped high-Tc superconductors. Reports on Progress in Physics 75, 102501, (2012).
- [17] R. X. Liang, D. A. Bonn, W. N. Hardy, Evaluation of CuO2 plane hole doping in YBa2Cu3O6+x single crystals. Physical Review B 73, 180505, (2006).
- [18] C. Castellani, C. DiCastro, M. Grilli, Non-Fermi-liquid behavior and d-wave superconductivity near the charge-density-wave quantum critical point. Zeitschrift Fur Physik B-Condensed Matter 103, 137-144, (1997).
- [19] L. Gao, Y. Y. Xue, F. Chen, Q. Xiong, R. L. Meng, D. Ramirez, C. W. Chu, J. H. Eggert, H. K. Mao, Superconductivity up to 164-K in HgBa2Cam-1CumO2m+2+δ (m=1,2, and 3) under quasi-hydrostatic pressures. Physical Review B 50, 4260-4263, (1994).
- [20] B. Bucher, J. Karpinski, E. Kaldis, P. Wachter, Strong pressure-dependence of of the new 80-K phase YBa2Cu4O8+x. Physica C 157, 478-482, (1989).
- [21] E. A. Yelland, J. Singleton, C. H. Mielke, N. Harrison, F. F. Balakirev, B. Dabrowski, J. R. Cooper, Quantum oscillations in the underdoped cuprate YBa2Cu4O8. Physical Review Letters 100, 047003, (2008).
- [22] E. N. Vaneenige, R. Griessen, R. J. Wijngaarden, J. Karpinski, E. Kaldis, S. Rusiecki, E. Jilek, Superconductivity at 108K in YBa2Cu4O8 at pressures up to 12 GPa. Physica C 168, 482-488, (1990).
- [23] J. J. Scholtz, E. N. Vaneenige, R. J. Wijngaarden, R. Griessen, Pressure-dependence of and of YBa2Cu4O8. Physical Review B 45, 3077-3092, (1992).
- [24] A. Nakayama, Y. Onda, S. Yamada, H. Fujihisa, M. Sakata, Y. Nakamoto, K. Shimizu, S. Nakano, A. Ohmura, F. Ishikawa, Y. Yamada, Collapse of CuO double chains and suppression of superconductivity in high-pressure phase of YBa2Cu4O8. Journal of the Physical Society of Japan 83, 093601, (2014).
- [25] M. Mito, T. Imakyurei, H. Deguchi, K. Matsumoto, H. Hara, T. Ozaki, H. Takeya, Y. Takano, Effective Disappearance of the Meissner Signal in the Cuprate Superconductor YBa2Cu4O8 under Uniaxial Strain. Journal of the Physical Society of Japan 83, 023705, (2014).
- [26] D. LeBoeuf, N. Doiron-Leyraud, J. Levallois, R. Daou, J. B. Bonnemaison, N. E. Hussey, L. Balicas, B. J. Ramshaw, R. Liang, D. A. Bonn, W. N. Hardy, S. Adachi, C. Proust, L. Taillefer, Electron pockets in the Fermi surface of hole-doped high- superconductors. Nature 450, 533-536, (2007).
- [27] A. F. Bangura, J. D. Fletcher, A. Carrington, J. Levallois, M. Nardone, B. Vignolle, P. J. Heard, N. Doiron-Leyraud, D. LeBoeuf, L. Taillefer, S. Adachi, C. Proust, N. E. Hussey, Small Fermi surface pockets in underdoped high temperature superconductors: Observation of Shubnikov-de Haas oscillations in YBa2Cu4O8. Physical Review Letters 100, 047004, (2008).
- [28] B. S. Tan, N. Harrison, Z. Zhu, F. Balakirev, B. J. Ramshaw, A. Srivastava, S. A. Sabok-Sayr, B. Dabrowski, G. G. Lonzarich, S. E. Sebastian, Fragile charge order in the nonsuperconducting ground state of the underdoped high-temperature superconductors. Proceedings of the National Academy of Sciences 112, 9568-9572, (2015).
- [29] M. Nardone, A. Audouard, D. Vignolles, L. Brossard, Hydrostatic pressure anvil cell for electron transport measurements up to 1 GPa under high pulsed magnetic field at liquid helium temperatures. Cryogenics 41, 175-178, (2001).
- [30] Y. Yamada, J. D. Jorgensen, S. Pei, P. Lightfoot, Y. Kodama, T. Matsumoto, F. Izumi, Structural-changes of superconducting YBa2Cu4O8 under high-pressure. Physica C 173, 185-194, (1991).
- [31] J. D. Jorgensen, B. W. Veal, A. P. Paulikas, L. J. Nowicki, G. W. Crabtree, H. Claus, W. K. Kwok, Structural properties of oxygen-deficient YBa2Cu3O7-δ. Physical Review B 41, 1863-1877, (1990).
- [32] J. S. Zhou, J. B. Goodenough, B. Dabrowski, K. Rogacki, Transport properties of a YBa2Cu4O8 crystal under high pressure. Physical Review Letters 77, 4253-4256, (1996).
- [33] S. D. Obertelli, J. R. Cooper, J. L. Tallon, Systematics in the thermoelectric-power of high- oxides. Physical Review B 46, 14928-14931, (1992).
- [34] T. Meissner, S. K. Goh, J. Haase, G. V. M. Williams, P. B. Littlewood, High-pressure spin shifts in the pseudogap regime of superconducting YBa2Cu4O8 as revealed by O-17 NMR. Physical Review B 83, 220517, (2011).
- [35] B. Vignolle, D. Vignolles, M. H. Julien, C. Proust, From quantum oscillations to charge order in high-T-c copper oxides in high magnetic fields. Comptes Rendus Physique 14, 39-52, (2013).
- [36] O. Cyr-Choini re, D. LeBoeuf, S. Badoux, S. Dufour-Beaus jour, D. A. Bonn, W. N. Hardy, R. Liang, N. Doiron-Leyraud, L. Taillefer, Suppression of charge order by pressure in the cuprate superconductor YBa2Cu3Oy : Restoring the full superconducting dome. ArXiv: 1503.02033.
- [37] G. Grissonnanche, O. Cyr-Choiniere, F. Laliberte, S. R. de Cotret, A. Juneau-Fecteau, S. Dufour-Beausejour, M. E. Delage, D. LeBoeuf, J. Chang, B. J. Ramshaw, D. A. Bonn, W. N. Hardy, R. Liang, S. Adachi, N. E. Hussey, B. Vignolle, C. Proust, M. Sutherland, S. Kraemer, J. H. Park, D. Graf, N. Doiron-Leyraud, L. Taillefer, Direct measurement of the upper critical field in cuprate superconductors. Nature Communications 5, 3280, (2014).
- [38] G. L. Sun, Y. T. Song, C. T. Lin, Investigation of YBa2Cu4O8 single crystal growth by KOH flux. Superconductor Science & Technology 21, 125001, (2008).
- [39] N. E. Hussey, K. Nozawa, H. Takagi, S. Adachi, K. Tanabe, Anisotropic resistivity of YBa2Cu4O8: Incoherent-to-metallic crossover in the out-of-plane transport. Physical Review B 56, 11423-11426, (1997).
- [40] C. Y. Wang, Electrical resistance of manganin coil to 7 kbar and 200 degrees C. Review of Scientific Instruments 38, 24, (1967).
- [41] D. Shoenberg, Magnetic Oscillations in Metals. (Cambridge University Press, Cambridge, England, 1984).
- [42] J. L. Tallon, C. Bernhard, H. Shaked, R. L. Hitterman, J. D. Jorgensen, Generic superconducting phase-behavior in high- cuprates - variation with hole concentration in YBa2Cu3O7-δ . Physical Review B 51, 12911-12914, (1995).
- [43] J. L. Tallon, J. W. Loram, G. V. M. Williams, J. R. Cooper, I. R. Fisher, J. D. Johnson, M. P. Staines, C. Bernhard, Critical Doping in Overdoped High- Superconductors: a Quantum Critical Point? Physica Status Solidi (b) 215, 531-540, (1999).
- [44] B. Vignolle, A. Carrington, R. A. Cooper, M. M. J. French, A. P. Mackenzie, C. Jaudet, D. Vignolles, C. Proust, N. E. Hussey, Quantum oscillations in an overdoped high- superconductor. Nature 455, 952-955, (2008).
- [45] A. F. Bangura, P. M. C. Rourke, T. M. Benseman, M. Matusiak, J. R. Cooper, N. E. Hussey, A. Carrington, Fermi surface and electronic homogeneity of the overdoped cuprate superconductor Tl2Ba2CuO6+δ as revealed by quantum oscillations. Physical Review B 82, 140501, (2010).
- [46] P. M. C. Rourke, A. F. Bangura, T. M. Benseman, M. Matusiak, J. R. Cooper, A. Carrington, N. E. Hussey, A detailed de Haas-van Alphen effect study of the overdoped cuprate Tl2Ba2CuO6+δ . New Journal of Physics 12, 105009, (2010).
Supplementary Materials
| Pressure (GPa) | Field min (T) | Field Max (T) |
|---|---|---|
| 0 | 55.0 | 64.0 |
| 0.37 | 52.0 | 55.2 |
| 0.58 | 53.4 | 58.7 |
| 0.75 | 53.4 | 58.5 |
| 0.84 | 52.5 | 58.0 |