Electric-field dependent -factor anisotropy in Ge-Si core-shell nanowire quantum dots
Abstract
We present angle-dependent measurements of the effective -factor in a Ge-Si core-shell nanowire quantum dot. is found to be maximum when the magnetic field is pointing perpendicular to both the nanowire and the electric field induced by local gates. Alignment of the magnetic field with the electric field reduces significantly. is almost completely quenched when the magnetic field is aligned with the nanowire axis. These findings confirm recent calculations, where the obtained anisotropy is attributed to a Rashba-type spin-orbit interaction induced by heavy-hole light-hole mixing. In principle, this facilitates manipulation of spin-orbit qubits by means of a continuous high-frequency electric field.
I Introduction
Quantum computation (Aaronson, 2013; DiVincenzo, 1995; Ladd et al., 2010) has made an enormous leap from a far-fetched promise (Feynman, 1986) to a realistic near-future technology (Vandersypen et al., 2001; Jones et al., 2012; Veldhorst et al., 2015) during the past three decades. Among others, spin systems in the solid state (Loss and DiVincenzo, 1998; Kane, 1998) have been developed into a mature but still very fast-evolving research field. In recent years increased research efforts have focused on C, Si, and Ge (Laird et al., 2015; Zwanenburg et al., 2013; Amato et al., 2014), which can be purified to only consist of isotopes with zero nuclear spin (Itoh et al., 2003, 1993) and thus exhibit exceptionally long spin lifetimes (Muhonen et al., 2014; Veldhorst et al., 2014).
The one-dimensional character of electrostatically defined quantum dots in Ge-Si core-shell nanowires leads to unique electronic properties in the valence band, where heavy and light hole states are mixed (Csontos and Zülicke, 2007; Csontos et al., 2009; Kloeffel et al., 2011). The band mixing gives rise to an enhanced Rashba-type spin-orbit interaction (Kloeffel et al., 2011), leading to strongly anisotropic and electric-field dependent -factors (Maier et al., 2013). This makes quantum dots in Ge-Si core-shell nanowires promising candidates for robust spin-orbit qubits that can be electrically controlled via circuit quantum electrodynamics (Kloeffel et al., 2013).
Despite these profound theoretical contributions, only few experiments in Ge-Si core-shell nanowires have been reported including Josephson junctions (Xiang et al., 2006), spin-filling (Roddaro et al., 2008), spin relaxation (Hu et al., 2012), spin coherence (Higginbotham et al., 2014a), charge sensing (Hu et al., 2007) in the many-hole regime, and signatures of weak antilocalization (Higginbotham et al., 2014b).
In this work we experimentally explore the an-iso-tro-py of the -factor in Ge-Si core-shell nanowires. We electrostatically define a highly-tunable, elongated hole quantum dot in the nanowire by means of local gates. We measure the Zeeman splitting of a single-particle state in the quantum dot while rotating the magnetic field around the high-symmetry axes of the system and find a strong anisotropy with respect to the nanowire as well as to the electric field, in line with theoretical predictions (Maier et al., 2013).
II Gate-defined quantum dots
Our device in Fig. 1(a) consists of a p-doped Si substrate covered with 200 nm SiO, on which six bottom gates with 100 nm pitch are patterned with electron-beam lithography (EBL). The gates are buried by 10 nm AlO grown with atomic layer deposition at C. A single nanowire with a Si shell thickness of 2.5 nm and a defect-free Ge core with a radius of 8 nm (Li et al., 2016) is deterministically placed on top of the gate structure with a micromanipulator and then contacted with ohmic contacts made of 0.5/50 nm Ti/Pd. A source-drain bias voltage is applied to the source, the current is measured between the drain and ground. All measurements are performed using dc electronic equipment in a dilution refrigerator with a base temperature of 8 mK and an effective hole temperature of mK determined by measuring the temperature dependence of the Coulomb peak width Mueller et al. (2013); Goldhaber-Gordon et al. (1998).
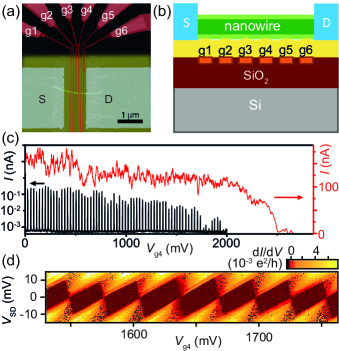
We use this gate design Fasth et al. (2005) to electrostatically define a single quantum dot Kouwenhoven et al. (1997); Fasth et al. (2005). The two barrier gates g3 and g5 control the tunnel barriers, and a third plunger gate g4 the electrochemical potential of the quantum dot. In Fig. 1(c) we plot versus the voltage on g4 . When applying a high mV we observe a strong suppression of for V, indicating depletion of the nanowire at V. At low mV we observe Coulomb peaks Kouwenhoven et al. (1997) with a regular spacing of mV over a range of 2 V, i.e. we are able to change the hole occupation of the quantum dot by more than 60 holes. Above V no regular Coulomb peaks are observed, but the high-bias gate sweep suggests that the quantum dot is not completely emptied, i.e. in this device we are unable to identify the last hole on the quantum dot. If we assume the plunger gate coupling to stay constant and the quantum dot to be empty at V, we can estimate the number of remaining holes to be at V. Reaching the single-hole regime was not possible in our device.
A non-linear transport measurement is displayed in Fig. 1(d). In this bias spectroscopy we plot the numerical differential conductance vs. and , as will be in all the following bias spectroscopy plots. Formation of a single quantum dot is indicated by regularly shaped, closing Coulomb diamonds Kouwenhoven et al. (1997). The height of the Coulomb diamonds indicates an addition energy of meV. The variations in cannot be explained by an interacting second quantum dot, which would lead to non-closing diamonds. Orbital shell filling can cause the variations in Tarucha et al. (1996); Kouwenhoven et al. (2001). The low number of residing holes ( 25-30) supports this reasoning.
The results in Fig. 1 show a highly tunable nanowire device in which we intentionally define a very stable quantum dot. We can control the number of holes in the quantum dot over a wide range from approximately 85 down to approximately 17.
III Zeeman splitting of the orbital ground state
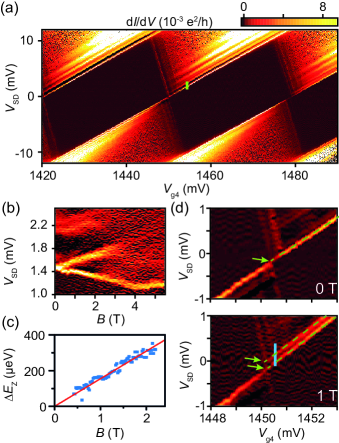
We now investigate the Zeeman splitting of the spin-degenerate quantum dot states Hanson et al. (2007). To determine the -factor with high accuracy, we choose a charge transition where the onset of conductance is sufficiently separated from other lines of increased conductance corresponding to, e.g., (orbital) excited states of the quantum dot, or resonances due to the low dimensionality of the leads Escott et al. (2010). In Fig. 2(a) we show a bias spectroscopy of such a charge transition together with the two Coulomb diamonds adjacent to it. The number of residing holes here is approximately 35, again estimated by comparing the current plunger gate voltage ( mV) to the depletion voltage at high bias ( V).
We keep the plunger-gate voltage at mV and sweep along the green line in Fig. 2(a) at different magnetic fields while measuring the current [Fig. 2(b)]. The magnetic field here is applied in the plane of the chip perpendicular to the nanowire axis. At , one very pronounced peak marks the onset of conductance, which splits up into a spin-ground and spin-excited state at finite magnetic fields. Note that the shifts of the two states are symmetric and linear up to at least 2 T, indicating that for magnetic fields T the linear Zeeman splitting is the only relevant term, and other effects, such as a diamagnetic shift Rinaldi et al. (1996); Zielke et al. (2014), are negligible. The spin splitting of the orbital ground state is further confirmed by the two bias spectroscopies in Fig. 2(d) at and T. The spin-degenerate orbital ground state of the charge transition at [indicated by a single green arrow Fig. 2(d)] is clearly split into two lines at T (indicated by two green arrows).
We extract the Zeeman splitting by converting the scale into energy. The lever arm with , where is the total capacitance of the dot, and is the source capacitance) for this conversion is graphically extracted: the slopes of the Coulomb diamond edges from Fig. 2(a) are and , where is the gate capacitance (Hanson et al., 2007). By using we find a lever arm of . The linear increase of with increasing is shown in Fig. 2(c). We fit the slope of according to , where is the effective -factor, and is the Bohr magneton [see Fig. 2(c)]. This yields an effective -factor for this transition of . We point out that the spin states are mixtures of heavy and light hole states and therefore , which is accounted for by the introduction of as an effective -factor. Note that may differ significantly from transition to transition due to the varying heavy-hole light-hole mixing of subbands and quantum dot states Kloeffel et al. (2011) at the valence band edge of the nanowire Roddaro et al. (2008); Kloeffel et al. (2013).
In summary, in Fig. 2 we determine the effective -factor to be for an in-plane magnetic field perpendicular to the nanowire. The corresponding Zeeman splitting is symmetric and linear up to at least 2 T.
IV g-factor anisotropy
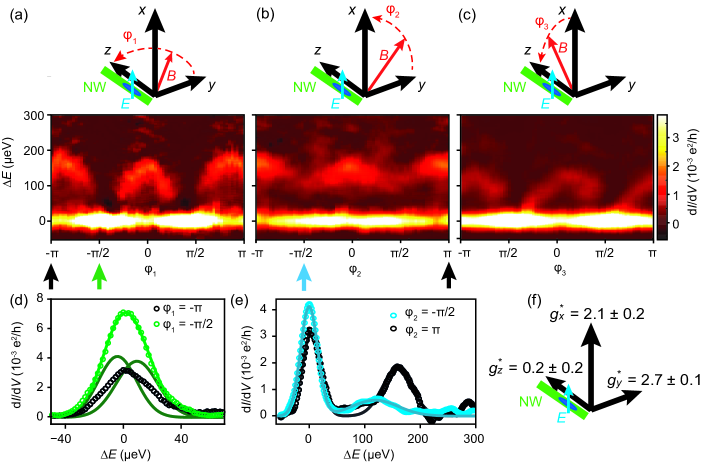
To investigate the anisotropy of the -factor, we measure the Zeeman splitting of the ground state at a fixed magnetic field magnitude of T while changing the direction of . We choose the coordinate system in accordance with Maier et al. Maier et al. (2013), i.e. the -axis points along the nanowire axis, the -axis points out of the chip plane parallel to the electric field produced by the bottom gates, and the -axis is in plane with the chip and perpendicular to the nanowire [see Fig 3(a)]. We will show measurements in three orthogonal rotation planes. Within each plane, a full -rotation of is performed in steps of . For each step, is measured vs. along the blue line in Fig. 2(d). The values for along the different directions are obtained by fitting the line cuts with two peaks for the spin-ground and spin-excited states and calculating the distance between the two peak centers.
First we rotate the magnetic field from the -axis to the -axis [Fig. 3(a)]. At , the Zeeman splitting of eV corresponds to a -factor of [in agreement with Fig. 2(c)]. The Zeeman splitting decreases when the magnetic field is rotated towards the nanowire axis, until it is almost completely quenched at with eV, corresponding to . For the magnetic field along the -axis the peak is approximately twice as high and also significantly broadened compared to the peak. This indicates that here the Zeeman splitting is too small for the two peaks of the spin-excited and spin-ground state to be resolved. However, the broadened peak can be fitted very well with two peaks that have approximately the height and width of the peak for the spin-ground state measured along the -axis. This provides further confirmation that the broadened peak is indeed a superposition of two separate peaks.
For the second measurement always points in a direction perpendicular to the nanowire and is rotated from the axis at (the same field direction as for in Fig 3(a) to the axis at . Along the axis, the Zeeman splitting is again eV. The Zeeman splitting decreases until it reaches eV along the -axis, which corresponds to a -factor of . In Fig. 3(e) two line cuts from Fig. 3(b) along the -axis (red curve) and the -axis (blue curve) are presented along with the fitted curves that were used to calculate .
The third rotation plane is the - plane, with pointing along the -axis, and along the -axis [see Fig. 3(c)]. At we measure a spin splitting of eV, corresponding to a -factor of . Rotation of towards the axis again results in a Zeeman splitting of eV, corresponding to .
Combining the three rotation experiments, the Zeeman splitting along each of the , , and axes is measured twice with consistent values across experiments for the effective -factor. Thus we can summarize our findings in Fig. 3(f).
Let us now compare our findings with experimental and theoretical results from the literature. An anisotropy of the effective -factor has been measured in other systems like Si nanowire metal-oxide-semiconductor field-effect transistors (MOSFETs) () (Voisin et al., 2015), InAs nanowires () (Schroer et al., 2011), and InSb nanowires () (Nadj-Perge et al., 2012), all an order of magnitude smaller than our findings of for rotations with respect to the nanowire axis. Also self-assembled SiGe islands on Si have been used for studies on the anisotropy of the effective -factor () (Katsaros et al., 2010), a system that is similar to ours, but lacking the one-dimensional confinement as well as the pronounced strain of our nanowires. None of the reported anisotropies has been attributed to tunable electric fields, where we find for rotation with respect to the -field axis. For Ge/Si core-shell nanowires, Hu et al. Hu et al. (2012) reported an effective -factor of measured with the -field aligned along the nanowire axis . Roddaro et al. Roddaro et al. (2008) have measured for different transitions ranging from 1.6 to 2.2, was here aligned perpendicular to the nanowire. Both values are consistent with our measurements.
A -factor anisotropy can in principle be related to the crystal direction (Nowak and Szafran, 2011). In our probably 110-oriented device, we have observed a different anisotropy for holes states most probably originating from higher subbands, while we have observed qualitatively the same anisotropy in a second device tuned to the few-hole regime. Therefore we have strong evidence that the -factor anisotropy observed here is rather related to an electric-field induced mixing between the lowest-lying subbands as discussed in the following paragraph.
Maier et al. Maier et al. (2013) theoretically investigated the -factor in Ge-Si core-shell nanowires. They assumed elongated quantum dots, i.e. , which is very well fulfilled in our device, where nm and nm. They predicted the -factor to be highly anisotropic, with indeed being quenched along the nanowire axis, and a maximum -factor perpendicular to the nanowire. This is in excellent agreement with our measurements. Moreover, they predicted a lower -factor at finite electric fields. In particular, their calculations showed a more effective diminishment for than for . Also this agrees well with our findings. Maier et al. show that this tunability of the -factor with electric fields is caused by the effective coupling of different subbands through these electric fields and the mixed heavy-hole light-hole nature of the individual subbands. The combination leads to a very pronounced spin-orbit interaction (SOI) introduced as the ‘direct Rashba spin-orbit interaction’ Kloeffel et al. (2011) because of its resemblance of the standard Rashba SOI and the fact that it is a leading-order process not suppressed by the band gap and thus expected to be 10-100 times stronger than the standard Rashba SOI for geometries similar to our device.
Also quantitatively our measurements agree very well with the predictions regarding the -factor quenching along the nanowire axis. The -factor suppression by the electric field is less pronounced than the calculations. This can be explained by differences in the exact geometry of the wires, the quantum dot not being in the single-hole regime, and the fact that our device is operated at significantly higher electric fields than assumed by Maier et al.
Let us now briefly discuss the implications of these results for quantum computation applications. A main obstacle for spin-based qubits is the fast coherent manipulation of the spin state. In principle this can be done with a pulsed high-frequency (HF) magnetic field, but this is technologically very challenging. Our results imply that it is not only possible to use pulsed HF electric fields as also used in other systems with significant SOI (Nowack et al., 2007; Nadj-Perge et al., 2010), but with continuous HF electric fields while tuning the qubit in and out of resonance by changing the static electric field, e. g., through a combination of top and bottom gates.
V Conclusion
In conclusion, we have demonstrated control over the hole occupancy in a Ge-Si core-shell nanowire quantum dot over 60 charge transitions. The effective -factor has been found to be highly anisotropic with respect not only to the nanowire axis but also the electric-field direction. In particular we have found excellent qualitative agreement between our measurements and theoretical calculations Maier et al. (2013). This opens the way to controlled manipulation of the spin-state with a continuous high-frequency electric field, a major technological advancement.
Acknowledgements.
We thank Christoph Kloeffel, Daniel Loss, and Wilfred van der Wiel for fruitful discussions and careful reading of the manuscript. We acknowledge technical support by Sergey Amitonov, Paul-Christiaan Spruijtenburg, and Hans Mertens. F.A.Z. acknowledges financial support through the EC Seventh Framework Programme (FP7-ICT) initiative under Project SiAM No. 610637, and from the Foundation for Fundamental Research on Matter (FOM), which is part of the Netherlands Organization for Scientific Research (NWO). E.P.A.M.B. acknowledges financial support through the EC Seventh Framework Programme (FP7-ICT) initiative under Project SiSpin No. 323841.References
- Aaronson (2013) S. Aaronson, Quantum computing since Democritus (Cambridge University Press, 2013).
- DiVincenzo (1995) D. DiVincenzo, Science 270, 255 (1995).
- Ladd et al. (2010) T. D. Ladd, F. Jelezko, R. Laflamme, Y. Nakamura, C. Monroe, and J. L. O’Brien, Nature 464, 45 (2010).
- Feynman (1986) R. P. Feynman, Foundations of Physics 16, 507 (1986).
- Vandersypen et al. (2001) L. M. Vandersypen, M. Steffen, G. Breyta, C. S. Yannoni, M. H. Sherwood, and I. L. Chuang, Nature 414, 883 (2001).
- Jones et al. (2012) N. C. Jones, R. Van Meter, A. G. Fowler, P. L. McMahon, J. Kim, T. D. Ladd, and Y. Yamamoto, Physical Review X 2, 031007 (2012).
- Veldhorst et al. (2015) M. Veldhorst, C. H. Yang, J. C. C. Hwang, W. Huang, J. P. Dehollain, J. T. Muhonen, S. Simmons, A. Laucht, F. E. Hudson, K. M. Itoh, A. Morello, and A. S. Dzurak, Nature 526, 410 (2015).
- Loss and DiVincenzo (1998) D. Loss and D. P. DiVincenzo, Physical Review A 57, 120 (1998).
- Kane (1998) B. E. Kane, Nature 393, 133 (1998).
- Laird et al. (2015) E. A. Laird, F. Kuemmeth, G. A. Steele, K. Grove-Rasmussen, J. Nygård, K. Flensberg, and L. P. Kouwenhoven, Reviews of Modern Physics 87, 703 (2015).
- Zwanenburg et al. (2013) F. A. Zwanenburg, A. S. Dzurak, A. Morello, M. Y. Simmons, L. C. L. Hollenberg, G. Klimeck, S. Rogge, S. N. Coppersmith, and M. A. Eriksson, Reviews of Modern Physics 85, 961 (2013).
- Amato et al. (2014) M. Amato, M. Palummo, R. Rurali, and S. Ossicini, Chemical reviews 114, 1371 (2014).
- Itoh et al. (2003) K. M. Itoh, J. Kato, M. Uemura, A. K. Kaliteevskii, O. N. Godisov, G. G. Devyatych, A. D. Bulanov, A. V. Gusev, I. D. Kovalev, P. G. Sennikov, H.-J. Pohl, N. V. Abrosimov, and H. Riemann, Japanese Journal of Applied Physics 42, 6248 (2003).
- Itoh et al. (1993) K. Itoh, W. L. Hansen, E. E. Haller, J. W. Farmer, V. I. Ozhogin, A. Rudnev, and A. Tikhomirov, Journal of Materials Research 8, 1341 (1993).
- Muhonen et al. (2014) J. T. Muhonen, J. P. Dehollain, A. Laucht, F. E. Hudson, T. Sekiguchi, K. M. Itoh, D. N. Jamieson, J. C. McCallum, A. S. Dzurak, and A. Morello, Nature Nanotechnology 9, 986 (2014).
- Veldhorst et al. (2014) M. Veldhorst, J. C. C. Hwang, C. H. Yang, A. W. Leenstra, B. de Ronde, J. P. Dehollain, J. T. Muhonen, F. E. Hudson, K. M. Itoh, A. Morello, and A. S. Dzurak, Nature Nanotechnology 9, 981 (2014).
- Csontos and Zülicke (2007) D. Csontos and U. Zülicke, Physical Review B 76, 073313 (2007).
- Csontos et al. (2009) D. Csontos, P. Brusheim, U. Zülicke, and H. Q. Xu, Physical Review B 79, 155323 (2009).
- Kloeffel et al. (2011) C. Kloeffel, M. Trif, and D. Loss, Physical Review B 84, 195314 (2011).
- Maier et al. (2013) F. Maier, C. Kloeffel, and D. Loss, Phys. Rev. B 87, 161305 (2013).
- Kloeffel et al. (2013) C. Kloeffel, M. Trif, P. Stano, and D. Loss, Physical Review B 88, 241405 (2013).
- Xiang et al. (2006) J. Xiang, A. Vidan, M. Tinkham, R. M. Westervelt, and C. M. Lieber, Nature Nanotechnology 1, 208 (2006).
- Roddaro et al. (2008) S. Roddaro, A. Fuhrer, P. Brusheim, C. Fasth, H. Q. Xu, L. Samuelson, J. Xiang, and C. M. Lieber, Physical Review Letters 101, 186802 (2008).
- Hu et al. (2012) Y. Hu, F. Kuemmeth, C. M. Lieber, and C. M. Marcus, Nature Nanotechnology 7, 47 (2012).
- Higginbotham et al. (2014a) A. P. Higginbotham, T. W. Larsen, J. Yao, H. Yan, C. M. Lieber, C. M. Marcus, and F. Kuemmeth, Nano Letters 14, 3582 (2014a).
- Hu et al. (2007) Y. Hu, H. O. H. Churchill, D. J. Reilly, J. Xiang, C. M. Lieber, and C. M. Marcus, Nature Nanotechnology 2, 622 (2007).
- Higginbotham et al. (2014b) A. P. Higginbotham, F. Kuemmeth, T. W. Larsen, M. Fitzpatrick, J. Yao, H. Yan, C. M. Lieber, and C. M. Marcus, Phys. Rev. Lett. 112, 216806 (2014b).
- Li et al. (2016) A. Li et al. (unpublished).
- Mueller et al. (2013) F. Mueller, R. N. Schouten, M. Brauns, T. Gang, W. H. Lim, N. S. Lai, A. S. Dzurak, W. G. van der Wiel, and F. A. Zwanenburg, Review of Scientific Instruments 84 (2013).
- Goldhaber-Gordon et al. (1998) D. Goldhaber-Gordon, J. Göres, M. A. Kastner, H. Shtrikman, D. Mahalu, and U. Meirav, Physical Review Letters 81, 5225 (1998).
- Fasth et al. (2005) C. Fasth, A. Fuhrer, M. T. Björk, and L. Samuelson, Nano letters 5, 1487 (2005).
- Kouwenhoven et al. (1997) L. P. Kouwenhoven, G. Schön, and L. L. Sohn, in Proceedings of the NATO Advanced Study Institute on Mesoscopic Electron Transport (Springer Science & Business Media, 1997) pp. 1–44.
- Tarucha et al. (1996) S. Tarucha, D. G. Austing, T. Honda, R. J. van der Hage, and L. P. Kouwenhoven, Physical Review Letters 77, 3613 (1996).
- Kouwenhoven et al. (2001) L. P. Kouwenhoven, D. G. Austing, and S. Tarucha, Reports on Progress in Physics 64, 701 (2001).
- Hanson et al. (2007) R. Hanson, J. R. Petta, S. Tarucha, and L. M. K. Vandersypen, Reviews of Modern Physics 79, 1217 (2007).
- Escott et al. (2010) C. C. Escott, F. A. Zwanenburg, and A. Morello, Nanotechnology 21, 274018 (2010).
- Rinaldi et al. (1996) R. Rinaldi, P. V. Giugno, R. Cingolani, H. Lipsanen, M. Sopanen, J. Tulkki, and J. Ahopelto, Physical Review Letters 77, 342 (1996).
- Zielke et al. (2014) R. Zielke, F. Maier, and D. Loss, Phys. Rev. B 89, 115438 (2014).
- Voisin et al. (2015) B. Voisin, R. Maurand, S. Barraud, M. Vinet, X. Jehl, M. Sanquer, J. Renard, and S. De Franceschi, Nano Letters (2015).
- Schroer et al. (2011) M. D. Schroer, K. D. Petersson, M. Jung, and J. R. Petta, Physical Review Letters 107, 176811 (2011).
- Nadj-Perge et al. (2012) S. Nadj-Perge, V. S. Pribiag, J. W. G. van den Berg, K. Zuo, S. R. Plissard, E. P. A. M. Bakkers, S. M. Frolov, and L. P. Kouwenhoven, Physical Review Letters 108, 166801 (2012).
- Katsaros et al. (2010) G. Katsaros, P. Spathis, M. Stoffel, F. Fournel, M. Mongillo, V. Bouchiat, F. Lefloch, A. Rastelli, O. G. Schmidt, and S. De Franceschi, Nature Nanotechnology 5, 458 (2010).
- Nowak and Szafran (2011) M. P. Nowak and B. Szafran, Physical Review B 83, 035315 (2011), arXiv:arXiv:1009.5637v1 .
- Nowack et al. (2007) K. C. Nowack, F. H. L. Koppens, Y. V. Nazarov, and L. M. K. Vandersypen, Science 318, 1430 (2007).
- Nadj-Perge et al. (2010) S. Nadj-Perge, S. M. Frolov, E. P. A. M. Bakkers, and L. P. Kouwenhoven, Nature 468, 1084 (2010).