Stochastic kinetics reveal imperative role of anisotropic interfacial tension to determine morphology and evolution of nucleated droplets in nematogenic films
Abstract
For isotropic fluids, classical nucleation theory predicts the nucleation rate, barrier height and critical droplet size by accounting for the competition between bulk energy and interfacial tension. The nucleation process in liquid crystals is less understood. We numerically investigate nucleation in monolayered nematogenic films using a mesoscopic framework, in particular, we study the morphology and kinetic pathway in spontaneous formation and growth of droplets of the stable phase in the metastable background. The parameter that quantifies the anisotropic elastic energy plays a central role in determining the geometric structure of the droplets. Noncircular nematic droplets with homogeneous director orientation are nucleated in a background of supercooled isotropic phase for small . For large , noncircular droplets with integer topological charge, accompanied by a biaxial ring at the outer surface, are nucleated. The isotropic droplet shape in a superheated nematic background is found to depend on in a similar way. Identical growth laws are found in the two cases, although an unusual two-stage mechanism is observed in the nucleation of isotropic droplets. Temporal distributions of successive events indicate the relevance of long-ranged elasticity-mediated interactions within the isotropic domains. Implications for a theoretical description of nucleation in anisotropic fluids are discussed.
Introduction
A fluid exhibiting a first order phase transition can transit from an unstable to a stable phase through spinodal decomposition and coarsening, where irregular domains of the stable phase emerge spontaneously and combine to minimize the surface energy. In contrast, transformations from a metastable state occur via nucleation and growth in which droplets of the stable phase are formed in the metastable state and these droplets grow and coalesce to increase the fraction of the stable phase in the system. A classic example of this phenomenon is supercooled water freezing into ice via nucleation and growthFahrenheit (1724). Nucleation in solid solutions is followed by Ostwald ripeningVoorhees (1985), while metallic alloys and bulk metallic glasses conventionally display dendritic growth due to anisotropic surface effectsLipton et al. (1984).
Many fundamental problems in surface interfacial science are concerned with the morphology of the nucleated phase, its growth rate, the first passage time as well as the kinetic route to equilibrium. Questions about droplet morphology are especially pertinent in studies of nematogenic fluids, where the anisotropy associated with the tensorial structure of the order parameter is one of the important factors in the description of the nucleation processCuetos and Dijkstra (2007); Komadina et al. (2015). The microstructure of the nucleus is determined by a nontrivial interplay of competing energies: (i) the anisotropic elastic energy associated with deformations of the tensorial order in the bulk, (ii) the anisotropic interfacial tension related to the director anchoring at the interface between the two phases, and (iii) any external forcing that may be present, e.g. equilibrium thermal fluctuations. Thus, aspherical shape of droplets, complex growth law etc. are to be expected and the nucleation rate may itself lack a precise definitionAbukhdeir et al. (2008).
Recently, liquid crystalline phases have found a multitude of applications in nanoscienceBisoyi and Kumar (2011). Droplet shapes play a crucial role in ink-jet technologyAliño et al. (2012), switching and bistable devicesTseng et al. (2014), photovoltaics as well as in bio-sensor applications with living liquid crystalsZhou et al. (2014). Early experiments found evidence for aspherical spindle-shaped droplets called tactoidsBernal and Fankuchen (1941). Such nuclei were later obtained in theoretical studies assuming homogeneous director distribution inside the dropletHerring (1951); Chandrasekhar (1966); Virga (1994). Progress was hindered for several decades because experimental characterization of early-stage supercritical droplets was not possible. Recently, long carbon nanotubes have been used in optical microscopy to characterize nematic tactoidsJamali et al. (2015).
Computer simulations have traditionally played an important role in the development of an understanding of the kinetics of nucleation and growth. Computer simulations of nucleation processes have to address problems in defining the droplets unambiguously and in developing algorithms to sample rare events. Monte Carlo (MC) studies of hard spherocylinders have been performed, where ellipsoidal clusters with homogeneous director orientation are nucleatedCuetos and Dijkstra (2007); Cuetos et al. (2008). More recently, spherical nanodroplets with a radial hedgehog defect, accompanied by a Saturn-ring at the core and bipolar pole-centered boojum defects with uniform field structure have been reportedArmas-Pérez et al. (2015). It is worth mentioning that kinetic pathways in MC simulations can be misleading, as the algorithm samples the Gibbs distribution in equilibrium without obeying the natural dynamics of the system. Slower growth following a diffusive kinetics are reported in molecular dynamics (MD) simulation and experimentsBradač et al. (2002); Chen et al. (2008). Recent studies have examined the morphology of freely suspended aspherical nanodropletsVanzo et al. (2012). Although MD provides a comparatively well-defined temporal evolution than MC, nematic ordering is often best discussed using coarse-grained methods for which a top-down approach works very wellVanzo et al. (2012) due to the scale invariance of the dynamical equations, allowing its applicability from astrophysical scales, e.g. the Kibble-Zurek mechanismKibble (1976); Zurek (1996), down to nanoscales. We use this approach in our work.
Nematic order is described by a symmetric, traceless tensor , which in component form reads Kleman and Lavrentovich (2002) , where denote the Cartesian directions in a local frame of reference with and the scalar degree of uniaxial and biaxial order, respectively, () the polar and azimuthal angles and averaging is done over a sufficient large coarse-graining volume. [] denote the director, codirector and secondary director forming an orthonormal triad. The Ginzburg-Landau-de Gennes (GLdG) free energy consists of a homogeneous bulk term and an elastic term representing the free-energy cost of distortions due to inhomogeneity, namely , where
| (1) | |||||
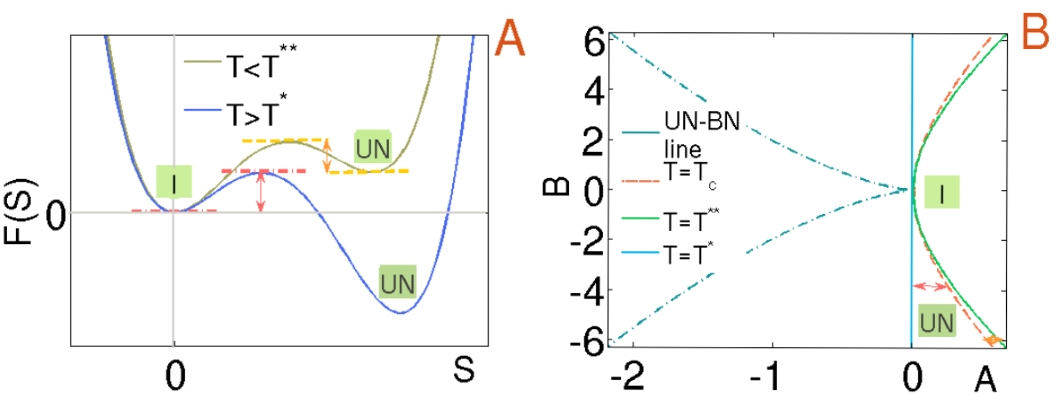
is displayed in fig.[1(A)] that exhibits an asymmetric well landscape characterizing the weakly first order nature of the isotropic-nematic phase transition. The phase diagram in fig.[1(B)] is derived from , where the temperature dependence is contained in the parameter and the parameter depends on the size disparityGramsbergen et al. (1986). Minimizing with respect to yields the equilibrium value
| (2) |
with the clearing point value .
| Fig. | |||||||
|---|---|---|---|---|---|---|---|
| (2,3A-3D) | |||||||
| (3E-3G,4-5) | |||||||
| (6,7A-7D) | |||||||
| (7E-7G,8) |
| Fig. | Fig. | ||||
|---|---|---|---|---|---|
| (2,3A-3D) | (3E-3G,4-5) | ||||
| (6,7A-7D) | (7E-7G,8) |
The first two terms of correspond to isotropic and anisotropic elasticity with the final term being a higher order contribution. The elastic constants are obtained from experimental measures of Frank-Oseen splay (), twist () and bend () elastic constants via the relation Schiele and Trimper (1983),
| (3) |
where and (). Third order terms can be neglected () leading to degenerate splay and bend with twist either large or small depending on the sign of Wincure and Rey (2006); Kleman and Lavrentovich (2002). Thus the GLdG theory loses its validity if bend and splay constants are very different. The one elastic constant approximation is often considered for analytic convenience, where corresponds to . However, experimental measures of elastic constants in units of and GLdG coefficients in units of for (a) 5CB at 25∘C are and (b) MBBA at 25∘C are Blinov and Chigrinov (1994). gives for 5CB, and for MBBA, . This explains why the one elastic approximation is inappropriate in a description of certain nematogenic materials.
Using this free energy, the geometric structure of monolayered droplets has been studied analytically in the past two decades, either making several simplifying assumptionsLansac et al. (1995); Sonnet et al. (1995); Prinsen and van der Schoot (2003), or through an exact computationBhattacharjee et al. (2008). Going beyond the Frank-Oseen description of the elastic energyLandau and Lifshitz (1975) and without enforcing any phenomenological Rapini-Papoular (RP) surface energy termRapini, A. and Papoular, M. (1969), noncircular nematic droplets with integer topological charge have been found to grow ballisticallyLansac et al. (1995) in a deterministic (no thermal noise) calculation.
Homogeneous nucleation kinetics can not be studied in the deterministic GLdG framework because droplets of the stable phase cannot spontaneously nucleate in a metastable medium in the absence of thermal fluctuations. Near the transition point, droplet growth is governed by capillary forces rather than the small free energy difference or volume driving force, where fluctuations play a crucial roleWincure and Rey (2007). To understand how fluctuations influence the dynamics and microstructural evolution, one needs (i) the theoretical formulation of a stochastic GLdG description of the dynamics and (ii) a numerical prescription to integrate the stochastic equation for the orientation tensorStratonovich (1976) paying special attention to the structure of the noise and satisfying the fluctuation-dissipation theorem (FDT). The first question was addressed by StratonovichStratonovich (1976) by writing an overdamped Langevin equation in model-A relaxational dynamics that excludes coupling to any external hydrodynamic flow asHohenberg and Halperin (1977); Bhattacharjee et al. (2010)
| (4) |
where the coefficient of rotational diffusion controls the relaxation rate and the symmetric traceless tensorial random force satisfies the property, to ensure FDT and thus Gibbs distribution at equilibrium Landau and Lifshitz (1980). and brackets denote the Boltzmann constant, equilibrium temperature and average over the probability distribution of . The first term in leads to in equation(4), indicating an isotropic diffusion of . The second term in leads to in the evolution equation, resulting in an orientation dependent Q-diffusion that leads to two diffusion constants in the nematic phase. The anisotropy is controlled by the parameter defined above. An efficient method for numerical integration of this equation was developed in a recent work of the author Bhattacharjee et al. (2010) that motivated the present study.
Classical nucleation theory (CNT) estimates the critical size of a droplet, the barrier height and the nucleation rate using the assumption that nucleation proceeds via the formation and expansion of spherical dropletsRayleigh (1899); Becker and Döring (1935). The excess free energy of a droplet is obtained as , where is the droplet radius, is the density of the nucleated phase, is the chemical potential difference with being the emitted latent heat due to a change in temperature and is the interfacial surface tension. Maximizing with respect to yields and the barrier height . The nucleation rate is defined as where is a kinetic prefactor often hard to measure in experiments, making the rate calculation a formidable problem.
For droplets formed in a nematogenic material, due to the inherent anisotropy in the field variables, the free energy takes the form
| (5) |
where and respectively denote the transformed volume and the enclosing surface. The complexity that renders an analytical insight difficult lies in the nontrivial coupling between principal values and principal axes of the Q-tensor. For an ellipsoidal droplet with homogeneous director distribution, analytic expressions can be derived from the above equation Cuetos et al. (2008); Popa-Nita and Sluckin (1996) without considering a RP-term. However, for a noncircular droplet with an embedded defect, singular volume and surface integrals restrict the applicability of an analytic approach. The interfacial surface tension is thermodynamically defined as the excess surface energy per unit area. The first and second terms in contribute to the isotropic and anisotropic parts of the surface energy, respectively. The excess anisotropic surface energy is controlled by the parameter defined earlier, that differentiates between strong and weak anchoring of the director at the interface.
Nucleation and growth are often characterized by the Johnson-Mehl-Avrami-Kolmogorov (JMAK) equation Avrami (1939, 1940, 1941) , where is the volume fraction of the nucleated phase, depends on the shape of the droplet and is a constant related to the growth velocity . For isolated spherical droplets with number density , simple analysis shows that . However, if we consider expanding ellipsoidal droplets where the long and the short axes increase self-similarly, then the parameters turn out to be . Higher exponents and fractional exponents are also seen in experiments and conventionally calculated through a plot of
| (6) |
versus . While the exponent is dictated by the dimensionality of the droplet, a departure from the predicted value suggests the inapplicability of simple theory and breakdown of CNT. In our results, droplet represents a quasi two-dimensional “raft”-like geometry formed in monolayered film.
Results
We first discuss the tensorial microstructure and evolution of thermally generated nematic droplets in a supercooled isotropic phase. This is done for varying anisotropic surface energy and the results are compared with the predictions of classical theories of nucleation to test their applicability. We probe the role of long range elasticity mediated interaction on the distribution of the first passage time between successive events. We also consider the nucleation of isotropic droplets in a superheated nematic phase. The numerical values of the parameters used in our simulations are tabulated in Table 1.
Nucleation in supercooled isotropic phase
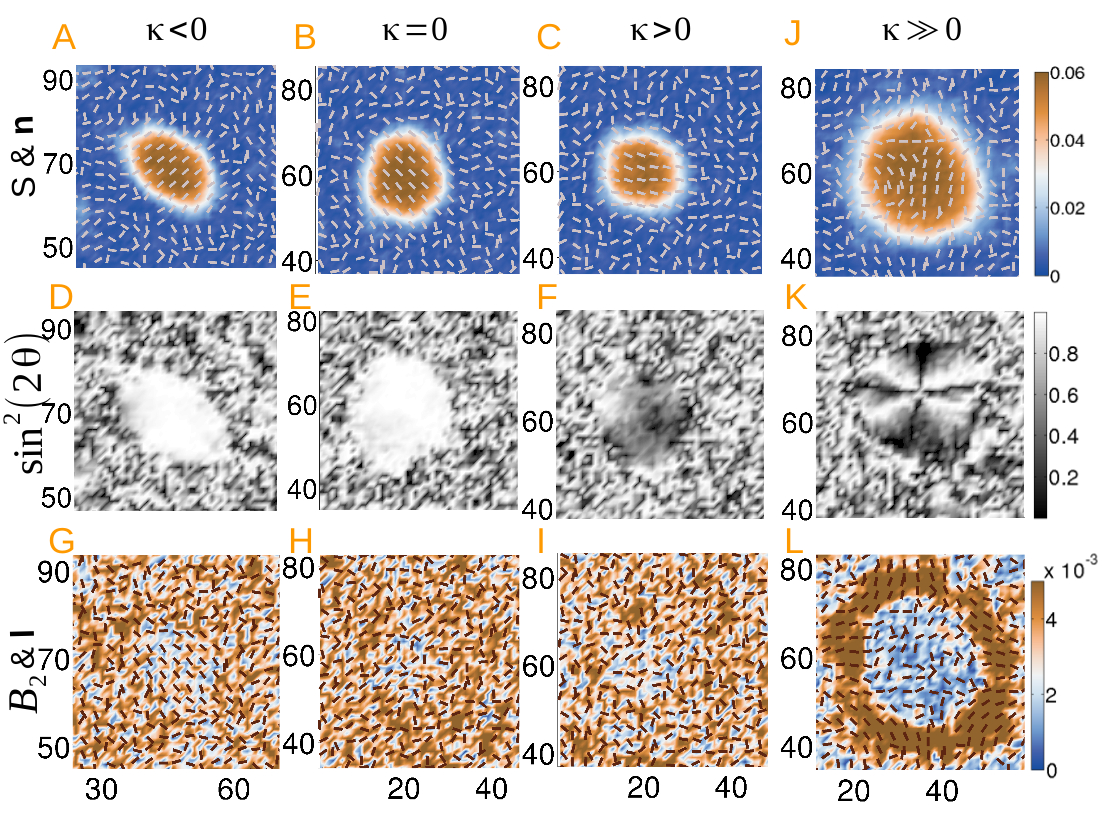
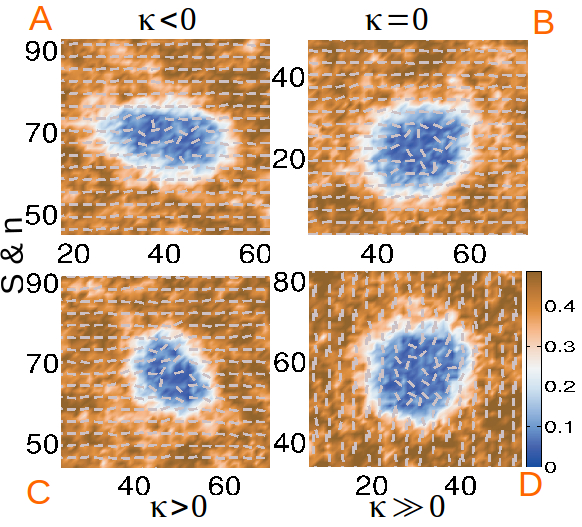
Our central findings are summarized in terms of the droplet morphology, evolution of the Q-tensor and the free energy, growth law and temporal distribution of nucleation events. Fig.(2) shows the supercritical droplet structure at the post-nucleation stage in terms of the uniaxial order and the director distribution n, the biaxial order and codirector distribution , as well as the Schlieren texture for different values of chosen to ensure the positivity of the Frank elastic constants. The nucleated droplet in panel (B) is circular in the one elastic constant approximation () while the droplet in the weak anchoring limit (small ) shown in panels (A,C) is noncircular. As indicated by the orientation of n, homeotropic anchoring at the interface is preferred for , corresponding to (defined in eq.(Introduction)), where the uniform director inside the droplet orients perpendicular to the long axis. For negative values of , its magnitude cannot be arbitrarily large as an unphysical correlation length is numerically unavoidable for the analytical lower bound de Gennes (1971). On the other hand, planar anchoring is favoured for corresponding to , where the director orients parallel to the long axis. For a flat interface, the total energy is lowered for planar or homeotropic director anchoring for being smaller or larger than . This result is often termed as the de Gennes ansatzde Gennes (1971). Though this ansatz does not hold for curved interfaces (shown in the Supplementary Information), our results agree reasonably well with it. This result is also in agreement with deterministic GLdG calculations for bubbles created by handBhattacharjee et al. (2008) and MC, MD simulationsCuetos and Dijkstra (2007); Vanzo et al. (2012). This result, however, contradicts those of Ref. Lansac et al. (1995), where encapsulated integer-charged defects are reported inside an artificially constructed droplet for in the range [parameter in this study is related to by ]. Uniformly white textured domains in panels (D-F) are indicative of the homogeneous director distribution in panels (A-C). Finally, panels (G-I) illustrate that has a small value (the order is uniaxial without any codirector or secondary director ordering) except for . Biaxial fluctuations are visible in the isotropic film as due to the presence of stochastic forcing.
This picture, however, changes dramatically in the strong anchoring limit () as evident in the panels (J-L), where the microstructure at , corresponding to , is depicted. Nonuniform director orientation inside the noncircular droplet corresponds to four-brush texturing that represents a hyperbolic hedgehog defect. The topological charge of is quantified through a Volterra processKleman and Lavrentovich (2002). This reveals that there exists a threshold value of , for which the surface anisotropy is large enough to distort the field structure inside the droplet to encapsulate a defect. While the generation and growth of a supercritical nucleus depends on the competition between bulk and surface contributions, with the latter increasing with , the shape and director configuration inside the nematic region strongly depend on the surface interfacial anisotropy. The codirector and the secondary director (not shown) also have a singular structure with reaching a maximum on a noncircular ring embedded in the outer region of the droplet. This is consistent with the understanding that a planar interface exhibits local biaxiality for large Kamil et al. (2009). When approximating the droplets to be circular, the critical droplet size can be estimated in terms of the parameters in the GLdG free energy. As mentioned in the caption of fig.(2), unreasonable values of are obtained as the droplets become more noncircular with a nonuniform director arrangement. However, no analytic formula for can be obtained within a stochastic GLdG theory.
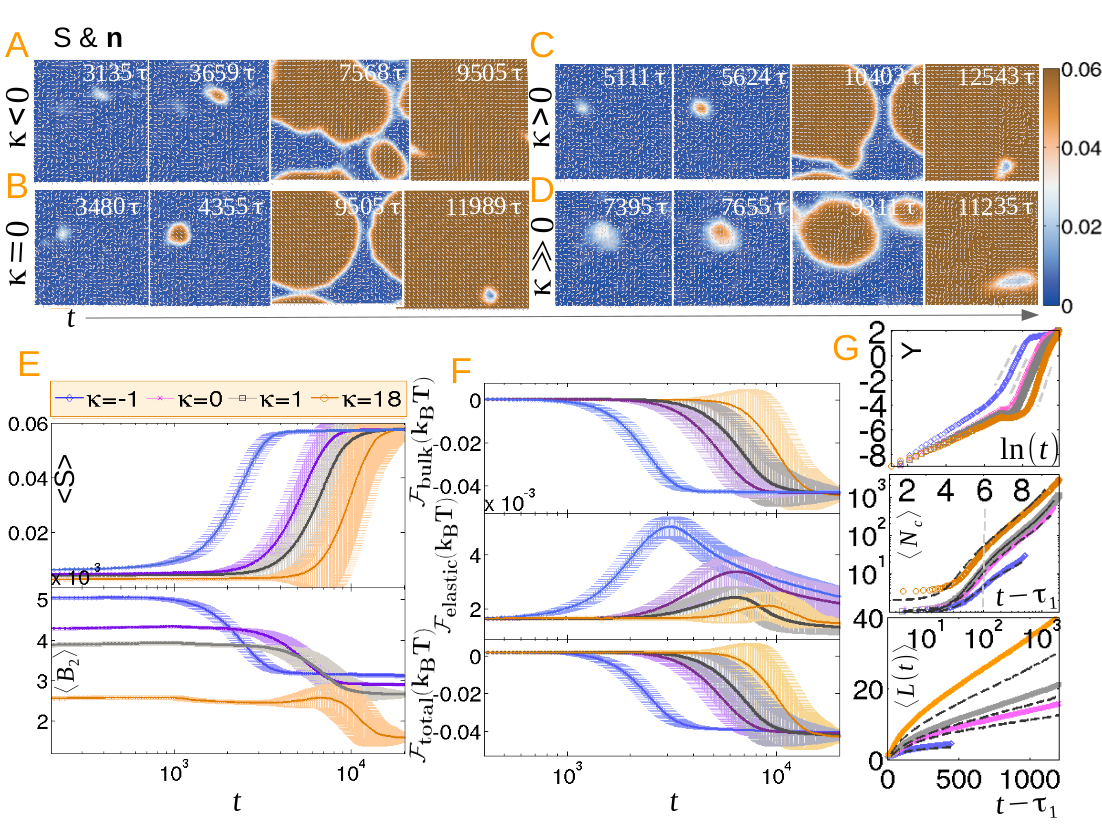
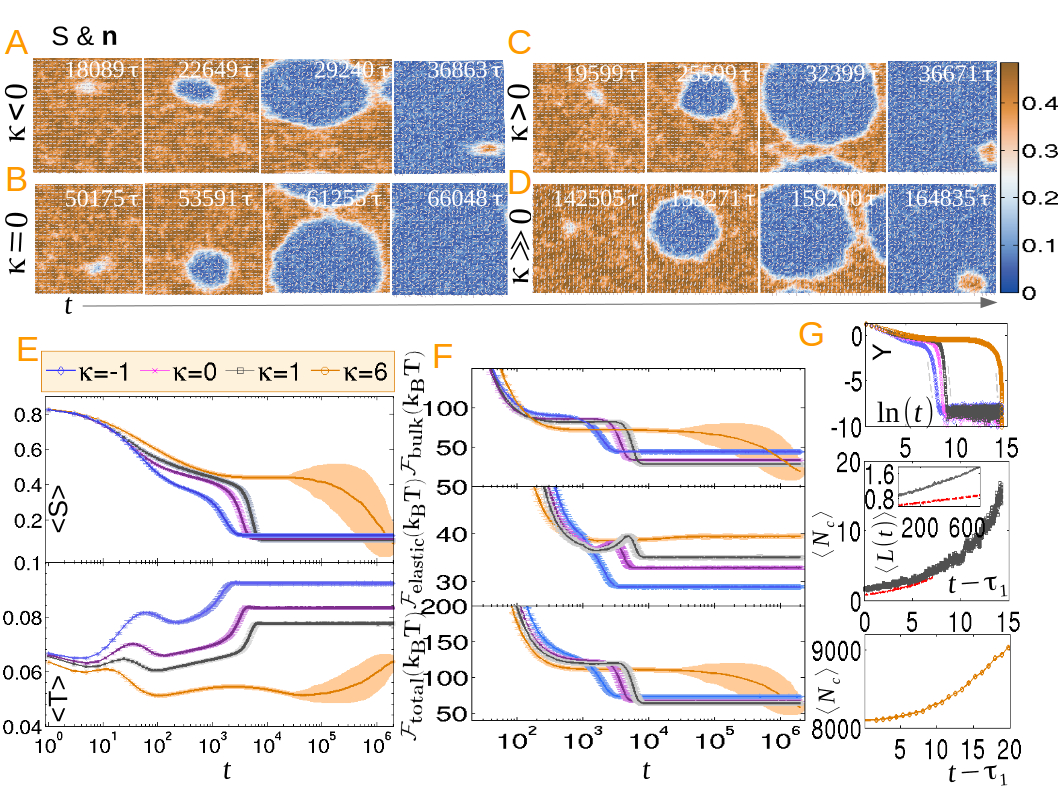
Next we address the various stages of the kinetics. Panels (A-D) of fig.(3) illustrate the pre, post, intermediate and late stage structure of and for different and with large , implying droplets with a large surface energy. Increasing the barrier height results in a prolonged pre-nucleation stage and fewer supercritical droplets emerge in the post-nucleation period. Droplets grow self-similarly, coalesce at the intermediate stage and span the system at the late stage without forming any defect-antidefect pair. However, for smaller surface energy and , half-integer defects with two-brush textures emerge due to the coalescence of droplets that resembles a reduced uniaxial order within the defect core (see Supplementary Animation S1). The ordering kinetics proceeds via the annihilation of defects, thus reducing the total free energy of the film. For , structures similar to boojum defects emerge at opposite poles of the droplet, where has saturated to the equilibrium value without displaying any half-integer defects. For , the nematic region gradually encroaches the isotropic domain with saturating relatively quickly as compared to the integer defect annihilation kinetics. The four-brush texturing persists even at a very late stage without generating any two-brush texturing (see Supplementary Animation S2).
To understand the role of in the kinetics, the growth and decay of average uniaxial and biaxial ordering for small are depicted in panel (E). The sigmoidal profile of in the upper panel with higher intermediate slope inbetween two smaller slopes at early and late stages of the kinetics is a typical characteristic of nucleation followed by a growth process. For , is identified as the pre-nucleation stage where subcritical nuclei shrink to zero, while denote the emergence of the supercritical nucleus and growth by agglomeration. Finally, the saturation of for corresponds to the defect annealing process. As anticipated, the nucleation time is prolonged for increasing , resulting from increased surface energy and hence a higher barrier height. Thus the number of droplets decreases for higher surface anisotropy. The fraction of the stable phase, and the function are computed from the profile of and fits to the JMAK equation(6) are displayed in the upper panel of (G). The intermediate slope indicated by the dashed grey lines with scaling exponent indicates a breakdown of the simple theory and inapplicability of a CNT description. in the lower panel of (E) decreases in a step fashion as the nematic phase is approached. A nonzero biaxiality at equilibrium conveys a departure from a purely uniaxial nematic film, with the magnitude of decreasing with increasing . attains an intermediate maximum before a step decrease for . This is related to the coalescence of the biaxial rings shown in fig.[2(L)].
The total (free) energy of the film and the contributions from bulk and elastic energies are displayed in the panel (F). decreases monotonically with time. is smaller than by about an order of magnitude. The elastic energy slowly increases and exhibits an overshoot before decreasing to attain the equilibrium value. The overshoot is maximized for , arising from the coalescence of homeotropically anchored nematic droplets leading to a maximum in elastic energy. The overshoot gradually decreases with increasing , as less elastic energy is needed in combining planar anchored droplets.
The growth of the first nucleated cluster and the average cluster size at the post-nucleation stage before coalescence are displayed in the middle panel of (G). The growth law follows a polynomial form , where are fit parameters. As scales as the square of the characteristic length , the growth law for a tagged cluster is predicted to be
| (7) |
Evolution of the length scale for a tagged cluster, along with the average cluster size, is plotted in the lower panel of (G). In a brief period of the post-nucleation stage, the term in eq.(7) can be neglected to obtain a diffusive, thermally limited regime where curvature elasticity and capillary forces play a more significant role than the free energy difference or the volume driving forces. Furthermore, the Laplace pressure is large due to a small radius of curvature and the surface interfacial tension, as well as the noncircular morphology of the droplet, induce local shear effectsWincure and Rey (2006, 2007); Huisman and Fasolino (2007); Everts et al. (2016). A crossover to a ballistic volume driven growth regime at a later stage, marked with a grey vertical line in the middle panel, where the term in eq.(7) can be neglected, corresponds to a propagating interface front before droplet coalescence. The late stage ballistic growth in deterministic spinodal kinetics in confined circular films has been addressed earlier with a crystal growth equation supplemented to the deterministic GLdG frameworkWincure and Rey (2007). Experiments in confined geometry, however, find diffusive dynamics at long times, which is incorporated in the deterministic GLdG formalism along with the equation for latent heat at the interface. As the heated interfacial temperature becomes comparable to that of the nematic bulk, growth reaches a diffusive steady state with an equal rate of generation and diffusion of latent heatChen et al. (2008); Abukhdeir et al. (2008). However, when the film is not confined, the latent heat effects are unimportant due to faster expulsion of heat from the droplet surface, leading to a long time ballistic growth.
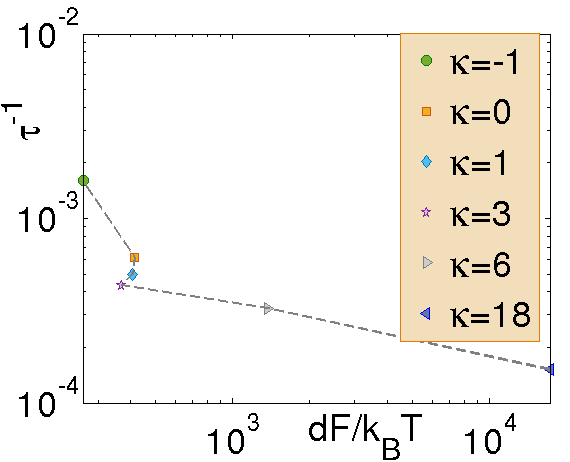
To evaluate the validity of the CNT, we compute the nucleation rate as a function of the barrier height as sketched in fig.(4). A significant departure from a decaying exponential signals a breakdown of the CNT. The CNT deals with the rate of phase change and growth of the supercritical cluster without accounting for fission and coalescence. Moreover, the occurrence of exponential dependency is expected in the Becker-Döring limit, i.e. near the coexistence line and for steady state rates. While deformation of the tensorial field due to high elastic anisotropy results in the formation of noncircular droplets, the theory can be applicable in the limit where director deformation is negligible and a circular shape is retained. In the weak anchoring limit (small ), the CNT can still be applied if a noncircular shape is incorporated in the standard theoryCuetos et al. (2008) and the kinetic prefactor can be obtained from experimental results. However the CNT has to be supplemented to accommodate singularity in in order to make it applicable in the strong anchoring limit ().
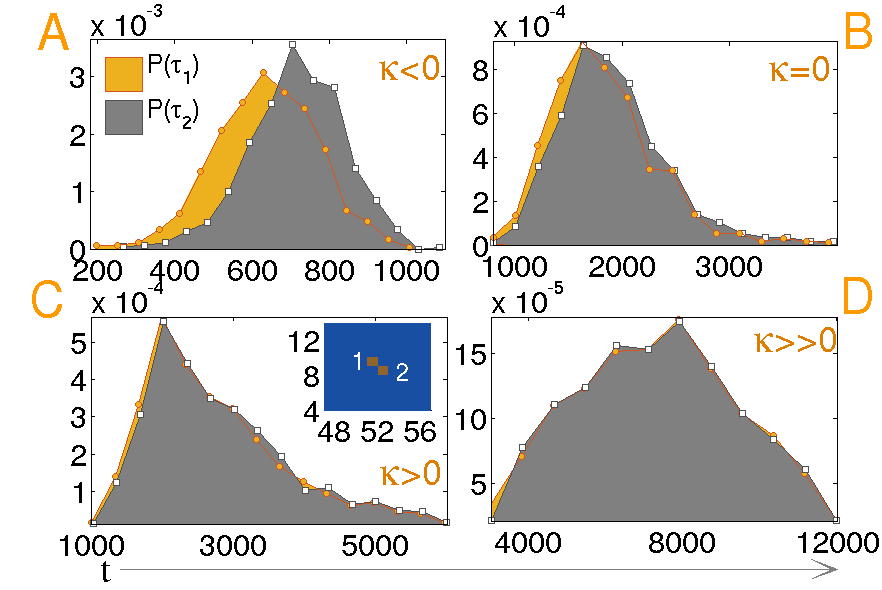
Finally to investigate the role of the isotropic medium on the temporal distribution of nucleation events, we study the spatiotemporal correlation between the first passage times of two consecutive nucleation events. Normalized histograms shown in fig.(5) are sharply peaked for and the peak broadens for increasing . Also the distributions are correlated in time for , although long-ranged elastic interactions are not present in the supercooled isotropic film. The reason for this correlation is not clear. The correlation disappears as is increased. Recall that in the isotropic phase, the correlation length is close to few grid spacings, so that events separated by more than that are unambiguously recognized as nucleation events. In the inset of panel(C), the spatial proximity of two such occurrences are shown. These events are temporally uncorrelated in spite of their spatial proximity. For both distributions coincide, indicating no memory of consecutive events.
Nucleation in the superheated nematic phase
The isotropic droplet morphology, evolution of the Q-tensor, growth kinetics and temporal distribution of nucleation events have also been examined for the case where thermal fluctuations nucleate droplets of the isotropic phase in a superheated nematic film. Within feasible computational effort, nucleation of isotropic droplets can be obtained only for . Fig.(6) displays the structure of supercritical droplets at the post-nucleation stage in terms of and for large and different values of . Noncircular droplets nucleate for , while in panel (B) the droplet shape remains nearly circular for (one elastic constant approximation). The director distribution is randomized inside the droplet, indicating isotropy with no observable biaxiality. Unlike colloidal inclusion in a nematic mediumRamaswamy et al. (1996) or in nematic shellsBates (2016), homeotropic anchoring at the interface by forming defects outside the droplet is not preferred.
To characterize the evolution process, panels (A-D) of fig.(7) portray the pre, post, intermediate and late stage structure of and at a higher surface energy. Subcritical droplets form and collapse in the pre-nucleation stage while a supercritical droplet nucleates and expands self-similarly in the post-nucleation period. Droplet coalescence converts the film into a fluctuating isotropic state at the late stage of the kinetics. In a shallow quench where the surface energy and the barrier height is reduced, many small droplets are formed and they coalesce with each other. At a late stage, uniform regions of nematic order are squeezed and removed from the isotropic film. Rather surprisingly, in panel (E) depicts of an unusual two-step decay process, while displays two minima. We interpret this observation in the following way (see Supplementary Animation S3). Quenching a uniform nematic medium to metastability at a higher temperature induces fluctuations that decrease the scalar order parameter. The plateau in corresponds to its “quasi-equilibrium” value in the superheated metastable state. For smaller surface energy and a reduced barrier height, the typical size of regions of fluctuation-induced melting is comparable to the critical droplet size. Therefore, the subcritical droplets do not shrink to zero but persist for sufficient amount of time at the pre-nucleation stage, until fluctuations induce the formation of a supercritical droplet. Several other mechanisms for the slowing down of the decay of may be present, for instance (i) fluctuation induced broadening of the zero curvature value of the superheating line in fig.(1), (ii) higher Laplace pressure arising from small droplets, (iii) curvature elasticity and capillary force effects. Local heating due to the emission of latent heat at the droplet surface can be ignored, while such effects become important at higher droplet radius in confined geometryHuisman and Fasolino (2007); Chen et al. (2008). As the minimum in corresponds to the maximum in , two minima separated by a plateau occurs in the lower panel of (E). The post-nucleation droplet growth due to agglomeration is displayed in the upper panel of (G) which is characterized by the JMAK equation, with the slope sketched in grey dashed lines. Scaling exponents indicate to a breakdown of the CNT description.
Further support of the two-stage growth process is provided in the evolution of energy as highlighted in panel (F). slowly decreases after exhibiting two overshoots, with the prominent one at a late stage before saturating to the equilibrium value. The overshoot corresponds to a maximum in the elastic energy during droplet coalescence. Both bulk and total free energies display a plateau where growth remains temporally frozen. As is evident, the plateau increases with increasing , indicating that more surface energy slows down the formation of supercritical nuclei. These effects are more evident when higher surface energy is considered (see Supplementary Animations S3 and S4) where due to increased barrier height, the critical radius is large compared to the fluctuation-induced melted droplets and subcritical droplets disappear quickly from the film.
To quantify the growth process, we explore the evolution of a tagged cluster and the average cluster size . Middle and lower panels of (G) display them for and . For , it was impossible to keep track of single clusters due to very small correlation length. Evolution of the average cluster length, shown in the inset of the middle panel, is found to follow the tagged cluster dynamics. The growth law is observed to obey eq.(7) with a change of an early diffusive to a late stage ballistic growth before coalescence.
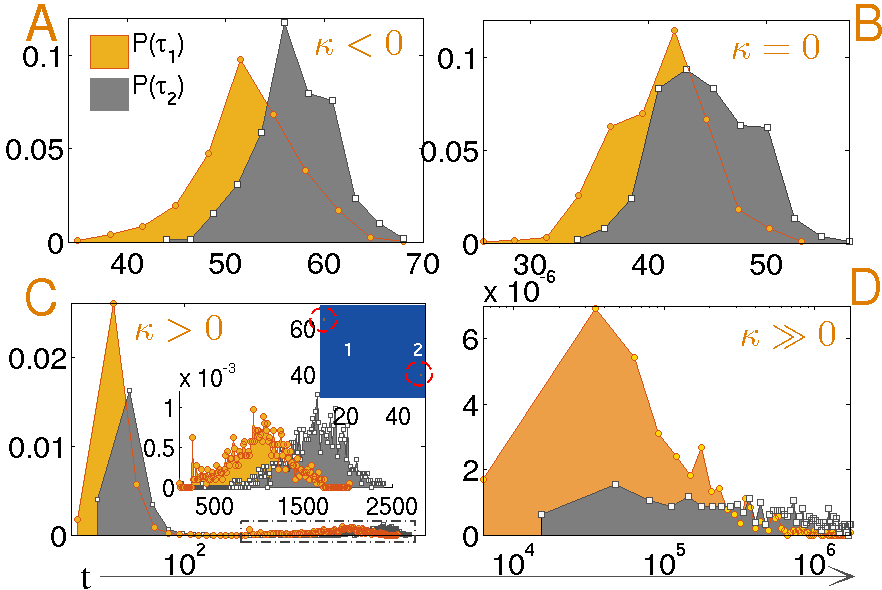
To examine the role of spatial long-ranged interactions in the first passage times of consecutive events, we study the spatiotemporal correlation between the events. Fig.(8) sketches the normalized histograms for different . The distribution is sharply peaked within a small temporal domain for , and the span of the distribution increases by two orders of magnitude with significant broadening as is increased. The first and second events are always correlated due to the long range elastic interaction in the nematic film. The bimodality exhibited by the distributions for is surprising. As seen in the amplified plot in the inset of panel (C), the second peaks are also correlated. The reason for bimodality can be physically understood as the limit in which the size of the regions of fluctuation induced melting becomes less than the critical droplet size. Thus the first peak in the histogram in panel (C) results from the initial formation of subcritical droplets that disappear in time. However, supercritical droplets nucleate at a later stage displayed in the upper inset, with two consecutive events marked as ‘’ and ‘’ that are spatially distant but temporally correlated. This should be compared with the inset of fig.[5(C)], where although events ‘’ and ‘’ are spatially proximate, they are temporally independent. Due to higher surface energy for , a single droplet nucleates and the events in panel (D) are monomodal, but still correlated with a much wider temporal distribution compared to that in the weak anchoring limit, shown in panel (A-C).
Discussion
We have performed an extensive study of homogeneous nucleation kinetics in a freely suspended monolayer of metastable liquid crystalline film using stochastic nematodyamics. In the case of a supercooled film in the metastable isotropic phase, we have shown that the presence of a large surface interfacial anisotropy quantified by a large value of the parameter leads to the appearance of a noncircular droplet of the nematic phase with an encapsulated hyperbolic hedgehog defect and a biaxial interfacial ring as seen in 5CB microdropletsChen et al. (2008). Noncircular droplets exhibit homogeneous orientation of the director field for smaller values of . The growth of the nuclei at small volumes is found to exhibit a polynomial dependence on time. The regime of applicability of classical nucleation theories in the small limit is determined. Also, successive nucleation events are found to be uncorrelated even if they are spatially proximate, due to the absence of long ranged elastic interactions in an isotropic film. On the other hand, a two step growth process is observed in isotropic droplet nucleation in a superheated nematic film. In this case, spatially distant nucleation events are temporally correlated due to the long ranged elastic interactions in the nematic film. These findings are consistent with available results in three spatial dimensionsBhattacharjee (2010), but are markedly different from the results of studies of confined films where coverslips affect the director component in the third directionLansac et al. (1995).
The kinetic pathway of ordering from an unstable isotropic phase to a stable nematic phase through spinodal decomposition and coarsening in a deterministic GLdG framework has been extensively studiedBray (1994); Denniston et al. (2001); Zapotocky et al. (1995); Dutta and Roy (2005); Bhattacharjee et al. (2008); Bhattacharjee (2010) in the past. In this case, the development of diffusive domains and late-stage defect pair kinetics (Porod law regime) take place at a much faster time scale compared to nucleation kinetics. When a nematic film is heated to a temperature above the superheating line, disordered isotropic domain coarsening leads to a stable isotropic stateChen et al. (2008). A comparison of existing results for late-stage domain growth in these cases with those obtained from the stochastic GLdG framework considered here is outside the scope of the present study. Also, electrokineticde Oliveira et al. (2010) and flexoelectric effectsBarbero and Durand (1987) as well as coupling of the orientation tensor to a hydrodynamic flow fieldBeris and Edwards (1994) for a thermal system can be considered in the future. Other choices for describing biaxial orderBerardi and Zannoni (2012) may be explored in future investigations. Experimental verification of the results reported here would be welcome, although avoiding heterogeneous nucleation when sampling rare events in a narrow temperature window is a challenging task.
Methods
Numerical integration of stochastic GLdG equation. A two dimensional monolayer of nematogenic material is considered, where orientation in three Cartesian directions is retained, but spatial variations are restricted to a plain. The Q-tensor equation is solved on a regular square lattice with periodic boundary condition to neglect confinement effects. A direct numerical integration is forbidden as using similarity transformation, any symmetric traceless tensor cannot be diagonalized at every grid point. By utilizing a property that the tensor can be expanded in a basis of five matrices Kaiser et al. (1992), a legitimate way is to project the equations as and , so as to contain the dynamics in the basis coefficients and Bhattacharjee et al. (2010). Major advantage is gained in constructing the symmetrized detraced noise with five , that corresponds to zero mean unit variance independent Gaussian white noise processes. This thus validates discrete FDT spectrum in all Fourier modes and we obtain reasonable agreement in static and dynamic correlations of with analytic formula both in isotropic and nematic phase Bhattacharjee et al. (2010). Eq.(4) in the basis coefficients takes the form
| (8) |
where .
Laplacian and mixed derivatives are spatially discretized as , where denote Cartesian indices. We adopt second order accurate stochastic method of lines (SMOL) integrator for explicit temporal updateWilkie (2004). SMOL semi-discretization scheme develops on discretizing spatial part of partial differential equations to yield ordinary time-dependent equations, which are integrated on unstructured grid maintaining accuracy, stability and computational overload.
The distortion free energy, length and time are resolved by transforming the deterministic part of eq.(4) in non-dimensionalized form to obtain , where and are non-dimensional length, bulk energy, time and surface energy. Dimensional quantities for example, correlation length and relaxation time can be computed as . To avoid numerical artifact, and are strictly maintained. Also is ensured to avoid the medium to attain the stable phase in one computational step.
Cluster labelling procedure. To sample nucleation clusters, we record results on every computational step within a time window within which the cluster eventuates. We apply Hoshen Kopelman (HK76) algorithm Hoshen and Kopelman (1976) to label connected clusters on the grid which are above (below) certain threshold. To identify nematic nuclei, we choose threshold value at of and implement periodicity in both directions to overcome double counting of connected clusters through periodic boundaries. In case of isotropic nucleation, the algorithm performs reversely and we choose the threshold value at of . The algorithm particularly finds usefulness in counting the total number of grid points pertaining to a tagged cluster that temporally amplifies as the cluster swells. Thus a length scale can be simply extracted to quantify growth law, without computing the length scale from direct correlation functionsBhattacharjee et al. (2008) that also captures Porod law scaling of defect annealing kinetics after droplet coalescence.
References
- Fahrenheit (1724) D. Fahrenheit, Phil. Trans. Roy. Soc. 39, 78 (1724).
- Voorhees (1985) P. W. Voorhees, Journal of Statistical Physics 38, 231 (1985).
- Lipton et al. (1984) J. Lipton, M. Glicksman, and W. Kurz, Materials Science and Engineering 65, 57 (1984).
- Cuetos and Dijkstra (2007) A. Cuetos and M. Dijkstra, Phys. Rev. Lett. 98, 095701 (2007).
- Komadina et al. (2015) J. Komadina, S. Watt, I. McEwen, and C. Viney, Crystal Growth & Design 15(6), 2620 (2015).
- Abukhdeir et al. (2008) N. M. Abukhdeir, E. R. Soulé, and A. D. Rey, Langmuir 24, 13605 (2008).
- Bisoyi and Kumar (2011) H. K. Bisoyi and S. Kumar, Chem. Soc. Rev. 40, 306 (2011).
- Aliño et al. (2012) V. J. Aliño, K. X. Tay, S. A. Khan, and K.-L. Yang, Langmuir 28, 14540 (2012).
- Tseng et al. (2014) M.-C. Tseng, C.-Y. Lee, T.-K. Ho, and H.-S. Kwok, SID Symposium Digest of Technical Papers 45, 1435 (2014).
- Zhou et al. (2014) S. Zhou, A. Sokolov, O. D. Lavrentovich, and I. S. Aranson, Proceedings of the National Academy of Sciences 111, 1265 (2014).
- Bernal and Fankuchen (1941) J. D. Bernal and I. Fankuchen, J. Gen. Physiol. 25, 111 (1941).
- Herring (1951) C. Herring, Phys. Rev. 82, 87 (1951).
- Chandrasekhar (1966) S. Chandrasekhar, Molecular Crystals and Liquid Crystals 2, 71 (1966).
- Virga (1994) E. G. Virga, Variational Theories for Liquid Crystals (Chapman and Hall, London, 1994).
- Jamali et al. (2015) V. Jamali, N. Behabtu, B. Senyuk, J. A. Lee, I. I. Smalyukh, P. van der Schoot, and M. Pasquali, Phys. Rev. E 91, 042507 (2015).
- Cuetos et al. (2008) A. Cuetos, R. van Roij, and M. Dijkstra, Soft Matter 4, 757 (2008).
- Armas-Pérez et al. (2015) J. C. Armas-Pérez, A. Londono-Hurtado, O. Guzmán, J. P. Hernández-Ortiz, and J. J. de Pablo, The Journal of Chemical Physics 143, 044107 (2015).
- Bradač et al. (2002) Z. Bradač, S. Kralj, and S. Žumer, Phys. Rev. E 65, 021705 (2002).
- Chen et al. (2008) X. Chen, B. Hamlington, and A. Q. Shen, Langmuir 24, 541 (2008).
- Vanzo et al. (2012) D. Vanzo, M. Ricci, R. Berardi, and C. Zannoni, Soft Matter 8, 11790 (2012).
- Kibble (1976) T. W. B. Kibble, Journal of Physics A: Mathematical and General 9, 1387 (1976).
- Zurek (1996) W. Zurek, Physics Reports 276, 177 (1996).
- Kleman and Lavrentovich (2002) M. Kleman and O. Lavrentovich, Soft Matter Physics: An Introduction (Springer Verlag, New York, 2002).
- de Gennes and Prost (1993) P. G. de Gennes and J. Prost, The Physics of Liquid Crystals, 2nd ed. (Clarendon Press, Oxford, 1993).
- Bhattacharjee et al. (2008) A. K. Bhattacharjee, G. I. Menon, and R. Adhikari, Phys. Rev. E 78, 026707 (2008).
- Chaikin and Lubensky (1995) P. Chaikin and T. Lubensky, Principles of Condensed Matter Physics, 1st ed. (Cambridge University Press, 1995).
- Gramsbergen et al. (1986) E. F. Gramsbergen, L. Longa, and W. H. de Jeu, Physics Reports 135, 195 (1986).
- Schiele and Trimper (1983) K. Schiele and S. Trimper, physica status solidi (b) 118, 267 (1983).
- Wincure and Rey (2006) B. Wincure and A. D. Rey, The Journal of Chemical Physics 124, 244902 (2006).
- Blinov and Chigrinov (1994) L. Blinov and V. Chigrinov, Electrooptic Effects in Liquid Crystal Materials (Springer series on partially ordered systems, New York, 1994).
- Lansac et al. (1995) Y. Lansac, F. Fried, and P. Maïssa, Phys. Rev. E 52, 6227 (1995).
- Sonnet et al. (1995) A. Sonnet, A. Kilian, and S. Hess, Phys. Rev. E 52, 718 (1995).
- Prinsen and van der Schoot (2003) P. Prinsen and P. van der Schoot, Phys. Rev. E 68, 021701 (2003).
- Landau and Lifshitz (1975) L. Landau and E. M. Lifshitz, Theory of Elasticity, 2nd ed. (Pergamon Press, Oxford, 1975).
- Rapini, A. and Papoular, M. (1969) Rapini, A. and Papoular, M., J. Phys. Colloques 30, 54 (1969).
- Wincure and Rey (2007) B. Wincure and A. D. Rey, Continuum Mech. Thermodyn. 19, 37 (2007).
- Stratonovich (1976) R. Stratonovich, Sov.Phys.JETP 70, 1290 (1976).
- Hohenberg and Halperin (1977) P. C. Hohenberg and B. I. Halperin, Rev. Mod. Phys. 49, 435 (1977).
- Bhattacharjee et al. (2010) A. K. Bhattacharjee, G. I. Menon, and R. Adhikari, J. Chem. Phys. 133, 044112 (2010).
- Landau and Lifshitz (1980) L. Landau and E. M. Lifshitz, Statistical Physics, 3rd ed. (Pergamon Press, Oxford, 1980).
- Rayleigh (1899) L. Rayleigh, Scientific Papers, 1st ed. (Cambridge University Press, 1899).
- Becker and Döring (1935) R. Becker and W. Döring, Annalen der Physik (Leipzig) 24, 719 (1935).
- Popa-Nita and Sluckin (1996) V. Popa-Nita and T. Sluckin, J. Phys. II France 6, 873 (1996).
- Avrami (1939) M. Avrami, The Journal of Chemical Physics 7, 1103 (1939).
- Avrami (1940) M. Avrami, The Journal of Chemical Physics 8, 212 (1940).
- Avrami (1941) M. Avrami, The Journal of Chemical Physics 9, 177 (1941).
- de Gennes (1971) P. G. de Gennes, Molecular Crystals and Liquid Crystals 12, 193 (1971).
- Kamil et al. (2009) S. M. Kamil, A. K. Bhattacharjee, R. Adhikari, and G. I. Menon, Phys. Rev. E 80, 041705 (2009).
- Huisman and Fasolino (2007) B. A. H. Huisman and A. Fasolino, Phys. Rev. E 76, 021706 (2007).
- Everts et al. (2016) J. C. Everts, M. T. J. J. M. Punter, S. Samin, P. van der Schoot, and R. van Roij, The Journal of Chemical Physics 144, 194901 (2016).
- Ramaswamy et al. (1996) S. Ramaswamy, R. Nityananda, V. A. Raghunathan, and J. Prost, Molecular Crystals and Liquid Crystals Science and Technology. Section A. Molecular Crystals and Liquid Crystals 288, 175 (1996).
- Bates (2016) M. Bates, “Nematics on curved surfaces – computer simulations of nematic shells,” in Fluids, Colloids and Soft Materials: An Introduction to Soft Matter Physics (John Wiley & Sons, Inc, 2016) pp. 387–402.
- Bhattacharjee (2010) A. K. Bhattacharjee, Inhomogeneous Phenomena in Nematic Liquid Crystals, Ph.D. thesis, Homi Bhabha National Institute, Mumbai (2010).
- Bray (1994) A. J. Bray, Adv. Phys. 43, 357 (1994).
- Denniston et al. (2001) C. Denniston, E. Orlandini, and J. M. Yeomans, Phys. Rev. E 64, 021701 (2001).
- Zapotocky et al. (1995) M. Zapotocky, P. M. Goldbart, and N. Goldenfeld, Phys. Rev. E 51, 1216 (1995).
- Dutta and Roy (2005) S. Dutta and S. K. Roy, Phys. Rev. E 71, 026119 (2005).
- de Oliveira et al. (2010) B. F. de Oliveira, P. P. Avelino, F. Moraes, and J. C. R. E. Oliveira, Phys. Rev. E 82, 041707 (2010).
- Barbero and Durand (1987) G. Barbero and G. Durand, Phys. Rev. A 35, 1294 (1987).
- Beris and Edwards (1994) A. Beris and B. Edwards, Thermodynamics of Flowing Systems (Oxford University Press, Oxford, 1994).
- Berardi and Zannoni (2012) R. Berardi and C. Zannoni, Soft Matter 8, 2017 (2012).
- Kaiser et al. (1992) P. Kaiser, W. Wiese, and S. Hess, J. Non-Equilib. Thermodyn. 17, 153 (1992).
- Wilkie (2004) J. Wilkie, Phys. Rev. E 70, 017701 (2004).
- Hoshen and Kopelman (1976) J. Hoshen and R. Kopelman, Phys. Rev. B 14, 3438 (1976).
Acknowledgements
We thank R. Adhikari for suggesting the problem and thank including him G.I. Menon and C. Dasgupta for a critical reading of the manuscript. We extend thanking D. Frenkel, S. Ramaswamy, S. Dhara, R. Pratibha, V.A. Raghunathan for stimulating discussions, A. Laskar for suggesting HK76 algorithm and reviewers for informative remarks. We acknowledge funding through the DST-INSPIRE program and Matscience Chennai for a short term visit.
Additional information
Supplementary information in conjunction to this article at http://www.nature.com/scientificreports
Competing financial interests: The author declares no competing financial interests.
Supplemental Information
Breakdown of de Gennes ansatz on curved surface interface
In a principal frame, the diagonal components of are written as, . The matrix can be transformed to a fixed frame of reference by rotation with pitch angle and yaw angle to obtain, Inhomogeneities of and are encoded in , whose minimization for different decides stable director anchoring at surface interface.
In absence of thermal fluctuations () for a planar I-N interface along -direction where the director is confined to a plain (), the anisotropic elastic energy takes the form
| (9) | |||||
Thus, free energy is lowered for homeotropic anchoring () for and planar anchoring () for , in par with de Gennes argument de Gennes (1971). However for a curved interface,
| (10) | |||||
which can be further reduced in a quasi two-dimensional geometry by taking . Depending on the sign of and according to the competing values of the gradients in and , the film decides the favoured anchoring. Accounting to thermal fluctuations , director anchoring at the droplet surface interface is not intuitive.
Time-lapse animations & Captions
Animation S1 : Circular nematic droplets for and lower surface energy.
Description: The animation sequentially portrays evolution of (a) & , (b) &
and (c) Schlieren texture in one elastic approximation and for small values of
elastic constant . Nucleation of circular nematic bubbles with uniform director field is
observed, that amplify in size to coalesce with other droplets. Note that many droplets are
formed as in shallow quench, and droplet coalescence resulted into defects of half integer
charge due to lower surface energy. For higher surface energy (or larger ), only few
droplets are nucleated whose coalescence does not generate defects (not shown). Almost no
notable change in and fields is seen in the process. Finally, schlieren
texture depicts the uniformity of director field within the droplets.
Animation S2 : Noncircular nematic droplets with encapsulated hyperbolic hendgehog
defects for and higher surface energy.
Description: The animation sequentially portrays evolution of (a) & , (b) &
and (c) Schlieren texture in strong anchoring limit and for higher . Nucleation of
noncircular nematic bubbles with encapsulated defect is observed, that amplify in size to
coalesce with other droplets. The formation of biaxial ring at the droplet interface with
hyperbolic hedgehog defect structure is also observed in and fields. Finally,
schlieren texture depict the -brush geometry, that persist at very late stage of the
kinetics.
Animation S3 : Double occurance of noncircular isotropic droplets for and
lower surface energy.
Description: The animation sequentially portrays evolution of (a) & and (b) Schlieren
texture in weak anchoring limit and for lower . Almost no notable change in and
field is seen and thus omitted from the animation. Nucleation of noncircular isotropic bubbles
without any defect in the bulk nematic film is observed. Note the double occurance of droplets,
resulting to bimodality in the probability distribution of nucleation events. Nucleated droplets
in later stage amplify in size to coalesce with other droplets and span the system size to form
isotropic phase. Schlieren textures depict the nonuniformity of the director field more
transparently.
Animation S4 : Noncircular isotropic droplets for and higher surface energy.
Description: The animation sequentially portrays evolution of (a) & and (b) Schlieren texture in strong anchoring limit and for higher . Nucleation of noncircular isotropic bubbles is observed that amplify in size to coalesce with other droplets. Schlieren textures support the nonuniformity of director field within the droplets and absence of defects in the nematic environment, as well as in the squeezing nematic domains at the late stage of the kinetics.