Intense Flare-CME Event of the Year 2015: Propagation and Interaction Effects between Sun and Earth’s Orbit
keywords:
Coronal mass ejections, flares, interplanetary scintillation, solar radio burst, solar wind1 Introduction
intro Coronal Mass Ejections (CMEs) are violent explosions in the atmosphere of the Sun that carry massive magnetised plasma (1012 1013 kg) into the interplanetary medium. Their velocities range from 10 to 2000 kms-1. CMEs have been identified as the cause of major geo-magnetic storms and many studies have been made to understand their times of arrival as well as effects at 1 AU. Since CMEs can evolve considerably in speed and shape on their way from the Sun to 1 AU, the propagation effects of the CMEs in interplanetary space become essential in predicting their arrival at 1 AU. However, the relative importance of evolutionary processes can differ from one event to the other and it depends on i) the initial energy of the eruption of the CME, ii) solar-wind conditions along its path of propagation, and iii) the physical characteristics of the CME (e.g. Gosling et al., 1998; Gopalswamy et al., 2001a; Manoharan et al., 2001). Moreover, since a CME phenomenon is three-dimensional and ambient solar wind surrounding the CME propagation is often highly structured in space and time, the CME-driven disturbances in the solar-wind can be more complex. Therefore, for a better understanding of the effects of the propagation of a CME, multi-point observations between Sun and 1 AU are required.
In this article we report the propagation effects of a fast CME associated with the intense X2.7 flare that occurred on 05 May 2015 at N15E75. In determining the speed of a CME, the effects of projection can be crucial. Since the above event originated close to the east limb of the Sun, projection effects may not be significant. In this multi-wavelength analysis, the near-Sun signatures of the eruption have been obtained from the Atmospheric Imaging Array (AIA: Pesnell, W.D., Thompson, B.J., and Chamberlin, P.C., 2012) onboard the Solar Dynamics Observatory (SDO) at 171 Å. The white-light images from the Large Angle Spectroscopic Coronagraph (LASCO: Brueckner, G.E., Howard, R.A., and Koomen, M.J., 1995) onboard the SOlar and Heliospheric Observatory (SOHO), combined with the radio measurements from Hiraiso Radio Spectrograph (HiRAS) and WAVES radio experiment of Wind spacecraft (Bougeret, J.L., Kaiser, M.L., and Kellogg, P.J., 1995) spectra, have been employed to infer the speed and energetics of the CME at heights of 20 R⊙ (where, 1 solar radius (R⊙) = 6.96 105 km). Midway between Sun and 1 AU, the CME-driven disturbances as well as its interaction characteristics with a preceding slow CME have been inferred from interplanetary scintillation observations made with the Ooty Radio Telescope (ORT: Swarup et al., 1971).
2 Observations of AR#2339
obs The current solar cycle seems to be running low in activity in comparison with the recent previous cycles (e.g. Hathway, 2010; Manoharan, 2012). However, a couple of active regions of the current cycle were exceptionally active and produced a large number of flare events and associated CMEs. One such active region, AR2339, became active from its appearance at the east limb of the Sun on 04 May 2015 and continued until it rotated to the back of the Sun on 17 May 2015. It had an overall magnetic configuration of and grew to a fairly large area of 840 millionths on 10 May 2015. AR2339 produced more than 60 X-ray flares of C-class intensity or more, during its passage from east to west limbs of the Sun. It is to be noted that the number of optical flares produced by this active region outnumbered the X-ray events. However, the rate of occurrence of flares gradually declined after its crossing of the central meridian of the Sun. In this study, we consider the near-Sun, interplanetary propagation effects of a fast CME that occurred on 05 May 2015 at this active region as well as its interaction effects in the Sun–1 AU distance.
2.1 X-ray and EUV Observations
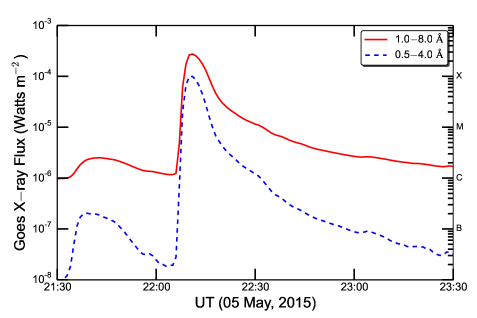
ndo On 05 May 2015, when the AR2339 was located close to the east limb of the Sun at N15E75, the onset of the X2.7-class flare was observed at about 22:05 UT in the wavelength bands of 1–8 Å and 0.5–4 Å by the X-ray Sensor (XRS)111www.ssec.wisc.edu onboard the GOES-15 spacecraft. Figure \irefxray-sdo-co displays the X-ray flux profiles of the flare event during the period 21:30–23:30 UT in the above two wavelength bands. The fluxes in these channels started to rise at 22:07 UT and reached a maximum value within about four minutes and returned to the background value after about two hours. It is also to be noted that the harder part (0.5–4 Å) of the X-ray flux increased by more than about three orders of magnitude in comparison with its mean background value. However, the soft (1–8 Å) X-ray spectrum increased only about two orders with respect to its background. It is likely that the heating at the flare site was efficient to produce the hard part of the X-ray spectrum.
(a)
(b)
(c)
2.1.1 EUV Near-Sun Images
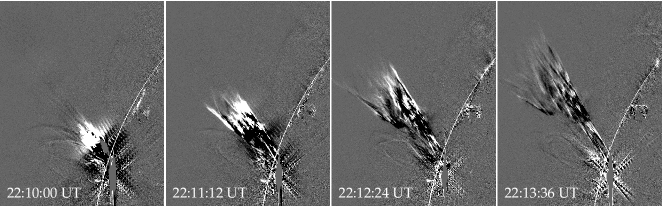
euv AIA recorded the eruption of the CME associated with the X2.7 flare event, in a wideband of extreme ultraviolet (EUV) emission. Before the onset of the X-ray flare, AIA images showed the destabilisation of the filament at the flare site and the eruption of the filament was seen at 22:07 UT. The eruption was also associated with the enhanced emission of X-ray (refer to Figure \irefxray-sdo-co) as well as EUV emission over a band of wavelengths 94–1700 Å. At the rising phase of the flare, the AIA images showed the radial motion of mass and flux rope along the position angle of 50∘. Figure \irefsdo-diff shows the running-difference partial frame images from AIA observed in the 171 Å band. At the time of maximum of the X-ray profile, 22:11 UT, the eruption seen in EUV reached a height of about 1.5 R⊙, with respect to the centre of the Sun. The projected speed of the EUV eruption in the plane of the sky along its propagation direction is 1300 kms-1. Since the location of the CME origin is close to the limb of the Sun, the projection effect is expected to be minimal and the sky-plane speed represents the actual speed of the CME. However, the rate of change of width of the eruption in the direction perpendicular to its radial direction was significantly less and the speed of the lateral expansion was typically 300 kms-1. For example, in the AIA field of view, the angular width of the eruption typically increased from 3∘ to 7∘ in the position angle, which determined the typical lateral expansion. These rates correspond to a radial expansion of about four times faster than the lateral expansion. The above east-limb eruption was also recorded by the Sun Watcher with Active Pixel System detector and Image Processing (SWAP) telescope at 174 Å onboard the Project for On-Board Autonomy-2 spacecraft (PROBA-2: Halain et al., 2013; Seaton et al., 2013). The findings obtained from AIA are consistent with the SWAP measurements. The expansion of the CME and its associated filament eruption could be tracked up to about 1.5 R⊙.
2.1.2 Radio Signatures of the CME
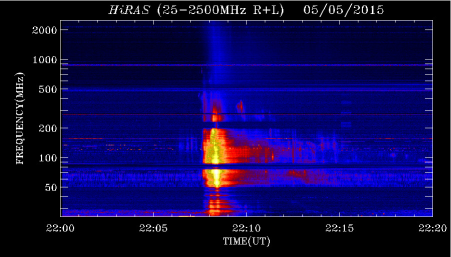
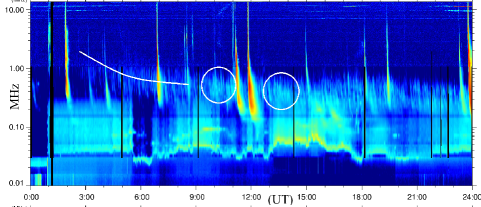
radio The radio signatures associated with the flare/CME event were observed over a wide range of frequencies: i) HiRAS provided the radio manifestations of the CME in a frequency range of 30 to 2500 MHz, and ii) Wind/WAVES covered frequencies below 14 MHz. The above spectra are useful to infer the radio signatures of the CME in the solar-height range of about 0.1 to 30 R⊙. Figure \irefcomb-spec shows the radio spectra observed on 05 and 06 May 2015 by the HiRAS solar radio spectrograph and Wind/WAVES space mission. At the time of the CME onset, 22:07 UT, the opening of bundle of magnetic field lines were revealed by a group of intense Type-III bursts at frequencies below 500 MHz (refer to Figure \irefcomb-speca). The well-organised collimated eruption seen with AIA (refer to Figure \irefsdo-diff) is also consistent with the propagation of the CME along the open-field lines (i.e. magnetic funnel type of structure) formed above the system of loops at the active region. In the HiRAS spectrum (Figure \irefcomb-speca), a broad-band diffused emission was also observed at high frequencies (700–1800 MHz) around 22:07 UT and it is likely associated with the on-going small-scale reconnections at the flare site at low coronal heights.
The fast eruption seen in the AIA EUV images has caused a shock, which is consistent with the intense fast drifting metric Type-II radio burst observed in the frequency range of 50–80 MHz during 22:12:00 to 22:13:30 UT (refer to AIA images in Figure \irefsdo-diff and the HiRAS spectrum shown in Figure \irefcomb-speca). In the above time range, a fast drifting Type-II was also independently observed by the Culgoora Radio Spectrograph in the frequency range of 25–40 MHz. These spectra from Culgoora and HiRAS observatories confirm, respectively, the fundamental and second harmonic emissions of the Type-II burst (e.g. Wild, J.P., Murray, J.D., and Rowe, W.C., 1954). This harmonic emission was also seen weakly in the HiRAS spectrum. The frequency coverage of the Type-II shows the typical height of the shock between 1.6 and 1.8 R⊙, with respect to the centre of the Sun (e.g. Pohjolainen et al., 2007). At these heights, the overall drift rate of the Type-II burst suggests a shock speed of 1500 kms-1. In fact, the shock speed associated with an eruption is always higher than the average speed of the eruption. In the present case, the observed Type-II speed and the radial speed of the eruption seen in the AIA images (as well as from PROBA-2/SWAP images) at nearly similar solar heights are consistent.
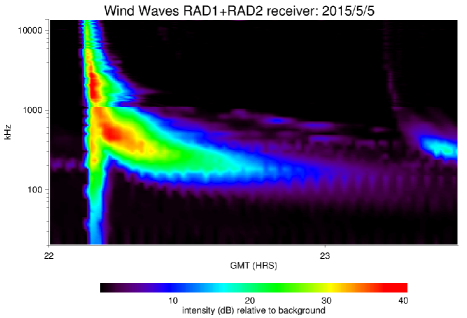
Another important point is that the intense high-frequency Type-III bursts observed in the HiRAS spectrograph, continued to the interplanetary medium as shown by the Wind/WAVES spectrum (Figure \irefcomb-specb), and manifested as an intense long-duration burst, lasting for more than 90 minutes, at frequencies below 1 MHz. This confirms that at the flare site a copious amount of energetic electrons were produced and pumped into interplanetary space (as the flare-associated eruption led to the opening of the magnetic-field lines), which extended to larger heights in the interplanetary medium. Such low-frequency long-duration Type-III radio bursts, when associated with Type-II events have shown statistical association with solar energetic particle (SEP) events (e.g. MacDowall et al., 2003; Gopalswamy and Mäkelä, 2010). Thus, if the origin of the event under study were favourably located with respect to the Earth, a particle event would most probably have been observed at the Earth. Additionally, the Type-II burst signatures were also observed in the low-frequency part of the Wind/WAVES spectrum, at frequencies below 1 MHz (however, the Type-II feature was not visible in the 1–14 MHz part of the spectrum). A broadband drifting feature seen below 1 MHz started at about 02:00 UT (Figure \irefcomb-specc) and by that time the CME had crossed a solar height of 18 R⊙ in the LASCO-C3 field of view. The wide frequency range of Type-III bursts in the near-Sun as well as in the interplanetary medium (including fast Type-II burst) suggests that the CME was involved with a significant high energy (e.g. MacDowall et al., 2003; Gopalswamy and Mäkelä, 2010).
As the CME moved away from the active region (before and after the onset of the Type-II burst), intense continuum emissions were also recorded by both Culgoora and HiRAS spectrographs, in the frequency range of 50–200 MHz. Additionally, within the above continuum, there were several vertical structures. After the end of the Type-II burst, the continuum was observed at frequencies below 70 MHz. However, the intensity of the above radio continuum was much weaker than the Type-III and Type-II radio bursts. The signatures of the broadband continuum at times before the onset of the Type-II burst suggests that the emission originating from the system of rising loops resulted at the time of the CME eruption. The weak low-frequency continuum emission during the Type-II and up to 22:15 UT is likely to be associated with the expansion of the filament and the energetic electrons trapped within the propagating CME structure (e.g. Gosling et al., 1998; Manoharan and Kundu, 2003).
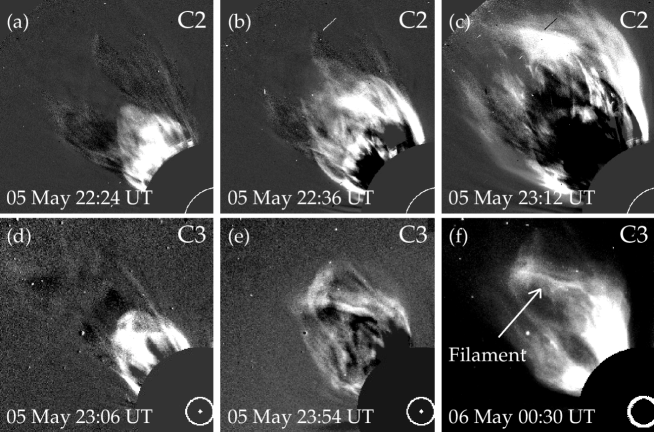
2.2 LASCO White-Light Images and CME Speed
lasco The onset of the fast moving CME was observed at 22:24 UT in the LASCO-C2 field of view at 4.3 R⊙. Figure \ireflasco-diff shows the sequence of running difference white-light images from C2 and C3 coronagraphs of LASCO. In these “position angle-distance” images, the radial evolution of the propagating CME is evidently seen in C2 (Figure \ireflasco-diffa,c) and C3 (Figure \ireflasco-diffd,f) fields of view and the bright embedded filament structure can also be clearly identified (in Figure \ireflasco-difff). Moreover, as observed in Figure \ireflasco-diffa, when the CME onset occurred in the C2 coronagraph, the lateral width of the CME (i.e. in the perpendicular orientation to that of the propagation direction along the position angle of 50∘) was more than 2 R⊙. This reveals that the overall size of the CME has gone through a rather rapid expansion and also CME has been accelerated between AIA and LASCO fields of view. The rate of lateral expansion of the CME corresponds to a speed of 900 kms-1. It is likely that the CME material, the ejecta as well as the magnetic field, have gone through the process of pressure balance with the surrounding solar-wind. For example, a CME can expand, if it is ejected from the Sun with a speed higher than the ambient solar-wind causing a speed gradient. The ambient solar-wind estimates, obtained from the interplanetary scintillation measurements made with the ORT at a distance mid way between the Sun and Earth and from the in-situ data at 1 AU, indicate a low-speed heliosphere of about 300–350 kms-1 in the space ahead of the CME. It is likely that in order to maintain the pressure balance between the CME and the ambient solar-wind, the CME has gone through the sudden expansion.
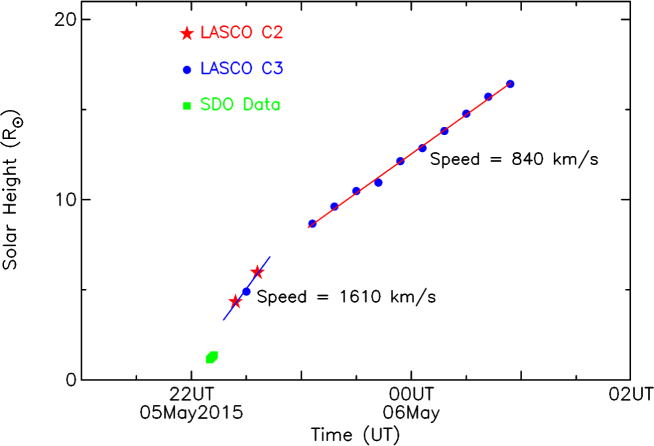
The quick acceleration of the CME along its radial direction has also been shown by the height–time plot obtained from the AIA EUV and LASCO white-light images. Figure \ireflasco-ht-plot shows the height–time plot of the CME and its derived speeds in the LASCO field of view. The height–time plot has been restricted to C2/C3 white-light images having good contrast and the low signal-to-noise ratio images are not considered. This plot also includes the height–time measurements obtained from the AIA images observed at 171 Å. An important point revealed in this plot is that when the initial three measurements of the LASCO images are considered (i.e. two images from C2 and one image from C3 coronagraphs), the speed of the CME is rather high, around 1600 kms-1. As stated earlier, since the originating location of the CME on the Sun is close to the east limb, the projection effect on the speed estimate obtained from the plane of sky images is expected to be less significant. The speed obtained from the initial images of LASCO is consistent with the speed of the shock (1500 kms-1) estimated from the Type-II radio burst at distances between AIA and LASCO fields of view (refer to Section \irefradio). In fact, the CME has thus gone through a steady acceleration in the near-Sun region between 1.5 and 6 R⊙ (Figure 5). At greater heights between 8 and 20 R⊙ in the C3 field of view, the speed of the CME however remained nearly constant at about 840 kms-1, which was also well above the ambient solar-wind speed.
3 CME–CME Interaction and Interplanetary Scintillation Measurements
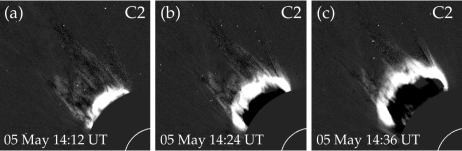
cme-cme-int On 05 May 2015, the active region, AR2339, also produced another intense X-ray flare of intensity M1.2, which peaked at 13:53 UT in the 1–8 Å channel of the GOES-15 spacecraft. This event also originated at N15E75. However, the X-ray profile reveals it to be a short-duration event. The onset of the CME associated with this flare event was observed at 14:12 UT in the C2 field of view of LASCO (Figure \irefint-cme) and its width was 70∘. It also propagated along the position angle of 50∘ and produced Type-III and Type-II radio bursts. However, the radio signatures were much less intense than that of the above later CME and the Type-III burst did not cause a long-duration event. The speed of the Type-II shock associated with the CME was 1000 kms-1. However, the speed of the CME in the LASCO C2/C3 fields of view was low at 350 kms-1. This CME preceded the above discussed later CME at 22:24 UT (Figure \ireflasco-diff). Since the speed of the later CME was more than twice the speed of the preceding CME, in the course of time the later one interacted with it at 50–75 R⊙ at about 08:00 to 10:00 UT. The interaction characteristics are weakly shown by the low-frequency radio spectrum (1 MHz part; indicated by white circles in Figure \irefcomb-specc) in the time span of 10:00 to 14:00 UT (cf. Gopalswamy et al., 2001b; Lahkar et al., 2010). The interplanetary scintillation observations at the ORT show the turbulence and speed associated with the interaction phenomenon in the inner heliosphere, at distances outside the LASCO field of view.
3.1 Interplanetary Scintillation Observations of CMEs
ips-obs In this study, interplanetary scintillation (IPS) measurements, obtained from the ORT at 327 MHz, have been employed to investigate the view of the ambient solar-wind (e.g. Manoharan, 2012) and the three-dimensional evolution of the CME in the inner heliosphere (e.g. Manoharan et al., 2001; Manoharan, 2006). At the ORT, everyday routine monitoring of IPS is made on a large number of compact radio sources and the measurement on each source yields the estimates of solar-wind speed and normalised scintillation index (g-value) at a point closest to the solar approach of the line-of-sight to the source (e.g. Manoharan and Ananthakrishnan, 1990; Manoharan, 2006). The normalised index (g-value) represents the turbulence level of the solar-wind (). At Ooty, on 06 May 2015, two scans of the sky were observed (Figure \irefvel-gval), in a distance range of 40 to 250 R⊙. Each scan included a number of sources. The IPS observation on each source represents the line-of-sight integration and a computer-aided tomographic reconstruction of IPS measurements from a large number of lines-of-sight would be useful to remove the effect of integration (e.g. Jackson et al., 1997; Manoharan, 2010; Jackson et al., 2015). However, in this study, we use the raw IPS data to analyse the propagation effects of the CME and CME–CME interaction in the inner heliosphere.
3.1.1 IPS Images of CME
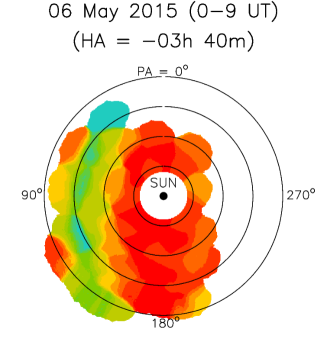
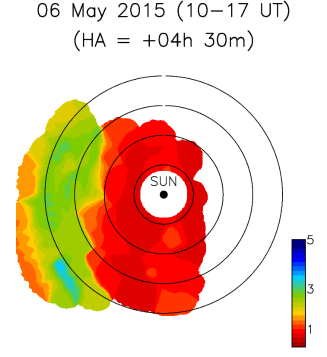
ips-image Figure \irefips-plot shows the snapshot scintillation images (g-maps) of the interplanetary medium on 06 May 2015, respectively, during 00:00–09:00 UT and 10:00–17:00 UT. As indicated in each of the above images, the IPS measurements have been made while the ORT was pointed, respectively, at hour angle (HA) positions of -03h 40m and +04h 30m. Normally at the ORT, to start with, we scan the interplanetary medium at a suitable position and then the ORT is moved ahead to point at a similar part of the heliosphere. Such observing scans provide the solar-wind measurements at similar parts of the heliosphere and can enable one to track interplanetary disturbances (e.g. CMEs), if present, as well as change in the solar-wind conditions. In fact, more than one scan will be useful to track the propagation characteristics of the disturbance. For example when the telescope was positioned at the HA = -03h 40m, at the start of the scan it probed sources at 100∘ solar elongation on the west side of the Sun. It is to be noted that since the hour angle of the ORT is fixed, a radio source is observed for about two minutes at the time of its transit at the telescope. In the subsequent time, the electronic beam switching of the 12-beam system of the ORT allows observing sources at different declinations and enables to probe different parts of inner heliosphere (refer to Swarup et al., 1971; Manoharan et al., 2000). As the time progresses, the direction of the probing region moves gradually close to the Sun and then to the portion of the heliosphere in the east side to the Sun (also refer to Figure \irefvel-gval). The high sensitivity of the ORT and its beam-forming system enable the observation of a large part of the heliosphere in about six hours of observing time. In the present case, we moved the ORT by 8h 10m in hour angle to the west (i.e. HA = +04h 30m) and probed the heliosphere region from the west of the Sun to the east (Figure \irefips-plot, right panel).
The above images cover 500 500 pixels and they are smoothed by a Gaussian of width 5 5 pixels. They are equivalent to the white-light images in the sky plane projection and are useful to follow the three-dimensional evolution of the ambient solar-wind as well as the turbulent regions associated with the propagating disturbances in the IPS field of view of 40–250 R⊙. In these images, g-values close to unity correspond to the ambient level of density turbulence of the solar-wind and it is represented by the red colour code, i.e. g1. In contrast, the enhanced or depleted level of density turbulence is indicated by, respectively, g-value 1 or 1. In the above images, the concentric circles are of radii 50, 100, 150, and 200 R⊙.
In these “position angle(PA)-heliocentric distance” images, the north is at the top, i.e. PA = 0∘. The PAs, 90∘, 180∘, and 270∘, respectively, correspond to east, south, and west of the Sun (Figure \irefips-plot, left panel). The enhanced scintillation indicates the presence of an interplanetary CME. For example, on the 06 May IPS image, the onset of the CME in the IPS field of view is seen between 50 and 100 R⊙ and it corresponds to a time period of 04:00–06:00 UT (refer to Figure \irefvel-gval, which shows the time-series of estimates of solar-wind speed and g-value). It is noted that the disturbance associated with the CME has expanded considerably in the IPS field of view and the comparison between these images clearly shows the propagation of the CME in the eastern direction with respect to the Sun. The time-series analysis of the Ooty observations reveals a better understanding of the CME propagation as well as interaction between the above discussed CMEs.
3.1.2 IPS Time Series
ips-time Time series of speed and g-value estimates obtained from the Ooty IPS measurements on 06 May 2015 are shown in Figure \irefvel-gval, which includes two scans of observations, respectively, 00:00–09:00 UT and 10:00–17:00 UT. Each point on the plot represents the observation from a scintillating radio source. As discussed in the previous section, the above two scans were observed, respectively, at hour angles -03h 40m and +04h 30m. In each scan, to start with the western heliospheric region with respect to the Sun is probed and as the time progressed, the probing direction moves close to the Sun and later to the east of the Sun. On each scan of the “distance–time” plot (top panel in Figure \irefvel-gval), the heliocentric distance of an observed source is plotted with an open circle symbol and the typical separation between the west and east sides of the heliosphere probed with respect to Sun is shown by a vertical dotted line. This plot also includes the average heliocentric distance covered over an observing time of 20 minutes and are shown by open-triangle and filled-triangle symbols respectively.
In Figure \irefvel-gval, the dashed lines on the speed and g-value plots respectively indicate the background solar-wind speed of 300 kms-1 and turbulence level of g1. The estimation of the g-value can be obtained from most of the scintillating radio sources and the g-plot includes observations of about 325 radio sources, covering a wide range of distances in the heliosphere. In contrast, the speed estimate from an IPS observation is limited to a temporal spectrum of high signal-to-noise (i.e. S/N 15 dB) and the speed plot has been made from 200 data points of significantly high signal-to-noise ratio observations.
In Figure \irefvel-gval, at the eastern side of the Sun, the heliocentric distance increases with the observing time. The first scan, observed during 00:00–09:00 UT, shows the following solar-wind conditions: i) the ambient/background solar-wind is probed before the onset of the CME(s) in the IPS field of view; ii) after the onset of the CME in the IPS field of view, most of the lines of sight of the radio sources pass through different parts of the propagating CME structure and their g-values provide the typical size of the interplanetary CME structure; iii) only a few radio sources point outside the CME structure and their g-values lie close to the background line; iv) at the onset time of the CME, the lines of sight pass through the CME structure in the distance range of 50 and 100 R⊙, which is observed as a gradual rise in g-value in the time period of 04:00–07:00 UT; v) timings and distances involved in these observations also indicate that the CME is propelled fast at speed 800 kms-1; vi) however, the turbulence level associated with it is less than that observed at 08:00 UT; vii) at distances 100 R⊙ (i.e. at times 06:00 to 09:00 UT), the solar-wind region between CMEs, and the preceding CME are probed; viii) around 08:00 UT, the speed plot indicates the low speed associated with the preceding CME.
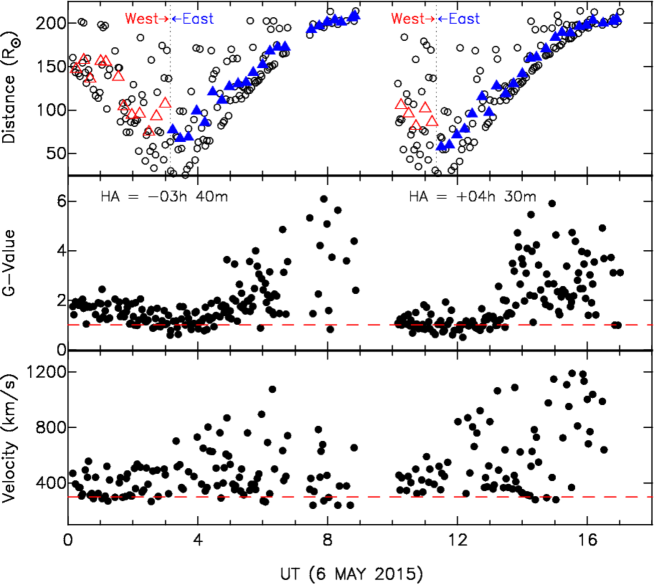
As indicated by the speeds of these CMEs in the LASCO field of view as well as by radio signatures, the CME–CME interaction is likely to happen around 08:00–10:00 UT, at a height of about 50–75 R⊙. The second IPS scan of the interplanetary medium pictures the status of the solar-wind just after the interaction. The condition of the solar-wind after the interaction of CMEs is, i) the overall turbulence level is high, ii) the average speed of the solar-wind is well above the background solar-wind, iii) as shown by the IPS images, the intense part of the turbulence is wide and it includes both the CMEs. In the second scan, the high speed points are also observed before the peaking of g-values, i.e. behind the CMEs.
Another important point to be noted is that as revealed by the IPS observations, the CME before and after interaction has travelled well above the speed of the background solar-wind. In fact, the effective drag force experienced by a CME is largely determined by the difference in speeds between the CME and the ambient solar-wind and it is proportional to VCME - Vambient2 (Manoharan, 2006). In the present case, the speed of the CME is 800 kms-1, which would have suffered the reduction of speed due to the interaction of the CME with the ambient solar-wind of speed 300–350 kms-1. Since the CME seems to continue to propagate at a speed higher than the ambient solar-wind, it is possible that the internal magnetic energy associated with the filament (or flux rope) supports to propel the CME structure out into the solar-wind (e.g. Chen et al., 1997; Manoharan and Mujiber Rahman, 2011).
4 Discussion and Summary
disc-sum
The propagation effects of the (X2.7 related) fast CME of 05 May 2015 have been analysed using a combination of data from EUV, radio, white-light, and IPS observations in the Sun to 1-AU distance range. The filament oscillation is first seen in the AIA 171 Å images at 22:05 UT, just prior to the onset of the eruption. The fast eruption of filament is observed with a velocity of 1300 kms-1 in the time range of 22:10–22:14 UT at heights below 1.5 R⊙ and in this period, the rate of expansion of the CME in the lateral direction (i.e. perpendicular to the direction of propagation) is confined and it is much smaller than the eruption speed. The intense Type-III radio burst, along the open field lines above the eruption site, extends from the low corona (i.e. at frequency 500 MHz) all the way into the interplanetary medium (frequency 100 kHz) and it suggests the possible acceleration of particle by post-CME reconnection (e.g. McKenzie and Hudson, 2001; Sheeley, N.R., Jr., Warren, H.P., and Wang, Y.M., 2004).
The speed of the CME-driven disturbances, from the white-light images and the shock shown by the metric Type-II bursts, increases with height, peaking at 1600 kms-1 at a solar-height of 6 R⊙ and then the speed stabilises at 840 kms-1 at greater heights. The LASCO images show the quick expansion of the filament enclosed within the CME structure. This suggests that the CME expands to maintain the pressure balance with the low-speed ambient solar-wind (e.g. Manoharan et al., 2000).
The interplanetary-scintillation observations show the large-scale propagation of the CME through the interplanetary medium, its expanding structure and distribution in the inner heliosphere. Even at heliocentric distances 60 R⊙, the CME-driven disturbances move with speed in excess of 800 kms-1, which shows that the effective drag imposed by the low-speed background solar-wind seems to be ineffective. It is likely that the internal magnetic energy in the filament aids the expansion and propagation (e.g. Moore and Roumeliotis, 1992; Chen et al., 1997; Démoulin, 1998). The density depletion caused by a preceding CME could also aid the propagation of the later CME. However, in the present case, the prior CME could have started with a high initial speed, and in the LASCO field of view it likely slowed to a speed close to the ambient solar-wind speed.
The IPS observations on a large number of sources allow us to look at the interaction between the fast CME and a slow-moving preceding CME, at the heliocentric-distance range of 50–75 R⊙. It has been shown that the interaction between CMEs leads to slowing down of the fast CME (e.g. Manoharan et al., 2004). As the result of interaction, the turbulence level contributed by both the CMEs has increased significantly. Since at these heliocentric distances, the level of turbulence is related to of the solar-wind, the density within the merged or interacted region is also expected to increase considerable. Although it is not straightforward to infer the factor of increase of the solar-wind density, it is inferred that the combined effect of the CME structure and propagation characteristics at further large distances would considerably alter the arrival of the fast CME at 1 AU.
Acknowledgements
We thank the observing and engineering staff of the Radio Astronomy Centre (RAC) for help in making the IPS observations. The RAC is run by the National Centre for Radio Astrophysics of the Tata Institute of Fundamental Research. We acknowledge the LASCO images from the SOHO mission, which is a project of international cooperation between ESA and NASA. The authors also thank Solar Dynamics Observatory (SDO) for providing the high resolution EUV images. We acknowledge the teams of GOES spacecraft, ISTP Wind/WAVES and Hiraiso Radio Spectrograph (HiRAS222hirweb.nict.go.jp). We are thankful to the World Data Centre (WDC) of Space Weather Services, Bureau of Meteorology of Australia for the analysis of Culgoora333www.sws.bom.gov.au/Solar/ data. PROBA-2/SWAP is a project of the Centre Spatial de Liege and the Royal Observatory of Belgium funded by the Belgian Federal Science Policy Office (BELSPO). We also like to thank MA Krishnakumar for reading the manuscript. We thank the referee for the useful comments.
Disclosure
Abhishek Johri and P.K. Manoharan do not have any conflicts of interest.
References
- Bougeret et al. (1995) Bougeret, J.L., Kaiser, M.L., Kellogg, P.J., 1995, Space Sci. Rev.71, 231.
- Brueckner et al. (1995) Brueckner, G.E., Howard, R.A., Koomen, M.J., 1995, Sol. Phys.162, 357.
- e.g. Chen et al. (1997) Chen, J., In Coronal Mass Ejections, Crooker, N., Joselyn, J., Feynman, J., editors, Washington D.C.: AGU. 1997, pp 65-79.
- Chen et al. (1997) Chen, J., Howard, R.A., Brueckner, G.E., 1997, ApJ490, L191.
- Démoulin (1998) Démoulin, P. 1998, IAU Colloq. 167: New Perspectives on Solar Prominences. 150, 78.
- Gopalswamy et al. (2001a) Gopalswamy, N., Lara, A., Yashiro, S., Kaiser, M.L., Howard, R.A. 2001a, J. Geophys. Res.106, 29207.
- Gopalswamy and Mäkelä (2010) Gopalswamy, N., Mäkelä, P. 2010, ApJ721, L62.
- cf. Gopalswamy et al. (2001b) Gopalswamy, N., Yashiro, S., Kaiser, M.L., Howard, R.A., Bougeret, J.L. 2001b, ApJ548, L91.
- e.g. Gosling et al. (1998) Gosling, J.T., Riley, P., McComas, D.J., Pizzo, V.J. 1998, J. Geophys. Res.103, 1941.
- Halain et al. (2013) Halain, J.P., Berghmans, D., Seaton, D.B., 2013, Sol. Phys.286, 67.
- e.g. Hathaway (2010) Hathaway, D.H. 2010, Living Rev. Solar Phys.7, 1.
- e.g. Jackson et al. (1997) Jackson, B.V., Hick, P.L., Kojima, M., Yokobe, A. 1997, Physics and Chemistry of the Earth. 22, 425.
- Jackson et al. (2015) Jackson, B.V., Odstrcil, D., Yu, H.S., 2015, Space Weather. 13, 104.
- Lahkar et al. (2010) Lahkar, M., Manoharan, P.K., Mahalakshmi, K., 2010, Magnetic Coupling between the Interior and Atmosphere of the Sun. 489.
- e.g. MacDowall et al. (2003) MacDowall, R.J., Lara, A., Manoharan, P.K., 2003, Geophys. Res. Lett.30, 8018.
- Manoharan (2006) Manoharan, P.K. 2006, Sol. Phys.235, 345.
- Manoharan (2010) Manoharan, P.K. 2010, Sol. Phys.265, 137.
- Manoharan (2012) Manoharan, P.K. 2012, ApJ751, 128.
- e.g. Manoharan and Ananthakrishnan (1990) Manoharan, P.K., Ananthakrishnan, S. 1990, MNRAS. 244, 691.
- Manoharan and Kundu (2003) Manoharan, P.K., Kundu, M.R. 2003, ApJ592, 597.
- Manoharan and Mujiber Rahman (2011) Manoharan, P.K., Mujiber Rahman, A. 2011, J. Atmos. Solar-Terr. Phys.73, 671.
- e.g. Manoharan et al. (2000) Manoharan, P.K., Kojima, M., Gopalswamy, N., Kondo, T., Smith, Z. 2000, ApJ530, 1061.
- e.g. Manoharan et al. (2001) Manoharan, P.K., Tokumaru, M., Pick, M., 2001, ApJ559, 1180.
- e.g. Manoharan et al. (2004) Manoharan, P.K., Gopalswamy, N., Yashiro, S., 2004, J. Geophys. Res.(Space Physics). 109, A06109.
- e.g. McKenzie and Hudson (2001) McKenzie, D.E., Hudson, H.S. 2001, Earth, Planets, and Space. 53, 577.
- e.g. Moore and Roumeliotis (1992) Moore, R.L., Roumeliotis, G. 1992, IAU Colloq. 133: Eruptive Solar Flares. 399, 69.
- Pesnell et al. (2012) Pesnell, W.D., Thompson, B.J., Chamberlin, P.C. 2012, Sol. Phys.275, 3.
- e.g. Pohjolainen et al. (2007) Pohjolainen, S., van Driel-Gesztelyi, L., Culhane, J.L., Manoharan, P.K., Elliott, H.A. 2007, Sol. Phys.244, 167.
- Seaton et al. (2013) Seaton, D.B., Berghmans, D., Nicula, B., 2013, Sol. Phys.286, 43.
- Sheeley, N.R., Jr., Warren, H.P., and Wang, Y.M. (2004) Sheeley, N.R., Jr., Warren, H.P., Wang, Y.M. 2004, ApJ. 616, 1224.
- for description of ORT refer to Swarup et al. (1971) Swarup, G., Sarma, N.V.G., Joshi, M.N., 1971, Nature Phys. Sci.230, 185.
- e.g. Wild et al. (1954) Wild, J.P., Murray, J.D., Rowe, W.C. 1954, Aust J Phys7, 439.