Rising temperatures increased recruitment of brown tiger prawn (Penaeus esculentus) in Moreton Bay (Australia)
Abstract
Abiotic factors are fundamental drivers of the dynamics of wild marine fish populations. Identifying and quantifying their influence on species targeted by the fishing industry is difficult and very important for managing fisheries in a changing climate. Using multiple regression, we investigated the influence of both temperature and rainfall on the variability of recruitment of a tropical species, the brown tiger prawn (Penaeus esculentus), in Moreton Bay which is located near the southern limit of its distribution on the east coast of Australia. A step-wise selection between 51 environmental variables identified that variations in recruitment from 1990 to 2014 were best explained by a combination of temperature and spawning stock biomass. Temperature explains 35% of recruitment variability and spawning stock biomass 33%. This analysis suggests that increasing temperatures have increased recruitment of brown tiger prawn in Moreton Bay.
1 Introduction
There is little doubt in the minds of fishermen and scientists alike that environmental conditions shape the productivity of marine fisheries. Similarly to terrestrial ecosystems where temperature and rainfall are key factors influencing the distribution and productivity of living organisms, marine ecosystems also change in response to climate (Lehodey et al., 2006; Cheung et al., 2013). This is exemplified by the relationship between anchovy production along the Peruvian/Chilean coast and the El Niño Southern Oscillation. Identifying such ecological dependencies is expected to improve our understanding of marine ecological processes, ability to manage the exploitation of natural resources and further our capacity to adapt to climate change. The productivity of marine waters off Australia is generally low (Haddon, 2007). A number of physical factors contribute to low concentrations of nutrients including low run-off from rivers carrying sediments from a remarkably dry continent; coastal currents flowing south from nutrient-poor northern tropical waters and lack of permanent up-welling that would recirculate nutrients. Australia is as much a desert at sea as it is on land (Kailola et al., 1993). Coastal fisheries concentrate around estuaries that provide habitats for a diverse range of species (Blaber, 2000). Their productivity depends on the quality and extent of habitats for new recruits (Loneragan et al., 2013); freshwater input driven by rainfall variations (Loneragan and Bunn, 1999) and optimal temperatures (Caputi et al., 2014).
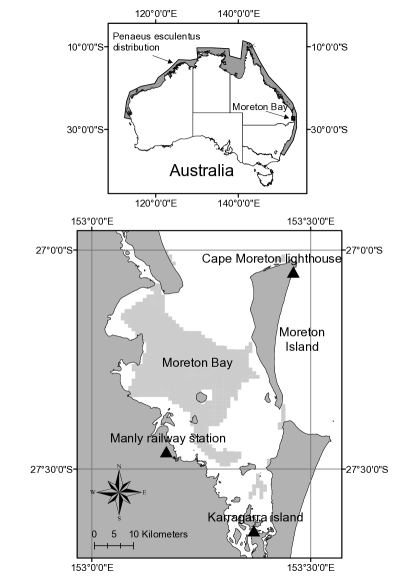
Moreton Bay is a large estuary–fed bay in south-east Queensland, Australia (Fig. 1). This shallow body of water has an average depth of 6.8 m and presents a gradient of salinity from brackish water in the west to oceanic in the east influenced by freshwater discharge from rivers (Young, 1978). Sea water temperature in Moreton Bay varies throughout the year between 11.2 and 32.2 oC: it cools/warms faster in winter/summer than the adjacent portion of ocean (Kienzle et al., 2016). Moreton Bay’s semi-tropical maritime climate is characterized by a wet season between October and May with an average 1500–1600 mm of rain per year (Davie et al., 2011). Several commercial fisheries operate in the Moreton Bay (Parke, 2013) including a fleet of prawn trawlers catching at least five species of prawn (greasyback, Metapenaeus bennettae; eastern king, Melicertus plebejus; brown tiger, Penaeus esculentus; endeavour, Metapenaeus endeavouri and banana prawns, Fenneropenaeus merguiensis). This fishery is the southernmost prawn fishery catching brown tiger prawn on the east coast of Australia. This species of prawn is tropical and is found in Moreton Bay close to the southern limit of its geographical distribution (Fig. 1). Cool water is probably the major physical factor limiting the production of P. esculentus in South Queensland where high production of prawns is limited to a period of about 4 months per year when the mean temperature is above 25oC and growth rates exceed 1 mm of carapace length per week (O’Brien, 1994b). Adult tiger prawn burrow into the sediment during the day and swim near the bottom at night for a duration controlled by water temperature (Hill, 1985), probably in response to higher metabolic rates, speeding up digestion and inducing these poikilotherms to search for food more frequently in warmer water. Catch rates are strongly correlated with water temperature (Kienzle et al., 2014; Courtney et al., 2012). The annual production of prawn fisheries depends almost entirely on the annual recruitment to the fishery (García and Le Reste, 1981). There are sufficient indications to show that their annual production varies from year to year in relation to large scale climate factors (García and Le Reste, 1981). Penn and Caputi (1986) suggested that heavy rainfall events from cyclones have the potential to both increase and decrease recruit survival depending upon their timing. Sea surface temperatures during the pre-recruitment period were found to have a positive effect on the tiger prawn recruitment to the Shark Bay prawn fishery (Western Australia) but not in the Exmouth Gulf fishery, 400 km north (Caputi et al., 2014). In the Exmouth Gulf, warmer temperatures preceding the spawning season were found to have a detrimental effect on recruitment the year after.
As virtually all management advice regarding marine fisheries exploitation are based on single-species stock assessments (Skern-Mauritzen et al., 2015), these models are a logical place to integrate environmental factors affecting production and translate this knowledge into management decisions that account for ecological processes. In practice, only a small number of stock assessments use environmental variables to predict recruitment (e.g. Ulltang (1996); Myers (1998); Lehodey et al. (2008)) because it has proven difficult to identify reliable relationships between environmental variables and fisheries production. Robins et al. (2005) report that many researchers use correlations or regressions of varying complexity to establish empirical relationships between environmental variables and fisheries catch or catch-rates, yet ignore the fundamental processes that govern fisheries dynamics. As a consequence, these analyses often failed to withstand the test of time because of confounding factors that were not accounted for (Myers, 1998; Deyle et al., 2013). In recent years, the stock assessment of brown tiger prawn in Moreton Bay was improved substantially by including ecological processes into the population dynamic model in the shape of a temperature-induced physiological change in catchability (Kienzle et al., 2014) and variable recruitment-timing (Kienzle et al., 2016). Following these steps towards developing an ecological approach to brown tiger prawn stock assessment in Moreton Bay, recruitment was the component of the population dynamic model left with the largest amount of un-explained variability. Fitting the Ricker stock-recruitment relationship (SRR) had found no significant effect of spawning stock biomass (SSB) on recruitment variability despite large variations of SSB over its recorded history (Kienzle et al., 2014) which should have provided, according to Walters and Martell (2004), a very good fishery dataset to study recruitment. Hence, this study investigated the effect of climate data on recruitment variability to understand which variable(s) and which weather station(s) provided data that best explained the observed variation of brown tiger prawn recruitment in Moreton Bay between 1990 and 2014.
2 Materials and methods
2.1 Climate data
Moreton Bay covers a 1500 km2 area between Queensland’s coast and Moreton Island. This stretch of ocean is not covered by global oceanic databases. Therefore a proxy for water temperature was used given that a linear relationship exists () between daily water temperature at the bottom of Moreton Bay and maximum daily air temperature recorded at Cape Moreton lighthouse (CM) by the Bureau Of Meteorology (Australian Bureau of
Meteorology, ). The slope of this relationship was estimated to equal (Kienzle et al., 2016). The Bureau Of Meteorology (BOM) has an array of weather stations scattered across Australia that record atmospheric conditions. Of all the stations in the vicinity of Moreton Bay, only Cape Moreton lighthouse had temperature records overlapping with the fishery data analyzed (1990–2014). Rainfall data were available from several stations and those from Manly railway station (MR) and Karragarra Island (KI) were used in this analysis (Fig. 1).
Total rainfall (mm) and daily maximum air temperature (oC) averaged over each month were aggregated into variables covering longer periods of time (spring, summer, autumn, August–February or January–June) corresponding to specific periods of the biological cycles of brown tiger prawn (reproductive, growth and fishing season (Courtney and Masel, 1997)). These environmental variables were associated with the brown tiger prawn biological year, defined as starting around 1st July and finishing 12 months later around 30th June. Biological years were numbered according to the year that included the main fishing season (Feb. – May). A total of 51 variables representing rainfall and temperature measurements at three different weather stations were investigated (Tab. 1).
2.2 Recruitment and spawning stock biomass estimates
Recruitment to the fishery () used in this analysis was estimated by fitting a Deriso-Schnute delay-difference model to catches of brown tiger prawn in Moreton Bay between 1990 and 2014 (Kienzle et al., 2014). This delay-difference model assumed constant growth, constant natural mortality, knife-edge gear selectivity and targeted/non-targeted catchabilities. Seasonal variations of catchabilities induced by temperature through an eco-physiological response of tiger prawn were accounted for in the stock assessment model using a sigmoid function (Kienzle et al., 2016) to represent variations of the duration of emergence of brown tiger prawn at different temperatures (Hill, 1985). The stock assessment model that best fitted brown tiger prawn catches in Moreton Bay between 1990 and 2014 was used to estimate the magnitude of yearly recruitment to the fishery, providing 25 estimates of recruitment (Fig. 2).
Spawning stock biomasses () were calculated using the delay difference model’s estimates of biomass by applying the weekly proportion of mature females obtained from scientific surveys (Courtney and Masel, 1997), assuming an even sex-ratio.
2.3 Stock–recruitment relationship
The Ricker stock-recruitment function
| (1) |
was used to represent the relationship between spawning stock biomass () in a given year and recruitment () in the following year. The steepness of the Ricker function at the origin is given by the derivative of the function evaluated at
| (2) |
The steepness () measures the productivity of the stock. When estimated for two different environmental conditions, its ratio () quantifies the improvement/decline in productivity associated with the difference in environmental conditions, all other things being equal.
Parameters and were estimated using linear regression on log-transformed data (Hilborn and Walters, 1992)
| (3) |
This model was fitted with the linear regression function in R (R Core Team, 2015), using as an offset. Environmental variables were added successively to the simplest Ricker SRR model to assess the fit of all possible multiple regressions. The best multiple regression model was identified by step-wise selection, both forward and backward, using Akaike’s Information Criterion (AIC) implemented in the function stepAIC available from the MASS package (Venables and Ripley, 2003).
3 Results
3.1 Characteristics of the climate data
Average maximum air temperatures in the region surrounding Moreton Bay have been trending upward over the last 35 years (Fig. 3) peaking in 2006 and 2010 and slightly declining thereafter. Air temperature increased, in average, 0.180 0.014 oC per decade between 1980 and 2015. A greater increase in air temperature was observed during the period overlapping with the tiger prawn stock assessment data (1990–2014), with an average difference of 1oC in air temperature measured at Cape Moreton between 1985–1995 and 2005–2015.
Measurements of climate variables are correlated in time and space precluding their combinations into multiple linear regressions prior to addressing collinearities. Temperature measurements at Cape Moreton lighthouse were highly correlated () between successive months in winter, spring and summer (Tab. 2). Moreover high correlations also existed between multiple month’s periods and the shorter periods they included, meaning that high temperatures in January were indicative of high temperatures throughout summer as well as throughout the pre-recruitment growth period (August to February, Tab. 2). Monthly rainfall at Manly railway station and Karragarra Island was also strongly correlated, indicating that weather systems influencing this region operate at a larger scale.
3.2 Variables explaining recruitment variability
A linear regression between recruitment () and spawning stock biomass () on the log-scale (Fig. 2) was not significant (model 1 in Tab. 3, F(1; 22 df)=4.139, p=0.054). The residuals of this fit showed a trend with time (Fig. 2). Comparisons between more complicated models by step-wise selection concluded that recruitment was better explained by a multiple linear regression including both the effect of spawning stock biomass () and average daily maximum air temperature measured in January at Cape Moreton lighthouse (model 2 in Tab. 3). This model explained 68% of the total variability of recruitment: approx. 35% explained by variation in temperature and 33% by changes in spawning stock biomass. A model including a term for interaction between temperature and spawning stock biomass (model 3) was best according to AIC but the coefficients for the interaction and effect of spawning stock biomass () were not significant suggesting (e-06 e-06) that temperature might change the stock recruitment relationship but there was insufficient data (n=24) to quantify it precisely.
The linear effect of temperature is biologically unrealistic because a dome-shaped relationship will likely better represent characteristics of living organisms, such as growth or mortality, known to vary around a maximum at an optimal temperature (Gillooly et al., 2001). Therefore, a parabolic model of temperature was fitted to the data (model 4 in Tab. 3) to assess the feasibility of parametrizing a biologically more meaningful model to describe the effect of temperature on brown tiger prawn recruitment. This model has a slightly larger AIC than model 3 (AIC=1.25). It suggested that the current temperature range observed around Moreton Bay was limited to the ascending part of parabola (Fig. 4). Therefore past and present conditions in Moreton Bay were sub-optimal for brown tiger prawn recruitment. Given the limited range of temperature observed, the parametrization of the parabolic model is uncertain as shown by the large error associated with its parameter elevated to the power of 2 (e-02 5.57e-02). Inclusion of an interaction term between spawning stock biomass and the polynomial of temperature measurement in January in Cape Moreton (model 5) performed worst according to AIC (AIC=3.55).
The inclusion of a second environmental factor, rainfall in May at Karragarra, to explain variability in brown tiger prawn recruitment (model 6) did not improve the model fit (AIC=1.92, Tab. 3). It is concluded that this variable does not help improve our understanding of the variation of brown tiger prawn recruitment.
According to the linear additive model including temperature and spawning stock biomass (model 2), temperature did not modify the density-dependence effect. It increased the recruitment to the fishery (Fig. 5) as measured by the steepness of the Ricker stock-recruitment relationship (). An increase of temperature by 1oC was estimated to increase the recruitment to the fishery () by a factor 1.4 (e). The average maximum daily temperature measured in January between 1990 and 2014 ranged from 25.8 to 29.1 oC. According to model 2, such difference in temperature explained a variation in brown tiger prawn recruitment by a factor of 3 (e) between the worst and the best environmental conditions prevailing during this period of time.
According to the parabolic model of temperature (model 4), maximum recruitment would be reached at 29.9 oC (fig. 4). This model suggests recruitment would increase by a multiplicative factor of 1.5 per oC at 27oC down to a multiplicative factor of 1 at 29.9oC beyond which it would decline. In other words, warming waters would increase prawn recruitment in Moreton Bay only for a limited amount of time before declining.
4 Discussion
The results of the present work suggest that environmental factors have contributed to increase the recruitment of brown tiger prawn in Moreton Bay between 1990 and 2014. The positive relationship between temperature and recruitment is consistent with the biology of this tropical species living in an area close to the southern limit of its distribution in the southern hemisphere (Courtney et al., 2012). Cheung et al. (2013) proposed to use the mean temperature of the catch to study the effect of climate change on fisheries worldwide. Their results describe the tropicalisation of sub-tropical waters around the world as a result of global warming which is supported by our results. In the present analysis, temperature variations explained 35% of recruitment variability making this variable the largest contributor to recruitment variation between 1990 and 2014. On the other hand, spawning stock biomass in a given year explained another 33% of the variation of the number of recruits in the following year. The increasing trend in brown tiger prawn recruitment over the last 20 years was previously regarded as the consequence of declining fishing pressure (Kienzle et al., 2014). Since the magnitude of spawning stock biomass depends on fishing mortality as well as recruitment in the same year, itself influenced by temperature, the contribution of the reduction of fishing mortality to the recovery of the stock is likely to have been less than the contribution of environmental factors. Nevertheless, this work suggests that both factors worked together to produce a higher stock size in 2014 than in 1990. The synchronicity of changes in environmental and fishing factors around 2000 is interesting and a source of confusion as to determine which factor affected most the dynamic of this stock: this is almost certainly the result of chance because there are no evidences suggesting a causal relationship between temperature and fishing effort. Previous analyses failed to find a significant relationship between stock and recruitment by regressing Ricker’s function to these data (Kienzle et al., 2014). Including temperature in the stock-recruitment relationship (model 2) permitted the detection of a significant compensatory population effect (e.g., a dome-shaped stock-recruitment function) that was masked by temperature-driven variability, as shown by Hare et al. (2010). Both studies focused on species at the southern limit of their distribution. In a re-analysis of environment and recruitment relationships, Myers (1998) concluded that there is one generalization that stands out: correlations for populations at the limit of a species’ geographical range have often remained statistically significant when re-examined. Myers (1998)’s results suggest that the effect of temperature reported here is likely to hold into the future and therefore be a useful knowledge for the management of the brown tiger prawn fishery in Moreton Bay. The present results are also consistent with an investigation of the effect of climate change on fisheries in Western Australia (Caputi et al., 2014) which reported that fishery-independent indices of recruitment for brown tiger prawn in the Shark Bay prawn fishery were positively correlated with sea surface temperature ().
Global warming is already occurring with significant consequences for marine and freshwater resources (Lough and Hobday, 2011). It is predicted to continue into the foreseeable future (CSIRO-BOM, 2015), therefore these results suggest that recruitment of brown tiger prawn in Moreton Bay should continue to increase in line with an expected increase in temperature. As a result, fishermen targeting this species in Moreton Bay are likely to benefit from a rising temperature induced by climate change, at least in the short term. The optimal temperature estimated by the parabolic model used in this analysis (Tmax=29.9oC) is close to maximal temperature recorded over the period 1990–2014, suggesting that recruitment might not increase much further than already estimated. On the other hand, aquaculture experiments estimated the optimal temperature for growth and survival of brown tiger prawn between 30 and 35oC (O’Brien, 1994a) suggesting that there is more scope for an increase in brown tiger prawn recruitment in Moreton Bay. This somewhat optimistic view about the consequences of climate change for the Moreton Bay prawn fishery has been obtained through the narrow lens of a single species assessment analysis. Our results should be balanced by (a) the fact that beyond optimal temperature, further temperature increase will become detrimental to brown tiger prawns and hence its fishery; (b) an evaluation of the impact of climate change on all species caught in Moreton Bay to provide an holistic view of the short to medium terms costs and benefits of climate change to the fishing industry in south east Queensland and (c) the productivity of brown tiger prawn fisheries further north may reduce as temperature increases beyond the optimum for this species, redistributing brown tiger prawn production along the east coast of Australia.
The delay difference model used a constant somatic growth parametrization throughout the entire time series. Therefore, a change of size at age resulting in a larger catch for a given recruitment would be incorrectly interpreted by the model as an increased estimate of recruitment. Even if the delay-difference model could be modified to incorporate prawn sizes, no size data were collected to determine whether increased temperature induced faster growth or higher larval survival leading to larger recruitment, or both. Our research suggests that warmer temperature improved brown tiger prawn recruitment in Moreton Bay, but it does not elucidate by which mechanisms this was actually achieved. Another interesting observation from this research is that past increases in recruitment have been possible only because food to sustain larger cohorts was available. There is no knowledge about how organisms preyed upon by brown tiger prawns are responding to increasing temperatures and whether they will exist in sufficiently large quantity to sustain extrapolated further increase in recruitment at higher temperatures. Food and habitat shortage are recognized as major limiting factors for the expansion of invertebrate populations in the wild (Loneragan et al., 2013; Chittleborough, 1975).
Acknowledgements
Catch and effort data were provided by the State of Queensland, Australia through the Department of Agriculture and Fisheries. Formatting of the tables was greatly simplified by Hlavac (2014). We are grateful to Dr. A.J. Courtney and several reviewers for improving earlier versions of this manuscript.
References
- [1] Australian Bureau of Meteorology. Data services. Accessible via http://www.bom.gov.au/climate/data-services. Last accessed on 29 Sep. 2014.
- Blaber [2000] S.J.M. Blaber. Tropical estuarine fishes : ecology, exploitation, and conservation. Blackwell Science, 2000.
- Caputi et al. [2014] N. Caputi, M. Feng, A. Pearce, J. Benthuysen, A. Denham, Y. Hetzel, R. Matear, G. Jackson, B. Molony, L. Joll, and A. Chandrapavan. Management implications of climate change effect on fisheries in Western Australia Part 1: Environmental change and risk assessment. Technical Report 2010/535, FRDC, 2014.
- Cheung et al. [2013] W.W.L. Cheung, R. Watson, and D. Pauly. Signature of ocean warming in global fisheries catch. Nature, 497(7449):365–368, 2013.
- Chittleborough [1975] R. G. Chittleborough. Environmental factors affecting growth and survival of juvenile western rock lobsters Panulirus longipes (Milne-Edwards). Australian Journal of Marine and Freshwater Research, 26:177–96, 1975.
- Courtney and Masel [1997] A.J. Courtney and J.M. Masel. Spawning stock dynamics of two penaeid prawns, Metapenaeus bennettae and Penaeus esculentus, in Moreton Bay, Queensland, Australia. Marine Ecology Progress Series, 148:37–47, 1997.
- Courtney et al. [2012] A.J. Courtney, M. Kienzle, S. Pascoe, M.F. O’Neill, G.M. Leigh, Y.-G. Wang, J. Innes, M. Landers, M. Braccini, A.J. Prosser, P. Baxter, D. Sterling, and J. Larkin. Harvest strategy evaluations and co-management for the Moreton Bay trawl fishery. Technical Report Project 2009/774, Australian Seafood CRC, 2012.
- CSIRO-BOM [2015] CSIRO-BOM. Climate change in Australia: information for Australia’s Natural Resource Management Regions. Technical report, CSIRO and Bureau of Meteorology, Australia, 2015.
- Davie et al. [2011] P. Davie, G. Cranitch, J. Wright, and B. Cowell. Wild Guide to Moreton Bay and Adjacent coasts. Queensland Museum, Brisbane, Australia, 2nd edition, 2011.
- Deyle et al. [2013] E. R. Deyle, M. Fogarty, C.-h. Hsieh, L. Kaufman, a.D. MacCall, Stephan B. Munch, C.T. Perretti, H. Ye, and G. Sugihara. Predicting climate effects on pacific sardine. Proceedings of the National Academy of Sciences, 110(16):6430–6435, 2013.
- García and Le Reste [1981] S. García and L. Le Reste. Life cycles, dynamics, exploitation and management of coastal penaeid shrimp stocks. Technical Report 203, FAO, 1981.
- Gillooly et al. [2001] J. F. Gillooly, J. H. Brown, G. B. West, Van M. Savage, and E. L. Charnov. Effects of size and temperature on metabolic rate. Science, 293(5538):2248–2251, 2001.
- Grey et al. [1983] D.L. Grey, W. Dall, and A. Baker. A guide to the Australian penaeid prawns. Technical Report 2005/239, Department of Primary Production, 1983.
- Haddon [2007] M. Haddon. Fisheries and their management. In Marine Ecology. Oxford University Press, 2007.
- Hare et al. [2010] J.A. Hare, M.A. Alexander, M.J. Fogarty, E.H. Williams, and J.D. Scott. Forecasting the dynamics of a coastal fishery species using a coupled climate-population model. Ecological Applications, 20(2):452–464, 2010.
- Hilborn and Walters [1992] R. Hilborn and C. Walters. Quantitative Fisheries Stock Assessment: Choice, Dynamics and Uncertainty. Chapman & Hall, 1992.
- Hill [1985] B.J. Hill. Effect of temperature on duration of emergence, speed of movement, and catchability of the prawn Penaeus esculentus. In Staples DJ Rothlisberg PC, Hill BJ, editor, Proceedings of the Second Australian National Prawn Seminar, pages 77–83. Simpson Halligan, Brisbane, Australia, 1985.
- Hlavac [2014] M. Hlavac. stargazer: LaTeX/HTML code and ASCII text for well-formatted regression and summary statistics tables. Harvard University, Cambridge, USA, 2014. URL http://CRAN.R-project.org/package=stargazer. R package version 5.1.
- Kailola et al. [1993] P.J. Kailola, M.J. Williams, P.C. Stewart, R.E. Reichelt, A. McNee, and C. Grieve. Australian fisheries resources. Bureau of Resource Sciences and the Fisheries Research and Development Corporation Canberra, A.C.T, 1993.
- Kienzle et al. [2014] M. Kienzle, A.J. Courtney, and M.F. O’Neill. Environmental and fishing effects on the dynamics of brown tiger prawn (Penaeus esculentus) in Moreton Bay (Australia). Fisheries Research, 155:138 – 148, 2014.
- Kienzle et al. [2016] M. Kienzle, D. Sterling, S. Zhou, and Y.-G. Wang. Maximum likelihood estimation of natural mortality and quantification of temperature effects on catchability of brown tiger prawn (Penaeus esculentus) in Moreton Bay (Australia) using logbook data. Ecological Modelling, 322:1–9, 2016.
- Lehodey et al. [2006] P. Lehodey, J. Alheit, M. Barange, T. Baumgartner, and et al. Climate variability, fish, and fisheries. Journal of Climate, 19(20):5009–5030, 2006.
- Lehodey et al. [2008] P. Lehodey, I. Senina, and R. Murtugudde. A spatial ecosystem and populations dynamics model (SEAPODYM) – modeling of tuna and tuna-like populations. Progress in Oceanography, 78(4):304–318, 2008.
- Loneragan and Bunn [1999] N.R. Loneragan and S. Bunn. River flows and estuarine ecosystems: Implications for coastal fisheries from a review and a case study of the logan river, southeast queensland. Australian Journal of Ecology, 24(4):431–440, 1999.
- Loneragan et al. [2013] N.R. Loneragan, M. Kangas, M.D.E. Haywood, R.A. Kenyon, N. Caputi, and E. Sporer. Impact of cyclones and aquatic macrophytes on recruitment and landings of tiger prawns penaeus esculentus in exmouth gulf, western australia. Estuarine, Coastal and Shelf Science, 127:46 – 58, 2013.
- Lough and Hobday [2011] J.M. Lough and A. Hobday. Observed climate change in Australian marine and freshwater environments. Marine & Freshwater Research, 62:984–999, 2011.
- Myers [1998] R.A. Myers. When do environment-recruit correlations work? Reviews in Fish Biology and Fisheries, 8:285–305, 1998.
- O’Brien [1994a] C.J. O’Brien. The effects of temperature and salinity on growth and survival of juvenile tiger prawns Penaeus esculentus (Haswell). Journal of Experimental Marine Biology and Ecology, 183(1):133 – 145, 1994a.
- O’Brien [1994b] C.J. O’Brien. Population dynamics of juvenile tiger prawns Penaeus esculentus in south Queensland, Australia. Marine Ecology Progress Series, 104:247–256, 1994b.
- Parke [2013] J. Parke. Against the Tide: Queensland’s Moreton Bay Fishing Industry since 1824. 5Word Productions, Australia, 2013.
- Penn and Caputi [1986] J.W. Penn and N. Caputi. Spawning stock-recruitment relationships and environmental influences on the tiger prawn (Penaeus esculentus) fishery in Exmouth Gulf, Western Australia. Australian Journal of Marine and Freshwater Research, (37):491–505, 1986.
- R Core Team [2015] R Core Team. R: A Language and Environment for Statistical Computing. R Foundation for Statistical Computing, Vienna, Austria, 2015. URL http://www.R-project.org/.
- Robins et al. [2005] J.B. Robins, I.A. Halliday, J. Staunton-Smith, D.G. Mayer, and M.J. Sellin. Freshwater-flow requirements of estuarine fisheries in tropical Australia: a review of the state of knowledge and application of a suggested approach. Australian Journal of Marine and Freshwater Research, 2005.
- Skern-Mauritzen et al. [2015] M. Skern-Mauritzen, G. Ottersen, N.O. Handegard, G. Huse, G.E. Dingsør, N.C. Stenseth, and O.S. Kjesbu. Ecosystem processes are rarely included in tactical fisheries management. Fish and Fisheries, 2015. doi:10.1111/faf.12111.
- Ulltang [1996] Ø. Ulltang. Stock assessment and biological knowledge: can prediction uncertainty be reduced? ICES Journal of Marine Science, 53(4):659–675, 1996.
- Venables and Ripley [2003] W.N. Venables and B.D. Ripley. Modern applied statistics with S. Springer-Verlag, fourth edition, 2003.
- Walters and Martell [2004] C.J. Walters and S.J.D. Martell. Fisheries Ecology and Management. Princeton University Press, 2004.
- Young [1978] P.C. Young. Moreton Bay, Queensland: a nursery area for juvenile penaeid prawns. Australian Journal of Marine and Freshwater Research, 29:55–75, 1978.
Figures


| Weather station | Avg. max. air temperature | Rainfall | ||||||
|---|---|---|---|---|---|---|---|---|
| Monthly | Seasonal | Aug–Feb | Jan–Jun | Monthly | Seasonal | Aug–Feb | Jan–Jun | |
| Cape Moreton lighthouse (CM) | ✓ | ✓ | ✓ | ✓ | ||||
| Manly railway station (MR) | ✓ | ✓ | ✓ | ✓ | ||||
| Karragarra island (KI) | ✓ | ✓ | ✓ | ✓ | ||||
| T.Jan.CM | T.Feb.CM | T.Aug2Feb.CM | T.Summer.CM | R.Jan.MR | R.Feb.MR | R.Jan.KI | R.Feb.KI | |
|---|---|---|---|---|---|---|---|---|
| T.Jan.CM | 1.00 | 0.60 | 0.83 | 0.87 | 0.39 | 0.19 | 0.04 | 0.42 |
| T.Feb.CM | 1.00 | 0.80 | 0.85 | 0.07 | -0.37 | -0.13 | -0.19 | |
| T.Aug2Feb.CM | 1.00 | 0.93 | 0.22 | 0.02 | -0.06 | 0.29 | ||
| T.Summer.CM | 1.00 | 0.23 | -0.02 | 0.01 | 0.21 | |||
| R.Jan.MR | 1.00 | -0.00 | 0.68 | 0.26 | ||||
| R.Feb.MR | 1.00 | -0.30 | 0.85 | |||||
| R.Jan.KI | 1.00 | -0.05 | ||||||
| R.Feb.KI | 1.00 |
| Models | ||||||
| (1) | (2) | (3) | (4) | (5) | (6) | |
| Temperature | 3.45e-01∗∗∗ | 6.52e-01∗∗∗ | 4.16e+00 | 3.45e+00 | 3.39e-01 ∗∗∗ | |
| (6.04e-02) | (1.95e-01) | (3.05e+00) | (1.26e+01) | (6.08e-02) | ||
| Temperature2 | 6.95e-02 | 5.22e-02 | ||||
| (5.57e-02) | (2.30e-01) | |||||
| Rainfall | 4.16e-04 | |||||
| (4.24e-04) | ||||||
| S | 6.506e-06∗∗ | 8.78e-06∗∗∗ | 9.20e-05 | 8.55e-06∗∗∗ | 2.20e-04 | 8.94e-06∗∗∗ |
| (2.852e-06) | (1.87e-06) | (6.12e-05) | (1.86e-06) | (2.08e-03) | (1.88e-06) | |
| Temperature : S | 3.69e-06 | 1.37e-05 | ||||
| (2.24e-06 ) | (1.52e-04) | |||||
| Temperature2 : S | 1.95e-07 | |||||
| ( 2.77e-06) | ||||||
| Constant | 5.30e+00∗∗∗ | 3.98e+00∗∗ | 1.24e+01∗∗ | 5.62e+01 | 5.00e+01 | 3.74e+00 ∗∗ |
| (2.36e-01) | (1.63e+00) | (5.32e+00) | (4.19e+01) | (1.71e+02) | ( 1.65e+00) | |
| Observations | 24 | 24 | 24 | 24 | 24 | 24 |
| R2 | 0.158 | 0.684 | 0.716 | 0.706 | 0.721 | 0.695 |
| Adjusted R2 | 0.120 | 0.654 | 0.673 | 0.662 | 0.644 | 0.650 |
| Residual Std. Error df | 0.359 (22) | 0.230 (21) | 0.221 (20) | 0.227 (20) | 0.231 (18) | 0.230 (20) |
| F Statistic df | 4.139∗ (1; 22) | 22.697∗∗∗ (2; 21) | 16.806∗∗∗ (3; 20) | 15.985∗∗∗ (3; 20) | 9.326∗∗∗ (5; 18) | 15.219∗∗∗ (3; 20) |
| AIC | 21.5 | 1.05 | 0 | 1.25 | 3.55 | 1.92 |