MOJAVE XIII. Parsec-Scale AGN Jet Kinematics Analysis Based on 19 years of VLBA Observations at 15 GHz
Abstract
We present 1625 new 15 GHz (2 cm) VLBA images of 295 jets associated with active galactic nuclei (AGNs) from the MOJAVE and 2 cm VLBA surveys, spanning observations between 1994 Aug 31 and 2013 Aug 20. For 274 AGNs with at least 5 VLBA epochs, we have analyzed the kinematics of 961 individual bright features in their parsec-scale jets. A total of 122 of these jets have not been previously analyzed by the MOJAVE program. In the case of 451 jet features that had at least 10 epochs, we also examined their kinematics for possible accelerations. At least half of the well-sampled features have non-radial and/or accelerating trajectories, indicating that non-ballistic motion is common in AGN jets. Since it is impossible to extrapolate any accelerations that occurred before our monitoring period, we could only determine reliable ejection dates for of those features that had significant proper motions. The distribution of maximum apparent jet speeds in all 295 AGNs measured by our program to date is peaked below , with very few jets with apparent speeds above . The fastest speed in our survey is , measured in the jet of the quasar PKS 080507, and is indicative of a maximum jet Lorentz factor of in the parent population. An envelope in the maximum jet speed versus redshift distribution of our sample provides additional evidence of this upper limit to the speeds of radio-emitting regions in parsec-scale AGN jets. The Fermi LAT-detected gamma-ray AGNs in our sample have, on average, higher jet speeds than non LAT-detected AGNs, indicating a strong correlation between pc-scale jet speed and gamma-ray Doppler boosting factor. We have identified 11 moderate-redshift () AGNs with fast apparent speeds () that are strong candidates for future TeV gamma-ray detection. Of the five gamma-ray loud narrow-lined Seyfert I AGNs in our sample, three show highly superluminal jet motions, while the others have sub-luminal speeds. This indicates that some narrow-lined Seyfert I AGNs possess powerful jets with Lorentz factors in excess of 10, and viewing angles less than , consistent with those of typical BL Lac objects and flat-spectrum radio quasars.
Subject headings:
galaxies: active — galaxies: jets — radio continuum: galaxies — quasars: general — BL Lacertae objects: general1. INTRODUCTION
Very long baseline interferometry (VLBI) provides the highest resolution images in astronomy, and is invaluable for studying the structure and evolution of non-thermal radio sources. The powerful jetted outflows associated with active galactic nuclei (AGNs) are a natural target for VLBI, since they are exceedingly compact, and dominate the extragalactic sky at radio and high energy wavelengths. Because of their relativistic flow speeds, AGN jets are affected by beaming and aberration effects that can significantly enhance their apparent luminosity and variability, and create the illusion of superluminal motion in the sky plane (Blandford et al., 1977). AGNs of the rare blazar class represent cases where a high-Lorentz factor jet is pointed nearly directly at us, thereby maximizing these relativistic Doppler effects.
| B1950 | J2000 | Alias | Gamma-ray Assoc. | Opt. | 1.5 Jy | Reference | |
|---|---|---|---|---|---|---|---|
| (1) | (2) | (3) | (4) | (5) | (6) | (7) | (8) |
| 0003+380aaJet kinematics analyzed in this paper, based on data up to 2013 Aug 20. | J0005+3820 | S4 0003+38 | 3FGL J0006.4+3825 | Q | 0.229 | Schramm et al. (1994) | |
| 0003066aaJet kinematics analyzed in this paper, based on data up to 2013 Aug 20. | J00060623 | NRAO 005 | B | Y | 0.3467 | Jones et al. (2005) | |
| 0006+061aaJet kinematics analyzed in this paper, based on data up to 2013 Aug 20. | J0009+0628 | CRATES J0009+0628 | 3FGL J0009.1+0630eeOne of two AGN associations listed for this 3FGL source in Ackermann et al. (2015) (see Appendix) | B | Rau et al. (2012) | ||
| 0007+106aaJet kinematics analyzed in this paper, based on data up to 2013 Aug 20. | J0010+1058 | III Zw 2 | G | Y | 0.0893 | Sargent (1970) | |
| 0010+405aaJet kinematics analyzed in this paper, based on data up to 2013 Aug 20. | J0013+4051 | 4C +40.01 | Q | 0.256 | Thompson et al. (1992) | ||
| 0015054aaJet kinematics analyzed in this paper, based on data up to 2013 Aug 20. | J00170512 | PMN J00170512 | 3FGL J0017.60512 | Q | 0.226 | Shaw et al. (2012) | |
| 0016+731aaJet kinematics analyzed in this paper, based on data up to 2013 Aug 20. | J0019+7327 | S5 0016+73 | Q | Y | 1.781 | Lawrence et al. (1986) | |
| 0027+056aaJet kinematics analyzed in this paper, based on data up to 2013 Aug 20. | J0029+0554 | PKS 0027+056 | Q | 1.317 | Schneider et al. (1999) | ||
| 0026+346aaJet kinematics analyzed in this paper, based on data up to 2013 Aug 20. | J0029+3456 | B2 0026+34 | G | 0.517 | Zensus et al. (2002a) | ||
| 0035+413aaJet kinematics analyzed in this paper, based on data up to 2013 Aug 20. | J0038+4137 | B3 0035+413 | Q | 1.353 | Stickel & Kuhr (1993) | ||
| 0048097aaJet kinematics analyzed in this paper, based on data up to 2013 Aug 20. | J00500929 | PKS 004809 | 3FGL J0050.60929 | B | Y | 0.635 | Landoni et al. (2012) |
Note. — This is a table stub, the full version is available as an ancillary file. Columns are as follows: (1) B1950 name, (2) J2000 name, (3) other name, (4) gamma-ray association name, (5) optical classification, where B = BL Lac, Q = quasar, G = radio galaxy, N = narrow-lined Seyfert 1, and U = unidentified, (6) MOJAVE 1.5 Jy sample membership flag, (7) redshift, (8) reference for redshift and/or optical classification.
Starting with the 2 cm VLBA survey in 1994 (Kellermann et al., 1998), and continuing with the MOJAVE (Monitoring of Jets in Active Galactic Nuclei With VLBA Experiments) program (Lister et al., 2009a), we have carried out multi-epoch VLBA observations of several hundred of the brightest, most compact radio sources in the northern sky. These are predominantly blazars, due to the selection biases associated with relativistic beaming (Blandford & Königl, 1979).
In this paper, we present 1625 VLBA 15 GHz contour maps of 295 AGNs for epochs between 1994 Aug 31 and 2013 Aug 20 that have not previously appeared in any paper from the MOJAVE (Lister & Homan, 2005; Lister et al., 2009a, 2013) or 2 cm VLBA surveys (Kellermann et al., 1998; Zensus et al., 2002b). These AGNs (see Table 1) are from one or more of the following: the MOJAVE low-luminosity sample (Lister et al., 2013), the complete flux density-limited MOJAVE 1.5 Jy sample (Lister et al., 2015), the VLBA 2 cm survey (Kellermann et al., 1998), the 3rd EGRET gamma-ray catalog (Hartman et al., 1999), or the 3FGL Fermi gamma-ray catalog (Acero et al., 2015). Also included are some AGNs that were originally candidates for these samples, but did not meet the final selection criteria.
A major aspect of our program is to analyze these multi-epoch VLBA observations in order to investigate the evolution of pc-scale AGN jets, which we have reported on in a series of papers (Kellermann et al., 2004; Lister et al., 2009b; Homan et al., 2009; Lister et al., 2013; Homan et al., 2015). Most AGN jets have bright, compact radio-emitting features that move outward at apparent superluminal speeds. These features often change both their speed and direction, suggesting that their kinematics are strongly affected by both hydrodynamic and MHD plasma effects (e.g., Homan et al. 2003; Cohen et al. 2015). In our most recent analysis (Lister et al., 2013; Homan et al., 2015), we studied the kinematics of 200 AGN jets, for which at least 5 VLBA epochs were obtained between 1994 Aug 31 to 2011 May 1. These AGNs were drawn from the MOJAVE 1.5 Jy radio flux density-limited and 1FM Fermi gamma-ray selected samples, described by Lister et al. (2015) and Lister et al. (2011), respectively. Here we present time lapse movies and new kinematics analyses of 173 AGNs drawn from these two samples, and 101 AGNs drawn from the other surveys described in the previous paragraph, using VLBA data obtained between 1994 Aug 31 and 2013 Aug 20. A total of 122 of these jets have not previously had their kinematics analyzed by the MOJAVE program. We have excluded from our kinematics analysis 48 MOJAVE AGNs we previously analyzed in Lister et al. (2013), since we are currently gathering additional VLBA epochs on them.
The overall layout of the paper is as follows. In Section 2 we describe our observational data and our method of modeling the individual jet features, and in Section 3 we discuss their kinematic properties and overall trends in the data. We summarize our findings in Section 4. We adopt a cosmology with , and (Komatsu et al., 2009). We refer to the AGNs throughout using either B1950 nomenclature or commonly-used aliases, as listed in Table 1.
2. OBSERVATIONAL DATA AND ANALYSIS

2.1. Contour Maps
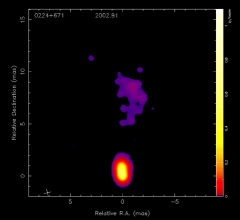
We processed the VLBA interferometric visibility data and produced contour maps (Figure 1) using the AIPS and Difmap (Shepherd, 1997) software packages, using the methods described by Lister et al. (2009a, 2013). The raw correlated data from the MOJAVE program are available immediately after correlation from the NRAO data archive111http://archive.nrao.edu, and our processed data and maps are publicly available on our project website222http://www.astro.purdue.edu/MOJAVE within a few weeks after correlation. We list the parameters of the contour maps in Table 2. The FWHM dimensions of the VLBA interferometric restoring beam at 15 GHz vary with declination, but are on the order of 1 mas (N-S) 0.5 mas (E-W), which corresponds to a linear resolution of a few parsecs (projected) at the median redshift () of our sample. Column 4 of Table 2 lists the VLBA project code for each observation, along with an indicator of whether it is from the MOJAVE program, the VLBA 2 cm Survey, or the NRAO data archive. For the latter, we considered only archival epochs with at least 4 individual scans that spanned a reasonably wide range of hour angle, and that included at least 8 VLBA antennas. The VLBA 2 cm Survey observations (1994–2002) consisted of approximately one hour integrations on each AGN, broken up into several scans separated in hour angle to improve the interferometric coverage. A similar observing method was used in the full polarization MOJAVE observations from 2002 May to 2007 September (VLBA codes BL111, BL123, BL137, and BL149), and is described by Lister & Homan (2005). During 2006 (VLBA code BL137), the 15 GHz integration times were shortened by a factor of to accommodate interleaved scans at three other observing frequencies (8.1, 8.4, 12.1 GHz). The latter were published by Hovatta et al. (2012), Pushkarev et al. (2012), and Hovatta et al. (2014). The MOJAVE and 2 cm Survey observations were originally recorded at a data rate of 128 Mbps, which was increased to 256 Mbps for the epochs from 2007 July 3 to 2008 Sept 12 inclusive, and 512 Mbps thereafter. Beginning with the 2007 Jan 6 epoch, we increased the number of AGNs observed in each 24 hour MOJAVE session from 18 to 25 AGNs, and to 30 AGNs on 2009 Feb 25.
| VLBA | Freq. | rms | Fig. | ||||||||
|---|---|---|---|---|---|---|---|---|---|---|---|
| Source | Alias | Epoch | Code | (GHz) | (mas) | (mas) | (°) | (Jy) | (mJy | (mJy | Num. |
| bm-1) | bm-1) | ||||||||||
| (1) | (2) | (3) | (4) | (5) | (6) | (7) | (8) | (9) | (10) | (11) | (12) |
| 0003+380 | S4 0003+38 | 2011 Jun 6 | BL149DJaaFull polarization MOJAVE epoch | 15.4 | 0.91 | 0.54 | 10 | 0.605 | 0.18 | 0.50 | 1.1 |
| 2013 Aug 12 | BL178BHaaFull polarization MOJAVE epoch | 15.4 | 0.84 | 0.53 | 4 | 0.667 | 0.20 | 0.50 | 1.2 | ||
| 0003066 | NRAO 005 | 2011 Jun 24 | BL149DLaaFull polarization MOJAVE epoch | 15.4 | 1.42 | 0.54 | 5 | 2.076 | 0.18 | 1.30 | 1.3 |
| 2012 Mar 4 | BL178AHaaFull polarization MOJAVE epoch | 15.4 | 1.31 | 0.53 | 3 | 2.132 | 0.17 | 0.60 | 1.4 | ||
| 2012 Nov 2 | BL178ARaaFull polarization MOJAVE epoch | 15.4 | 1.37 | 0.53 | 7 | 2.273 | 0.16 | 0.60 | 1.5 | ||
| 0006+061 | CRATES J0009+0628 | 2011 Dec 29 | BL178ADaaFull polarization MOJAVE epoch | 15.4 | 1.32 | 0.65 | 8 | 0.209 | 0.22 | 0.60 | 1.6 |
| 2012 Jul 12 | BL178AMaaFull polarization MOJAVE epoch | 15.4 | 1.28 | 0.52 | 13 | 0.200 | 0.25 | 0.70 | 1.7 | ||
| 2012 Nov 11 | BL178ASaaFull polarization MOJAVE epoch | 15.4 | 1.27 | 0.56 | 8 | 0.182 | 0.15 | 0.50 | 1.8 | ||
| 2012 Dec 23 | BL178AXaaFull polarization MOJAVE epoch | 15.4 | 1.34 | 0.53 | 3 | 0.184 | 0.20 | 0.60 | 1.9 | ||
| 2013 Jun 2 | BL178BDaaFull polarization MOJAVE epoch | 15.4 | 1.32 | 0.56 | 1 | 0.162 | 0.23 | 0.70 | 1.10 | ||
| 0007+106 | III Zw 2 | 1998 Feb 16 | BF039ccKnown TeV emitter (http://tevcat.uchicago.edu). | 15.4 | 1.14 | 0.51 | 8 | 0.784 | 0.16 | 0.50 | 1.11 |
| 1998 Jun 13 | BF039BccNRAO archive epoch | 15.4 | 1.13 | 0.53 | 5 | 0.982 | 0.15 | 0.40 | 1.12 | ||
| 1998 Sep 14 | BG044ccNRAO archive epoch | 15.4 | 1.11 | 0.49 | 4 | 1.202 | 0.18 | 0.70 | 1.13 | ||
| 2011 May 26 | BL149DIaaFull polarization MOJAVE epoch | 15.4 | 1.18 | 0.54 | 5 | 0.169 | 0.19 | 0.60 | 1.14 |
Note. — This is a table stub, the full version is available as an ancillary file. Columns are as follows: (1) B1950 name, (2) other name, (3) date of VLBA observation, (4) VLBA experiment code, (5) observing frequency (GHz), (6) FWHM major axis of restoring beam (milliarcseconds), (7) FWHM minor axis of restoring beam (milliarcseconds), (8) position angle of major axis of restoring beam (degrees), (9) total I flux density (Jy), (10) rms noise level of image (mJy per beam), (11) lowest I contour (mJy per beam), (12) figure number.
2.2. Time-lapse Movies
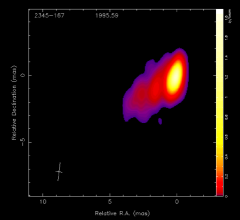
In Figures 2 and 3 we show linearly interpolated time-lapse MPEG movies of the multi-epoch VLBA images for two selected AGNs (4C +67.05 and PKS 234516). Movies for the other AGNs can be found on the MOJAVE website. We constructed the movies using a two-point linear interpolation across each successive epoch, treating each map pixel independently. Prior to interpolation, we restored all of the epoch maps to a scale of 0.05 milliarcseconds per pixel using identical median beam dimensions that were based on the full set of naturally weighted VLBA epochs available for that AGN. We did not interpolate across any time gaps larger than 4 years, leaving these periods instead as blank frames in the movie. The false-color corresponds to radio flux density in units of Jy per beam (indicated by scale bar on the right side of the frames). One year of calendar time corresponds to 2.5 seconds of run time in the movies.
2.3. Gaussian Modeling
| I | r | P.A. | Maj. | Maj. P.A. | |||||
|---|---|---|---|---|---|---|---|---|---|
| Source | I.D. | Epoch | (Jy) | (mas) | (°) | (mas) | Ratio | (°) | Robust? |
| (1) | (2) | (3) | (4) | (5) | (6) | (7) | (8) | (9) | (10) |
| 0003+380 | 0 | 2006 Mar 9 | 0.489 | 0.04 | 290.7 | 0.23 | 0.33 | 292 | Y |
| 1 | 0.007 | 3.98 | 121.8 | 0.72 | 1.00 | Y | |||
| 2 | 0.042 | 1.25 | 110.5 | 0.51 | 1.00 | Y | |||
| 6 | 0.104 | 0.28 | 114.6 | 0.27 | 1.00 | Y | |||
| 7 | 0.003 | 2.31 | 119.3 | N | |||||
| 0 | 2006 Dec 1 | 0.320 | 0.10 | 308.1 | 0.25 | 0.29 | 295 | Y | |
| 1 | 0.005 | 3.65 | 120.8 | 1.63 | 1.00 | Y | |||
| 2 | 0.021 | 1.56 | 111.0 | 0.25 | 1.00 | Y | |||
| 5 | 0.023 | 0.75 | 116.2 | 0.32 | 1.00 | Y | |||
| 6 | 0.145 | 0.45 | 116.3 | 0.05 | 1.00 | Y |
Note. — This is a table stub, the full version is available as an ancillary file. Columns are as follows: (1) B1950 name, (2) feature identification number (zero indicates core feature), (3) observation epoch, (4) flux density in Jy, (5) position offset from the core feature (or map center for the core feature entries) in milliarcseconds, (6) position angle with respect to the core feature (or map center for the core feature entries) in degrees, (7) FWHM major axis of fitted Gaussian in milliarcseconds, (8) axial ratio of fitted Gaussian, (9) major axis position angle of fitted Gaussian in degrees, (10) robust feature flag.
We modeled the visibility data in Difmap using a set of Gaussian features, which we list in Table 3. In some instances, it was not possible to robustly cross-identify the same features in a jet from one epoch to the next. We indicate those features with robust cross-identifications across at least 5 epochs in column 10 of Table 3. For the non-robust features, we caution that the assignment of the same identification number across epochs does not necessarily indicate a reliable cross-identification.
Based on previous analysis (Lister et al., 2009b), we estimate the typical uncertainties in the Gaussian centroid positions to be % of the FWHM beam dimensions. For isolated bright and compact features, the positional errors are smaller by approximately a factor of two. We estimate the formal errors on the feature sizes to be roughly twice the positional error, according to Fomalont (1999). The flux density accuracies are approximately 5% (see Appendix A of Homan et al. 2002), but can be significantly larger for features located very close to one another. Also, at some epochs which had antenna dropouts, the fit errors of some features are much larger. We do not use the latter in our kinematics analysis, and indicate them by flags in Table 3.
2.4. Jet Kinematics Analysis
As in Lister et al. (2009b), Homan et al. (2009), Lister et al. (2013), and Homan et al. (2015), we analyzed the kinematics of the robust Gaussian jet features in our sample using two methods. In the first method we assumed a non-accelerating, two-dimensional (right ascension and declination) vector fit to the feature position over time, referenced to the core feature (which we presumed to be stationary). The latter represents the region in our VLBA images near the base of the jet where the emission becomes optically thick at 15 GHz. For the features that had measurements at 10 or more epochs, our second method employed a constant acceleration model that yielded kinematic fit quantities at a (midpoint) reference date located exactly halfway between the first and last VLBA observation dates for that particular AGN (see column 9 of Table 5). The results of these analyses are listed separately in Table 4 and Table 5, respectively. For completeness, these tables also include kinematic fit parameters for 48 AGNs (indicated by flags in column 1) that we analyzed in Lister et al. (2013), but not in this paper. We note that for features that show significant () accelerations, the acceleration-fit speed and other parameters in Table 5 provide a better description of their motions, hence for these features we will use the acceleration fit quantities in subsequent statistical analyses and discussion of their kinematics.
| Source | I.D. | N | (mJy) | (mas) | (pc) | (deg) | (deg) | (deg) | (as y | () | |||
|---|---|---|---|---|---|---|---|---|---|---|---|---|---|
| (1) | (2) | (3) | (4) | (5) | (6) | (7) | (8) | (9) | (10) | (11) | (12) | (13) | (14) |
| 0003+380 | 1 | 9 | 5 | 4.24 | 15.40 | 9716 | 2416 | 15742 | 2.290.61 | 1985.09 | 1888.98 | ||
| 2 | 7 | 17 | 1.81 | 6.57 | 119.72.6 | 7.12.7 | 31922 | 4.640.32 | 2001.68 | 2003.32 | |||
| 4 | 6 | 17 | 1.25 | 4.54 | 20812 | 9312ccFeature has significant non-radial motion. | 36.39.2 | 0.530.13 | 2075.66 | 1992.93 | |||
| 5 | 9 | 39 | 0.76 | 2.77 | 331119 | 146119 | 4.87.2eeFeature has slow pattern speed. | 0.070.10 | 2300.95 | 2092.52 | |||
| 6 | 10 | 98 | 0.39 | 1.43 | 33541 | 14141 | 12.78.3eeFeature has slow pattern speed. | 0.190.12 | 2073.84 | 2023.64 | |||
| 0003066 | 2 | 5 | 222 | 1.05 | 5.12 | 226.34.8 | 96.65.0ccFeature has significant non-radial motion. | 19115 | 4.090.33 | 1993.56 | 2004.48 | ||
| 3 | 9 | 119 | 2.82 | 13.73 | 284.84.5 | 12.14.6 | 25039 | 5.360.83 | 1989.50 | 1979.99 | |||
| 4aaIndividual feature epoch not used in kinematic fits. | 26 | 119 | 6.61 | 32.23 | 283.68.1 | 1.98.1 | 4113 | 0.870.28 | 1845.03 | 1820.94 | |||
| 5 | 6 | 1031 | 0.73 | 3.58 | 343.13.1 | 31.43.1ccFeature has significant non-radial motion. | 10016 | 2.150.35 | 2011.53 | 1997.84 | |||
| 6aaFeature has significant accelerated motion (see Table 5 for acceleration fit parameters). | 10 | 97 | 1.01 | 4.92 | 21013 | 8113ccFeature has significant non-radial motion. | 5517 | 1.180.37 | 1969.25 | 2011.24 |
Note. — This is a table stub, the full version is available as an ancillary file. Columns are as follows: (1) B1950 name, (2) feature number, (3) number of fitted epochs, (4) mean flux density at 15 GHz in mJy, (5) mean distance from core feature in mas, (6) mean projected distance from core feature in pc, (7) mean position angle with respect to the core feature in degrees, (8) position angle of velocity vector in degrees, (9) offset between mean position angle and velocity vector position angle in degrees, (10) angular proper motion in microarcseconds per year, (11) fitted speed in units of the speed of light, (12) estimated epoch of origin, (13) fitted epoch of origin in right ascension direction, (14) fitted epoch of origin in declination direction.
| Source | I.D. | (deg) | (deg) | (as y | (c) | (as y | (as y | |||
|---|---|---|---|---|---|---|---|---|---|---|
| (1) | (2) | (3) | (4) | (5) | (6) | (7) | (8) | (9) | (10) | (11) |
| 0003+380 | 6 | 0.200.12 | 2009.90 | 2071.12 | 2024.51 | |||||
| 0003066 | 4aaFeature shows significant accelerated motion. | 1.080.11 | 2004.83 | 1874.35 | 503767 | |||||
| 6aaFeature shows significant accelerated motion. | 1.160.24 | 2003.78 | 1971.75 | 2009.60 | ||||||
| 8aaFeature shows significant accelerated motion. | 7.080.21 | 2009.93 | 2002.02 | 2000.32 | ||||||
| 9 | 5.960.42 | 2009.24 | 2002.22 | 2004.34 | ||||||
| 0010+405 | 1 | 6.990.68 | 2008.52 | 1978.76 | 1991.39 | |||||
| 2 | 0.040.28 | 2008.87 | 37937 | 1427.76 | ||||||
| 3 | 0.0430.074 | 2008.87 | 2290.10 | 2404.54 | ||||||
| 4 | 0.0230.057 | 2008.87 | 2195.70 | 2676.67 | ||||||
| 0016+731 | 1aaFeature shows significant accelerated motion. | 8.230.34 | 2002.70 | 1975.08 | 1994.50 |
Note. — This is a table stub, the full version is available as an ancillary file. Columns are as follows: (1) B1950 name, (2) feature number, (3) proper motion position angle in degrees, (4) offset between mean position angle and velocity vector position angle in degrees, (5) angular proper motion in microarcseconds per year, (6) fitted speed in units of the speed of light, (7) angular acceleration perpendicular to velocity direction in microarcseconds per year per year, with the error excluding the direction uncertainty in parentheses, (8) angular acceleration parallel to velocity direction in microarcseconds per year per year, with the error excluding the direction uncertainty in parentheses, (9) date of reference (middle) epoch used for fit, (10) fitted epoch of origin in right ascension direction, (11) fitted epoch of origin in declination direction.
In the left hand panels of Figure 4 we show the positions and kinematic motion fits to the individual features on the sky, as well as a 15 GHz VLBA contour image of the jet at the observation epoch that is closest to the (midpoint) reference date. The orange box delimits the zoomed region displayed in the right hand panels, with the cross-hairs indicating the feature’s position at this epoch.
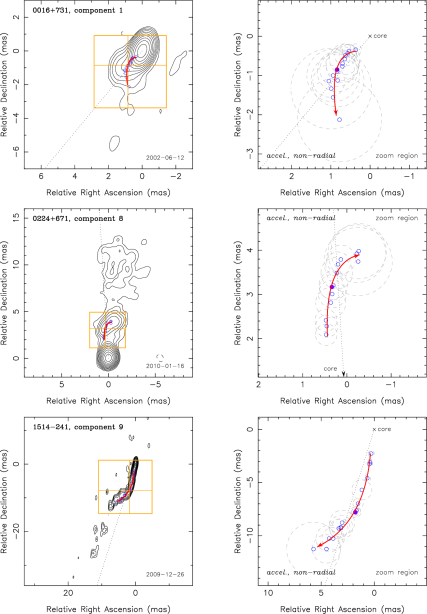
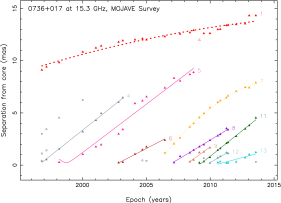
We note that many of the jet features in our sample display non-radial motion, i.e., the fitted velocity vector at the reference epoch does not point back to the core feature. This is indicative of accelerated, non-ballistic motion. In some cases, an extrapolation of our simple constant acceleration fit shows the feature passing through the core feature at the ejection epoch within the errors, as expected. However, in many other cases, the acceleration(s) are either complex, occurred before our monitoring period, or took place close to the core below our angular resolution level. These unknown accelerations strictly limit the number of features for which we can derive reliable ejection epochs, and can cause an apparent inflection in the fit line at minimum separation (e.g., feature id = 5 of 0736017) in the plots of radial separation from the core versus time (see Figure 5).
We examined each feature with significant proper motion for non-radial motion by comparing the mean position angle of the feature with its proper motion vector direction . We flagged any feature for which the angular offset was from both and as non-radial, and inward if the offset was significantly greater than 90°. Of the 714 newly analyzed features with statistically significant () proper motion, 228 (32%) exhibit significant non-radial motion, while only 25 (4%) are flagged as inward (see Table 4). The latter can be the result of curved trajectories that are approaching the line of sight, internal brightness changes in a large, diffuse jet feature, or backward pattern speeds not associated with the flow. We discuss these rare individual inward motion cases in the Appendix.
We calculated ejection times (epoch of zero core separation) for the non-accelerating, non-inward moving features with significant motion by taking an error-based weighted average of the extrapolated emergence epochs in the right ascension () and declination () directions (columns 13 and 14 of Table 4). The individual values of and describe the fits, but do not necessarily have physical meaning, depending on the proper motion vector direction, the statistical significance of the fitted motion, and/or accelerations that may be present. We include them in the motion tables for completeness only. We used the method described in Lister et al. (2013) to calculate the errors on the ejection times.
Due to the nature of our proper motion fits, which naturally include the possibility of non-ballistic motion, we did not estimate ejection times for any features where we could not confidently extrapolate their motion to the core. Jet features for which we estimated ejection epochs had the following properties: (i) significant motion , (ii) no significant acceleration, (iii) a velocity vector within of the outward radial direction to high confidence, i.e., , (iv) an extrapolated position at the ejection epoch no more than mas from the core, and (v) a fitted ejection epoch that differed by no more than 0.5 years from that given by a simple one-dimensional (radial) motion fit.
We list the parameters of our acceleration fits in Table 5, where we have resolved the acceleration terms and in directions perpendicular and parallel, respectively, to the mean angular velocity direction (columns 7 and 8). We quote two uncertainty values in these acceleration terms. The value in parentheses is the statistical uncertainty due to the acceleration fit itself, and is the appropriate quantity for determining if a significant acceleration occurred relative to the velocity vector direction. The total uncertainty value incorporates an estimate of the effect of a possibly poorly known velocity direction when assigning these accelerations the labels “parallel” or “perpendicular”. For example, the uncertainty on the parallel acceleration adds in quadrature the term , where is the uncertainty in the velocity direction in radians, and takes on a maximum value of 1.0 in this expression. An analogous term is added in quadrature to the statistical uncertainty for the perpendicular acceleration. In our previous papers, we listed the acceleration fit uncertainty alone, and did not include any additional error due to uncertainty in the vector motion direction. Instead, as described in Homan et al. (2009) and Homan et al. (2015), we limited our detailed acceleration analysis in those papers to jet features where the velocity direction was very well known and therefore the parallel and perpendicular assignments were unambiguous.
Of the 451 features in our current analysis with more than 10 epochs, 144 (32%) show significant accelerations, and an additional 87 show non-radial motions. Thus over half of the well-sampled jet features in our survey show evidence of non-ballistic motion. In agreement with our previous findings (Homan et al., 2009, 2015), apparent speed changes are larger and more prevalent than changes in direction, indicating that changes in Lorentz factor are more responsible for the observed accelerations than jet bends.
3. DISCUSSION
3.1. Jet Speed Distributions
We have calculated maximum and median speed statistics for all 274 AGN jets measured in this paper, and 48 AGNs in Lister et al. (2013), using the method described in the latter paper. For those AGNs that were analyzed in both papers, we used the kinematic results from the current paper. The combined set of 322 AGNs spans the full sky above declination , and all sources have at least Jy of VLBA correlated flux density at 15 GHz. Although the set is complete above 1.5 Jy (Lister et al., 2015) and at high -ray (time-averaged) fluxes (Lister et al., 2011), the selection is incomplete and non-uniform at lower radio flux densities, containing a sampling of gamma-ray-associated and un-associated AGNs, as well as lower-luminosity AGN targeted specifically to probe the relation between jet speed and radio luminosity (Lister et al., 2013). Because of the Jy VLBA limit at 15 GHz, the combined set of AGN has a substantial bias toward core-dominated, flat-spectrum radio sources, which are expected to be highly beamed. This is reflected in the optical classifications, which are dominated by blazars (i.e., flat spectrum radio quasars: 73% and BL Lac objects: 18%). There are also 22 radio galaxies and 5 narrow-lined Seyfert I (NLSY1) galaxies, and 4 AGNs with no optically identified counterparts. A total of 243 AGNs have published gamma-ray associations, which are listed in column 4 of Table 1.
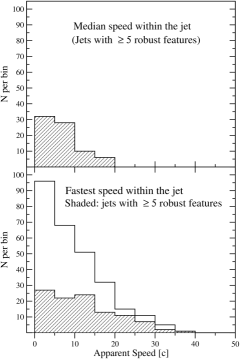
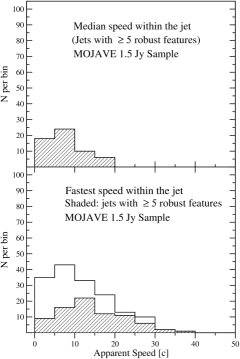
In Figure 6 we plot the speed distributions for the combined set of AGNs (left hand panels), and for the radio flux density-limited MOJAVE 1.5 Jy sample only (right hand panels). As discussed by Vermeulen & Cohen (1994) and Lister & Marscher (1997), the shape of the apparent speed distribution in a flux density-limited jet sample reflects the parent Lorentz factor distribution, which in this case, indicates a moderately steep parent power law, with fast jets being relatively rare. A more detailed analysis of the parent population properties will be presented in a future paper. Because of Doppler bias, the fastest apparent speeds in a large flux density-limited sample should also be indicative of the maximum bulk flow Lorentz factors in the parent population. The fastest overall jet speed we have measured in our survey to date is feature id = 2 in the quasar PKS 080507, with , corresponding to . In terms of angular expansion rate, the maximum values of our survey are limited to roughly due to our limited angular resolution and observing cadence. The fastest measured angular speed in our survey to date is , in the jet of the nearby () AGN 3C 120 (Lister et al., 2013).
We note that there are two accelerating features whose apparent speed exceeded at some point during our monitoring (the speeds listed in Table 5 are the instantaneous speeds at the midpoint epoch). These are feature id = 3 in PKS 080507, which had an initial speed of in 1996 and subsequently decelerated to , and feature id = 16 in PKS 151008, which attained a maximum speed of before fading in 2011.
In Lister et al. (2013), we identified 38 jet features as having slow pattern speeds, i.e., they had non-accelerating, angular speeds smaller than 20 , and a speed at least 10 times slower than the fastest feature in the same jet. With the addition of our new kinematics analysis, we now have identified a total of 63 such features (5% of all robust features), which we have flagged in Table 4.
3.2. Jet Speed and Gamma-Ray Emission
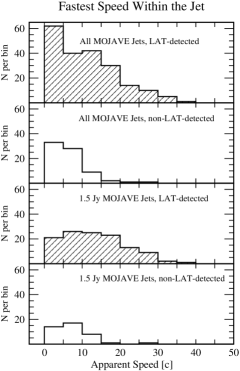
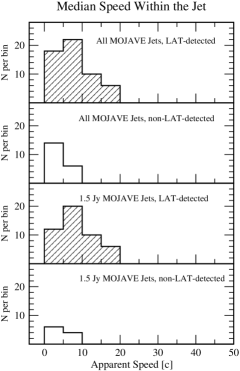
The most recent catalog of gamma-ray sources detected by the Fermi LAT instrument (3FGL: Acero et al. 2015) is highly dominated by blazars, due to the strong influence of relativistic beaming on jet gamma-ray emission. As discussed by Lister et al. (2015), based on data from Lister et al. (2013), nearly all of the fastest AGN jets in the MOJAVE program have been detected by Fermi, indicating a strong correlation between jet speed and gamma-ray Doppler boosting factor. Several fast jets have yet to be detected by Fermi because their spectral energy distribution peaks below the 100 MeV threshold of the LAT. In Figure 7, we show the distributions of fastest and median jet speed for our full MOJAVE sample (top panels), and our 1.5 Jy flux density-limited sample (lower panels), including our new speed data. In terms of the fastest measured speeds, there is a less than 0.02 % probability that the LAT and non-LAT sub-samples come from the same parent distribution according to Kolomogorov-Smirnov tests, in the case of both the full and MOJAVE 1.5 Jy flux density-limited samples.
3.3. Apparent Jet Speed Versus Redshift
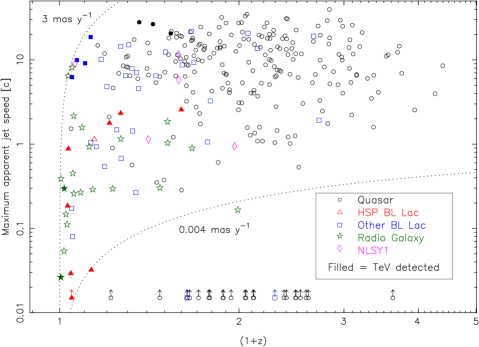
In Figure 8 we plot maximum measured apparent jet speed versus redshift for all jets measured by the MOJAVE program to date. For completeness, we also plot as lower limits equal to those AGN jets for which we were not able to identify any robust features for kinematics analysis, despite having at least 5 VLBA epochs.
This collection of AGNs represents those selected from the MOJAVE radio flux density-limited, gamma-ray-selected, and low-luminosity blazar samples. As such, it spans a very large range of redshift () and apparent radio luminosity (). At low redshifts, lower luminosity radio galaxies and BL Lac objects dominate, since high luminosity quasars are much rarer in the general AGN population (see, e.g., discussion of luminosity functions in Urry & Padovani 1995).
Our monthly observing cadence, total time baseline, and angular resolution set limits on the maximum and minimum observable angular proper motions, which we plot as dotted lines in Figure 8. We note that for , our survey is sensitive to extremely high jet speeds, yet there is a distinct upper envelope to the distribution. Since there must be a portion of the ultrafast AGN jet population that is oriented close to our line of sight, and such jets will be extremely bright due to enormous Doppler boosting of their radio flux density, the upper envelope in Figure 8 is a clear indication of an upper limit of in the bulk Lorentz factors in the pc-scale radio-emitting regions of AGN jets.
In Figure 8 we have also indicated with filled symbols those AGNs that have been detected at TeV gamma-ray energies. To date, there are roughly 60 known AGNs in this category333http://tevcat.uchicago.edu, and one third of these have been monitored by the MOJAVE program. Our plot illustrates the two types of known TeV AGN: i) BL Lac objects that have high TeV fluxes due to their proximity and the fact that their spectral energy distributions are peaked at high frequencies; and ii) other BL Lac objects and quasars with very fast jet speeds, indicating unusually high amounts of relativistic beaming. To date there have been no TeV detections of AGNs past due to the strong attenuation of high energy gamma-rays by pair production off of the extragalactic background light. This would suggest that a promising region to search for new TeV-emitting AGNs is in the top left corner of Figure 8, where and . This region includes the BL Lac objects PKS 0754+100, OJ 287 and OJ 049, the quasars 3C 273, OI 061, 4C +49.22, TXS 1700+685, and PKS 1725+044, the AGNs 3C 111 and 3C 120, and the NLSY1 1H 0323+342.
We have measured maximum jet speeds for 9 high spectral peaked (HSP) BL Lacs to date in the MOJAVE program (triangle symbols in Figure 8), all but one of which (7C 1055+5644) have been detected at TeV energies. Their apparent speeds are sub-luminal, ranging from in ON 325 to in OQ 240. This is in agreement with previous multi-epoch VLBI observations of a small number of TeV blazar jets at 8 GHz by Piner et al. (2008). We are currently obtaining multi-epoch MOJAVE observations of a much larger set of high-spectral peaked AGN detected by the Fermi -ray observatory in order to further investigate their speed distribution.
3.4. Radio-loud Narrow-Lined Seyfert I AGNs
The third Fermi AGN catalog (Ackermann et al., 2015) is comprised primarily of blazars, reflecting the strong influence of relativistic boosting on AGN gamma-ray emission. Apart from a small handful of nearby radio galaxies, the only other major AGN category in the Fermi catalog is radio-loud NLSY1 galaxies. To date fewer than a dozen gamma-ray-loud NLSY1s have been identified (Berton et al., 2015), but they are interesting objects since they appear to have many of the same characteristics as blazars, despite the fact that Seyferts are typically found in spiral host galaxies. The orientation of NLSY1s renders their broad line region visible, yet they display narrow permitted lines () due to their small black hole masses (). Therefore in order to produce blazar-like gamma-ray and radio luminosities, they must have high Eddington ratios. This has led to speculation that they might be young radio jets that have been recently fueled, and are perhaps the low-black-hole mass, low-viewing angle versions of compact symmetric AGNs (e.g., Kawakatu et al. 2009).
We have analyzed the pc-scale jet kinematics of five NLSY1s in the MOJAVE sample, all of which have been detected in gamma-rays by Fermi. Other groups (D’Ammando et al. 2012, 2013) have published simple one-dimensional radial-fit speeds for two of these AGNs using our MOJAVE data. We find that three of the NLSY1s show highly superluminal jet features ( for 1H 0323+342, for SBS 0846+513, and for PMN J0948+0022). The other two show kinematics consistent with sub-luminal speeds: for 4C +04.42 and for 1502+036. With this small sample size, it is impossible to draw any general conclusions about the population, but the high speeds indicate that at least some radio-loud NLSY1s have Lorentz factors in excess of 10, and viewing angles less than , consistent with those of BL Lac objects and flat-spectrum radio quasars.
4. SUMMARY
We have presented 1625 new 15 GHz VLBA contour images of 295 AGNs from the MOJAVE and 2cm VLBA surveys, spanning epochs from 1994 Aug 31 to 2013 Aug 20. For the 274 AGNs with at least 5 temporally-spaced epochs, we have analyzed the kinematics of individual bright features in the jets, and produced time-lapse linearly interpolated movies that show their parsec-scale evolution. At least half of the well-sampled features show non-radial and/or accelerating trajectories, indicating that non-ballistic motion is common. Since it is impossible to extrapolate any accelerations that occurred before our monitoring period or below our resolution level, we are only able to determine reliable ejection dates for of those features with significant proper motions.
The distribution of maximum jet speeds in all 295 AGNs measured by our program to date is peaked below , with very few jets with apparent speeds above . The fastest instantaneous measured speed in our survey is , measured in the jet of the quasar PKS 080507. The form of the speed distribution is indicative of a moderately steep power law distribution of Lorentz factors in the parent population, ranging up to . An upper envelope in the maximum speed versus redshift distribution provides additional evidence of this upper limit to AGN jet speeds in the pc-scale regime.
The Fermi LAT-detected gamma-ray AGNs in our sample have, on average, higher jet speeds than non LAT-detected AGNs, indicating a strong correlation between pc-scale jet speed and gamma-ray Doppler boosting factor. The known TeV gamma-ray emitting AGNs in our sample are clustered in two regions: namely at low redshift/low speeds, and at moderate redshift/high speeds. We have identified 11 AGNs in the latter region (, ) that are strong candidates for future TeV gamma-ray detection. Our AGN sample also includes 5 gamma-ray-loud NLSY1s, a rare type of low-black hole mass, high-accretion rate AGN that has been identified as a distinct population of gamma-ray emitting AGNs by Fermi. Of the five NLSY1s, three show highly superluminal jet motions, while the others have sub-luminal speeds. This indicates that radio-loud NLSY1 AGNs can possess powerful jets with high Lorentz factors and low viewing angles that are consistent with typical radio loud BL Lac objects and flat-spectrum radio quasars.
References
- Acero et al. (2015) Acero, F., et al. 2015, ApJS, 218, 23
- Ackermann et al. (2011) Ackermann, M., et al. 2011, ApJ, 743, 171
- Ackermann et al. (2015) —. 2015, ApJ, 810, 14
- An et al. (2016) An, T., Cui, Y.-Z., Gabanyi, K. E., Frey, S., Baan, W. A., & Zhao, W. 2016, ArXiv 1601.03859
- Berton et al. (2015) Berton, M., et al. 2015, ArXiv 1512.00171
- Blandford & Königl (1979) Blandford, R. D., & Königl, A. 1979, ApJ, 232, 34
- Blandford et al. (1977) Blandford, R. D., McKee, C. F., & Rees, M. J. 1977, Nature, 267, 211
- Carpenter et al. (2014) Carpenter, B., Ojha, R., D’Ammando, F., Orienti, M., & Cheung, C. C. 2014, The Astronomer’s Telegram, 5838, 1
- Casandjian & Grenier (2008) Casandjian, J.-M., & Grenier, I. A. 2008, A&A, 489, 849
- Cohen et al. (2015) Cohen, M. H., et al. 2015, ApJ, 803, 3
- Dallacasa et al. (2000) Dallacasa, D., Stanghellini, C., Centonza, M., & Fanti, R. 2000, A&A, 363, 887
- Dallacasa et al. (2002) Dallacasa, D., Tinti, S., Fanti, C., Fanti, R., Gregorini, L., Stanghellini, C., & Vigotti, M. 2002, A&A, 389, 115
- D’Ammando et al. (2012) D’Ammando, F., et al. 2012, MNRAS, 426, 317
- D’Ammando et al. (2013) —. 2013, MNRAS, 433, 952
- Deller & Middelberg (2014) Deller, A. T., & Middelberg, E. 2014, AJ, 147, 14
- Deller et al. (2011) Deller, A. T., et al. 2011, PASP, 123, 275
- Falomo (1990) Falomo, R. 1990, ApJ, 353, 114
- Fomalont (1999) Fomalont, E. B. 1999, in Astronomical Society of the Pacific Conference Series, Vol. 180, Synthesis Imaging in Radio Astronomy II, ed. G. B. Taylor, C. L. Carilli, & R. A. Perley, 301
- Fromm et al. (2013) Fromm, C. M., et al. 2013, A&A, 551, A32
- Gugliucci et al. (2005) Gugliucci, N. E., Taylor, G. B., Peck, A. B., & Giroletti, M. 2005, ApJ, 622, 136
- Hartman et al. (1999) Hartman, R. C., et al. 1999, ApJS, 123, 79
- Helmboldt et al. (2007) Helmboldt, J. F., et al. 2007, ApJ, 658, 203
- Homan et al. (2009) Homan, D. C., Kadler, M., Kellermann, K. I., Kovalev, Y. Y., Lister, M. L., Ros, E., Savolainen, T., & Zensus, J. A. 2009, ApJ, 706, 1253
- Homan et al. (2003) Homan, D. C., Lister, M. L., Kellermann, K. I., Cohen, M. H., Ros, E., Zensus, J. A., Kadler, M., & Vermeulen, R. C. 2003, ApJ, 589, L9
- Homan et al. (2015) Homan, D. C., Lister, M. L., Kovalev, Y. Y., Pushkarev, A. B., Savolainen, T., Kellermann, K. I., Richards, J. L., & Ros, E. 2015, ApJ, 798, 134
- Homan et al. (2002) Homan, D. C., Ojha, R., Wardle, J. F. C., Roberts, D. H., Aller, M. F., Aller, H. D., & Hughes, P. A. 2002, ApJ, 568, 99
- Hovatta et al. (2012) Hovatta, T., Lister, M. L., Aller, M. F., Aller, H. D., Homan, D. C., Kovalev, Y. Y., Pushkarev, A. B., & Savolainen, T. 2012, AJ, 144, 105
- Hovatta et al. (2014) Hovatta, T., et al. 2014, AJ, 147, 143
- Jones et al. (2005) Jones, D. H., Saunders, W., Read, M., & Colless, M. 2005, PASA, 22, 277
- Kawakatu et al. (2009) Kawakatu, N., Nagao, T., & Woo, J.-H. 2009, ApJ, 693, 1686
- Kellermann et al. (1998) Kellermann, K. I., Vermeulen, R. C., Zensus, J. A., & Cohen, M. H. 1998, AJ, 115, 1295
- Kellermann et al. (2004) Kellermann, K. I., et al. 2004, ApJ, 609, 539
- Komatsu et al. (2009) Komatsu, E., et al. 2009, ApJS, 180, 330
- Landoni et al. (2012) Landoni, M., Falomo, R., Treves, A., Sbarufatti, B., Decarli, R., Tavecchio, F., & Kotilainen, J. 2012, A&A, 543, A116
- Landoni et al. (2015) Landoni, M., Falomo, R., Treves, A., Scarpa, R., & Reverte Payá, D. 2015, AJ, 150, 181
- Lawrence et al. (1986) Lawrence, C. R., Pearson, T. J., Readhead, A. C. S., & Unwin, S. C. 1986, AJ, 91, 494
- Lawrence et al. (1996) Lawrence, C. R., Zucker, J. R., Readhead, A. C. S., Unwin, S. C., Pearson, T. J., & Xu, W. 1996, ApJS, 107, 541
- Linford et al. (2012) Linford, J. D., Taylor, G. B., Romani, R. W., Helmboldt, J. F., Readhead, A. C. S., Reeves, R., & Richards, J. L. 2012, ApJ, 744, 177
- Lister et al. (2015) Lister, M. L., Aller, M. F., Aller, H. D., Hovatta, T., Max-Moerbeck, W., Readhead, A. C. S., Richards, J. L., & Ros, E. 2015, ApJ, 810, L9
- Lister & Homan (2005) Lister, M. L., & Homan, D. C. 2005, AJ, 130, 1389
- Lister & Marscher (1997) Lister, M. L., & Marscher, A. P. 1997, ApJ, 476, 572
- Lister et al. (2009a) Lister, M. L., et al. 2009a, AJ, 137, 3718
- Lister et al. (2009b) —. 2009b, AJ, 138, 1874
- Lister et al. (2011) —. 2011, ApJ, 742, 27
- Lister et al. (2013) —. 2013, AJ, 146, 120
- Ludke et al. (1998) Ludke, E., Garrington, S. T., Spencer, R. E., Akujor, C. E., Muxlow, T. W. B., Sanghera, H. S., & Fanti, C. 1998, MNRAS, 299, 467
- Marr et al. (2001) Marr, J. M., Taylor, G. B., & Crawford, III, F. 2001, ApJ, 550, 160
- Paiano et al. (2016) Paiano, S., Landoni, M., Falomo, R., Scarpa, R., & Treves, A. 2016, ArXiv 1602.08703
- Perlman et al. (2002) Perlman, E. S., Stocke, J. T., Carilli, C. L., Sugiho, M., Tashiro, M., Madejski, G., Wang, Q. D., & Conway, J. 2002, AJ, 124, 2401
- Piner et al. (2008) Piner, B. G., Pant, N., & Edwards, P. G. 2008, ApJ, 678, 64
- Pushkarev et al. (2012) Pushkarev, A. B., Hovatta, T., Kovalev, Y. Y., Lister, M. L., Lobanov, A. P., Savolainen, T., & Zensus, J. A. 2012, A&A, 545, A113
- Pushkarev & Kovalev (2015) Pushkarev, A. B., & Kovalev, Y. Y. 2015, MNRAS, 452, 4274
- Pushkarev et al. (2013) Pushkarev, A. B., et al. 2013, A&A, 555, A80
- Rau et al. (2012) Rau, A., et al. 2012, A&A, 538, A26
- Rector & Stocke (2001) Rector, T. A., & Stocke, J. T. 2001, AJ, 122, 565
- Sargent (1970) Sargent, W. L. W. 1970, ApJ, 160, 405
- Sbarufatti et al. (2005) Sbarufatti, B., Treves, A., & Falomo, R. 2005, ApJ, 635, 173
- Schneider et al. (1999) Schneider, D. P., Schmidt, M., & Gunn, J. E. 1999, AJ, 117, 40
- Schramm et al. (1994) Schramm, K.-J., Borgeest, U., Kuehl, D., von Linde, J., Linnert, M. D., & Schramm, T. 1994, A&AS, 106, 349
- Shaw et al. (2009) Shaw, M. S., Romani, R. W., Healey, S. E., Cotter, G., Michelson, P. F., & Readhead, A. C. S. 2009, ApJ, 704, 477
- Shaw et al. (2012) Shaw, M. S., et al. 2012, ApJ, 748, 49
- Shaw et al. (2013) —. 2013, ApJ, 764, 135
- Shepherd (1997) Shepherd, M. C. 1997, in Astronomical Society of the Pacific Conference Series, Vol. 125, Astronomical Data Analysis Software and Systems VI, ed. G. Hunt & H. E. Payne (San Francisco: ASP), 77
- Stadnik & Romani (2014) Stadnik, M., & Romani, R. W. 2014, ApJ, 784, 151
- Stickel et al. (1993) Stickel, M., Fried, J. W., & Kuehr, H. 1993, A&AS, 98, 393
- Stickel & Kuhr (1993) Stickel, M., & Kuhr, H. 1993, A&AS, 101, 521
- Thompson et al. (1992) Thompson, D. J., Djorgovski, S., Vigotti, M., & Grueff, G. 1992, ApJS, 81, 1
- Titov et al. (2011) Titov, O., Jauncey, D. L., Johnston, H. M., Hunstead, R. W., & Christensen, L. 2011, AJ, 142, 165
- Urry & Padovani (1995) Urry, C. M., & Padovani, P. 1995, PASP, 107, 803
- Vermeulen & Cohen (1994) Vermeulen, R. C., & Cohen, M. H. 1994, ApJ, 430, 467
- Yao et al. (2015) Yao, S., Yuan, W., Zhou, H., Komossa, S., Zhang, J., Qiao, E., & Liu, B. 2015, MNRAS, 454, L16
- Zensus et al. (2002a) Zensus, J. A., Ros, E., Kellermann, K. I., Cohen, M. H., Vermeulen, R. C., & Kadler, M. 2002a, AJ, 124, 662
- Zensus et al. (2002b) —. 2002b, AJ, 124, 662