High pressure magnetic state of MnP probed by means of muon-spin rotation
Abstract
We report a detailed SR study of the pressure evolution of the magnetic order in the manganese based pnictide MnP, which has been recently found to undergo a superconducting transition under pressure once the magnetic ground state is suppressed. Using the muon as a volume sensitive local magnetic probe, we identify a ferromagnetic state as well as two incommensurate helical states (with propagation vectors aligned along the crystallographic and directions, respectively) which transform into each other through first order phase transitions as a function of pressure and temperature. Our data appear to support that the magnetic state from which superconductivity develops at higher pressures is an incommensurate helical phase.
pacs:
74.25.Bt, 74.62.Fj, 74.62.-c, 75.50.Ee, 75.50.Gg, 76.75.+iRecently, the binary pnictides CrAs and MnP have attracted much interest due to discovery of superconductivity induced by hydrostatic pressure.Wu_NatConn_2014 ; Kotegawa_JPSJ_2014 ; Kotegawa_PRL_2015 ; Cheng_PRL_2015 The helical magnet CrAs becomes superconducting for pressures exceeding GPa, whereas MnP possesses a critical pressure GPa at which magnetism disappears and superconductivity sets in. For CrAs, in the pressure range of GPa, one observes a phase separation between magnetic and paramagnetic volumes, with the latter becoming superconducting with a critical temperature K. Above GPa the helical magnetic order vanishes and superconductivity below sets in within the whole sample volume.Khasanov_SciRep_2015 Note that in CrAs the single type of helical magnetic order remains unchanged as a function pressure.Khasanov_SciRep_2015 . In comparison to CrAs, MnP possesses a more complicated phase diagram.Cheng_PRL_2015 At ambient pressure, MnP orders ferromagnetically at K with the Mn magnetic moments aligned along the crystallographic direction (according to the crystallographic group 62 with lattice constants ).Huber_PR_1964 ; Felcher_JAP_1966 ; Yamazaki_JPSJ_2014 The ordered moment is per Mn atom.Huber_PR_1964 ; Obara_JPSJ_1980 At lower temperatures ( K) another transition in a double-spiral helical structure is reported.Felcher_JAP_1966 ; Obara_JPSJ_1980 ; Forsyth_PPS_1966 In this helimagnetic state (helical state, Ref. Matsuda_Arxiv_2016, ) the Mn moments are rotated within the -plane (helical plane) with the propagation vector .Felcher_JAP_1966 By increasing pressure the helical phase vanishes at GPa and a new magnetic phase emerges for GPa.Cheng_PRL_2015 In a narrow pressure region close to a critical pressure , at which the new magnetic phase disappears, superconductivity is found below 1 K. It was suggested, there is a quantum critical point at and that the quantum fluctuations persisting above give rise to occurrence of superconductivity.Cheng_PRL_2015 Therefore, it is important to characterize the high-pressure (HP) magnetic state of MnP from which superconductivity emerges. At present, there are three reports based on the results of non-resonant x-ray, NMR, and neutron diffraction experiments pointing to a helical magnetic order.Matsuda_Arxiv_2016 ; Wang_Arxiv_2015 ; Fan_ScChin_2016 Note, that the NMR study does not allow one to identify the order, while the non-resonant x-ray and neutron diffraction experiments disagree on the type of HP helix. While the x-ray study points to a similar helical structure as the one at ambient pressure, the neutron diffraction study suggests that a conical or two-phase structure with develops and it gradually changes to the so-called helical structure with Mn moments rotating within the -plane.
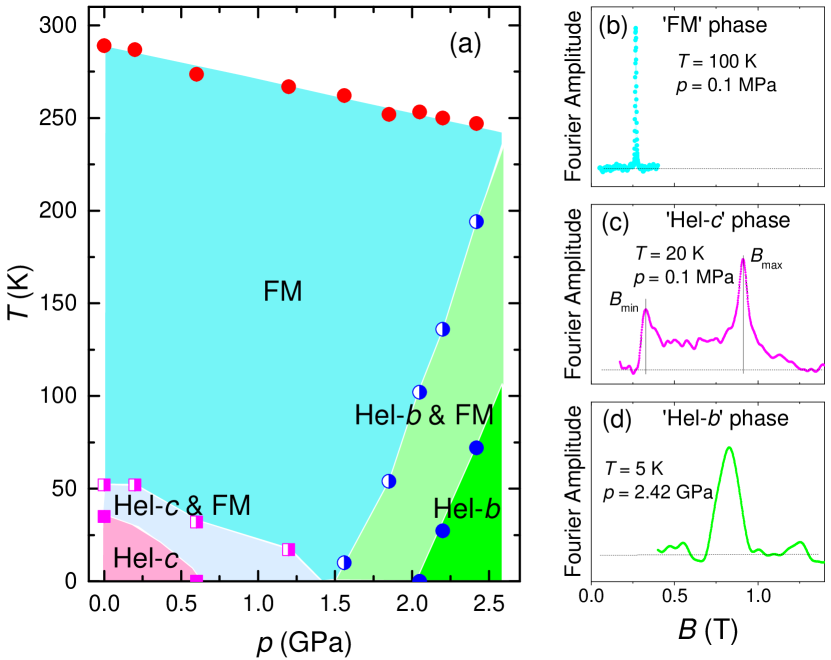
In this paper we report on a detailed study of the evolution of magnetic properties of MnP as a function of temperature ( K) and pressure ( GPa) by means of muon-spin rotation (SR). The resulting phase diagram (Fig. 1 a) consists of three areas corresponding to the ferromagnetic (FM), the helical (Hel) and the helical (Hel) orders with the corresponding field distributions [’s] presented in Figs. 1 b, c and d, respectively. The phases FM/Hel as well as FM/Hel are found to coexist within broad range of pressures and temperatures. Transitions from the high-temperature FM to the low-temperature low-pressure (LT-LP) Hel, or the low-temperature high-pressure (LT-HP) Hel phases are first-order like. Our experiments appear to confirm that in MnP the high-pressure magnetic phase which is the precursor of the superconducting state is the incommensurate helical.
The magnetic response of MnP polycrystalline sample was studied in zero field (ZF) and weak transverse field (wTF) SR experiments. A detailed description of SR experiments under pressure, the construction of the pressure cell etc. are given in Ref. Khasanov_HPR_2016, . In the following we discuss the SR data for the lowest (0.1 MPa) and the highest (2.42 GPa) pressures.
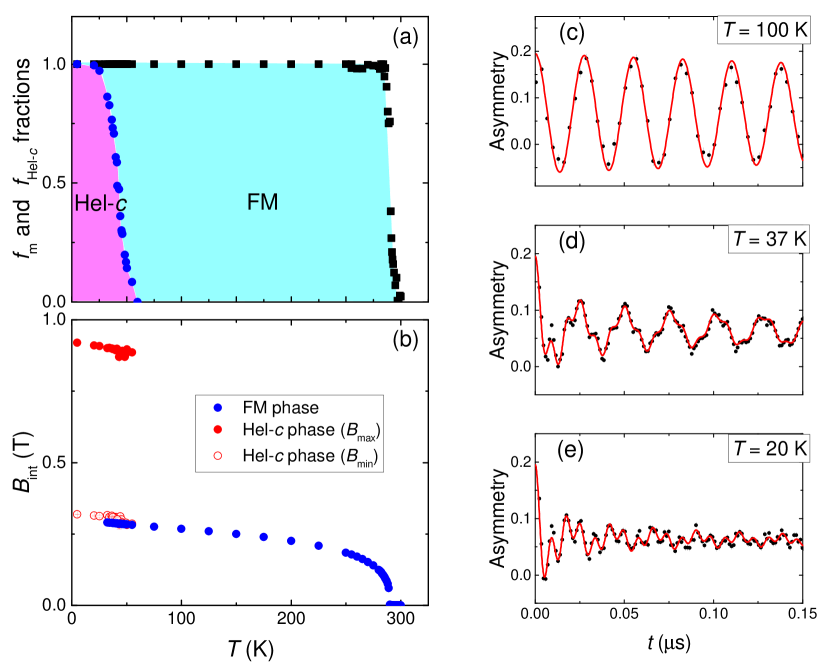
At ambient pressure, transitions to two different magnetic states are detected (Fig. 2 a). The first one at K corresponds to the ferromagnetic order.Huber_PR_1964 ; Felcher_JAP_1966 The spontaneous muon-spin precession is clearly observed in the ZF SR asymmetry spectra [, Fig. 2 c]. The oscillatory part of is well fitted by an exponentially decaying cosine function with a zero initial phase (see the Supplementary part), thus evidencing that the magnetic order is commensurate.Yaouanc_book_11 In the LT-LP region, K, the oscillatory part of is accurately described by a field distribution characterized by a minimum () and a maximum () cutoff fields (see Figs. 1 c and 2 e), which is consistent with the incommensurate helimagnetic order.Schenk_PRB_2001 In a broad range of temperatures ( K) both orders are detected simultaneously (Fig. 2 d). Being a volume sensitive local probe technique, SR allows to follow the temperature evolution of both magnetic phases as demonstrated in Fig. 2 a. The corresponding internal fields in the FM () and Hel (, ) phases are presented in Fig. 2 b. The internal magnetic field in the FM phase (i.e., the FM magnetic order parameter) decreases with increasing temperature and vanishes at . Analyzing the data with a power law
| (1) |
yields K, T, and . The value of lies quite close to the critical exponent expected for a second order phase transition in a 3D magnetic system. Jongh_AdvPhys_1974 In contrast, both and , which are measures of the magnetic order parameter of the Hel state, abruptly drop to zero at the phase transition (Fig. 2 b). This, together with the coexistence of the FM and Hel phases in a relatively large temperature region of K indicates the first order character of the transition.
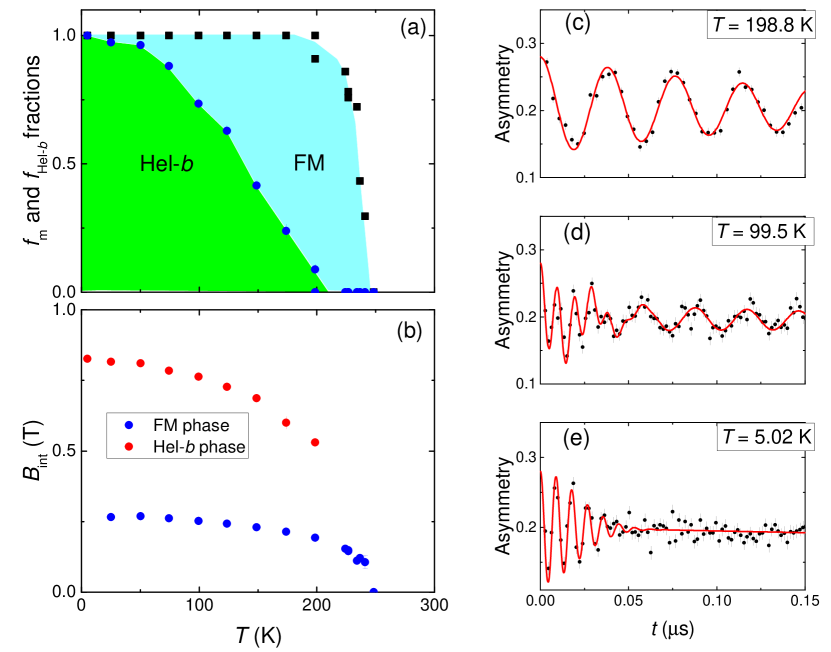
At GPa, the transition into the FM state is clearly detected via the observation of a spontaneous muon-spin precession frequency for temperatures below 250 K. Upon decreasing the temperature, another phase, with an internal field approximately 2.5 times higher, starts to develop for K and occupies the full sample volume for K (Figs. 3a and b). This phase corresponds to the ‘unknown antiferromagnetic’ phase which was first reported in Ref. Cheng_PRL_2015, . A preliminary analysis reveals that the oscillatory part of the SR signal in the LT-HP phase is well fitted by the Gaussian decaying cosine function with zero initial phase. The temperature dependences of the magnetic volume fractions and the internals fields obtained for the FM and LT-HP phases are shown in Figs. 3 a and b. The asymmetry spectra taken at K (FM phase), K (mixture of FM and LT-HP magnetic phases), and K (LT-HP magnetic phase) are shown in panel c, d, and e, respectively.
At first glance the ambient pressure and GPa data presented in Figs. 2 and 3 look similar. Indeed, (i) in both cases the ferromagnetic phase observed at high temperatures is fully replaced by a LT phase. (ii) within a broad range of temperatures the ferromagnetic and LT phases coexist. (iii) the appearance of the LT phase is always associated with an abrupt change of the internal field (magnetic order parameter), i.e. there is a first order transition between the FM and both LT phases.
There is, however, an important difference between them. At ambient pressure the Mn moments form the so-called ‘double helical’ structure with the propagation vector . Considering 4 Mn atoms per unit cell, the term ‘double helical’ means that the Mn spins are coupled in pairs (Mn1/Mn4 and Mn2/Mn3), and rotate with a constant phase difference between the different pairs along (see Ref. Felcher_JAP_1966, ). Such an incommensurate magnetic structure leads to a field distribution given by: Schenk_PRB_2001
| (2) |
and is characterized by two peaks at a minimum () and a maximum() cutoff field (Fig. 1 c).
The magnetic field distribution in the LT-HP phase is, however, different. It is characterized by a single symmetric line (Fig. 1 d), though with a very broad width. At first glance such is inconsistent with the helical order. However, as shown below, the unique situation realized in MnP may lead to the formation of a quasi-single peak structure. In short, in MnP muons stop at four well defined interstitial lattice sites within the unit cell. The SR asymmetry spectra consists, therefore, of four contributions with each of them characterized by its own and fields and corresponding ’s described by Eq. (2). Under certain conditions which, as shown in the Supplementary part, are fulfilled in MnP for a helical magnetic order, the sum of the four asymmetric distributions results in a single broad symmetric line.
The exact spin arrangement of the LT-HP magnetic phase is currently under debate. It is also not clear whether this phase has a non-zero net magnetic moment. Following Fig. S2 in the Supplementary part of Ref. Cheng_PRL_2015, the ferromagnetic component of the LT-HP phase might be quite substantial and correspond to % of that in the FM phase. The authors of Ref. Matsuda_Arxiv_2016, have also suggested a conical magnetic structure for GPa with a ferromagnetic component gradually decreasing with decreasing temperature and increasing pressure. We checked for a possible ferromagnetic component by studying the pressure cell response in a wTF SR experiments. Note that the spins of the muons stopping in the pressure cell containing the magnetic sample will undergo a precession around the vector sum of the weak externally applied field and the straight fields induced by the sample. If these straight fields are sizable and inhomogeneous, as expected around a ferromagnetic sample, the SR signal of the muons stopping in the cell will exhibit a relaxation due to dephasing.Maisuradze_PRB_2011
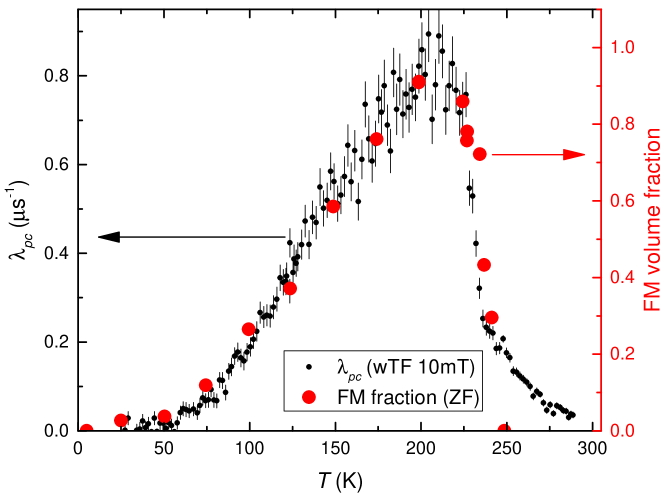
Figure 4 shows the temperature dependence of an additional exponential relaxation of the spin polarization for the muons stopping in the pressure cell (). The magnetic field mT, transverse to the initial muon-spin polarization, was applied at K (above the magnetic transition). For comparison we also plot in this graph the temperature evolution of the ferromagnetic volume fraction () as obtained in ZF SR experiments (Fig. 3a). Below K follows exactly . With decreasing temperature both quantities first increase, thus showing the formation of the FM phase. Both, and , saturate at K, and then decrease almost linearly with temperature decrease from K down to K. Below 50 K, where the FM phase completely vanishes, the signal of the pressure cell becomes unaffected by the sample. This proves that the magnetic order induced by high pressure in MnP sample possesses no sizable ferromagnetic component and allows one to exclude from the consideration the conical magnetic structure.
Additional experiments performed in the intermediate range of pressures (, 0.6, 1.2, 1.56, 1.8, 2.05, and 2.20 GPa) allow us to construct the full phase diagram as shown in Fig. 1a. It resembles the one reported in Ref. Cheng_PRL_2015, , with, however, some important differences. Firstly, the transition temperature of the FM state changes quite monotonically with pressure without a pronounced slope change at GPa. The slope K/GPa is in agreement with the results of Banus Banus_JSSCh_1972 reporting K/GPa for pressures ranging GPa. Secondly, there is a broad temperature range where FM and Hel (LT-LP), and FM and Hel (LT-HP) orders coexist. We do not detect, however, any coexistence of Hel and Hel magnetic orders.
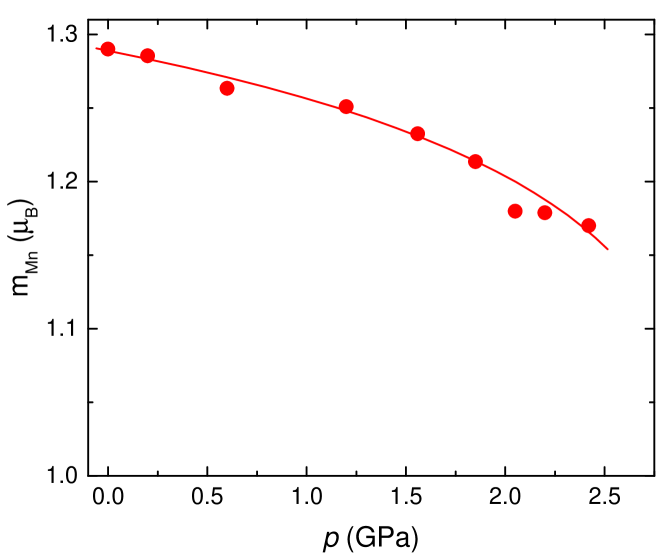
All above conclusions do not require any particular modeling and are obvious already from the SR raw data. To obtain more quantitative information calculations of local fields () at the muon stopping sites were carried out. The muon site was determined based on the density-functional theory (DFT) approach, which was shown to accurately determine the muon sites in different materials as e.g. wide-gap semiconductors, insulating systems or cuprate and iron-based high- superconductors. Bernardini_PRB_2013 ; Moller_PRB_2013 ; Blundell_PRB_2013 ; Moller_PhScr_2013 ; Amato_PRB_2014 ; Martin_Arxiv_2016 There are four equivalent minima in the unit cell corresponding to the 4c [, , ] Wyckoff position (see the Supplementary part). The calculations were started from the known FM and Hel magnetic structures at ambient pressure (see Refs. Huber_PR_1964, ; Felcher_JAP_1966, ; Obara_JPSJ_1980, ; Forsyth_PPS_1966, ). From this first step one could determine the coupling contact constant . As a next step, by assuming and the relative positions of Mn ions and muon within the unit cell are pressure independent, as well as accounting for the pressure reduction of lattice constants,Wang_Arxiv_2015 the pressure dependence of the ordered moment in the FM state was calculated (Fig. 5). The internal field at was obtained from the fit of by means of Eq. 1 measured at each particular pressure . We have also checked for consistency of the LT-HP magnetic phase with 3 possible collinear antiferromagnetic structures reported in Ref. Gercsi_PRB_2010, and the helical structure proposed in Ref. Wang_Arxiv_2015, . The analysis reveals that none of them are consistent with the experimental data (see the Supplementary part).
To test whether the helical structure proposed in Ref. Matsuda_Arxiv_2016, is compatible with our data, we started first by calculating the and fields for each particular muon site in the range of and . Here is the component of the propagation vector (the positive and the negative sign correspond to a right and a left-handed helix, respectively) and is the eccentricity of the elliptical helical structure ( and are components of along the and axis, respectively). With such determined sets of ’s and ’s the experimental asymmetry spectra were fitted. The correlation plots and allow us to check for the range of consistency of helical structure with the experimental data and to obtain the value of the average moment . With (Ref. Matsuda_Arxiv_2016, ), and were found to range and , respectively. Note that the value of in the helical state is close to that determined in the ferromagnetic state . The details of calculations are summarized in the Supplementary Information.
To conclude, the muon-spin rotation measurements of MnP under the pressure up to GPa were carried out. The ferromagnetic ordering temperature and the value of the ordered Mn moments decrease with the pressure increase from K and at MPa, to K and at GPa, respectively. For pressures in the region GPa the ferromagnetic and the LT-HP helical types of magnetic order were clearly detected. The helical order becomes completely suppressed for pressures exceeding 1.5 GPa. Above this pressure the third magnetic phase, the helical phase,Matsuda_Arxiv_2016 starts to grow. The transition temperature and the volume fraction of the helical phase increase continuously with increasing pressure. At Ga the helical phase was clearly detected up to K. Pairs of phases, FM/Hel and FM/Hel, coexist within broad range of pressures and temperatures. Transitions from the HT FM to the LT-LP helical, or the LT-HP helical phases are first-order like.
The work was fully performed at the Swiss Muon Source (SS), PSI, Villigen. The work of ZG was supported by the Swiss National Science Foundation (SNF-Grant 200021-149486). PB thanks the computing resources provided by CINECA within the Scientific Computational Project CINECA ISCRA Class C (Award HP10C5EHG5, 2015) and STFC’s Scientific Computing Department. The work PB and RdR was supported by the grants from MUON JRA of EU FP7 NMI3, under grant agreement 226507.
References
- (1) W. Wu, J. Cheng, K. Matsubayashi, P. Kong, F. Lin, C. Jin, N. Wang, Y. Uwatoko, and J. Luo, Nature Commun. 5, 5508 (2014).
- (2) H. Kotegawa, S. Nakahara, H. Tou, and H. Sugawara, J. Phys. Soc. Jpn. 83, 093702 (2014).
- (3) H. Kotegawa, S. Nakahara, R. Akamatsu, H. Tou, H. Sugawara, and H. Harima, Phys. Rev. Lett. 114, 117002 (2015).
- (4) J.-G. Cheng, K. Matsubayashi, W. Wu, J.P. Sun, F.K. Lin, J.L. Luo, and Y. Uwatoko Phys. Rev. Lett. 114, 117001 (2015).
- (5) R. Khasanov, Z. Guguchia, I. Eremin, H. Luetkens, A. Amato, P.K. Biswas, C. Rüegg, M.A. Susner, S.S. Athena S, N.D. Zhigadlo, and E. Morenzoni, Scientific Reports 5, 13788 (2015).
- (6) E.E. Huber and D. H. Ridgley, Phys. Rev. 135, 1033 (1964).
- (7) G. Felcher, J. Appl. Phys. 37, 1056 (1966).
- (8) T. Yamazaki, Y. Tabata, T. Waki, T. J Sato, M. Matsuura, K. Ohoyama, M. Yokoyama, and H. Nakamura, J.Phys. Soc. Jpn. 83, 054711 (2014).
- (9) H. Obara, Y. Endoh, Y. Ishikawa, and T. Komatsubara, J. Phys. Soc. Jpn. 49, 928 (1980).
- (10) J. Forsyth, S. Pickart, and P. Brown, Proc. Phys. Soc. 88, 333 (1966).
- (11) M. Matsuda, F. Ye, S. E. Dissanayake, J.-G. Cheng, S. Chi, J. Ma, H. D. Zhou, J.-Q. Yan, S. Kasamatsu, O. Sugino, T. Kato, K. Matsubayashi, T. Okada, Y. Uwatoko arXiv:1602.09003.
- (12) Y. Wang, Y. Feng, J.-G. Cheng, W. Wu, J.L. Luo, and T.F. Rosenbaum, arXiv:1511.09152.
- (13) G.Z. Fan, B. Zhao, W. Wu, P. Zheng, and J.L. Luo, Sci. China-Phys. Mech. Astron. 59, 657403 (2016).
- (14) R. Khasanov, Z. Guguchia, A. Maisuradze, D. Andreica, M. Elender, A. Raselli, Z. Shermadini, T. Goko, E. Morenzoni, A. Amato, to appear in High Pressure Research (2016).
- (15) Yaouanc, A. & Dalmas de Réotier, P. Muon Spin Rotation, Relaxation and Resonance: Applications to Condensed Matter (Oxford University Press, Oxford, 2011).
- (16) A. Schenck, D. Andreica, F.N. Gygax, and H.R. Ott, Phys. Rev. B 65, 024444 (2001).
- (17) L.J. De Jongh and A.R. Miedema, Adv. Phys. 23, 1 (1974).
- (18) A. Maisuradze, A. Shengelaya, A. Amato, E. Pomjakushina, and H. Keller, Phys. Rev. B 84, 184523 (2011).
- (19) M.D. Banus, J. Solid State Chem. 4, 391 (1972).
- (20) F. Bernardini, P. Bonfa, S. Massidda, and R. De Renzi, Phys. Rev. B 87, 115148 (2013).
- (21) J.S. Möller, D. Ceresoli, T. Lancaster, N. Marzari, and S. J. Blundell, Phys. Rev. B 87, 121108(R) (2013).
- (22) S.J. Blundell, J.S. Möller, T. Lancaster, P.J. Baker, F.L. Pratt, G. Seber, and P.M. Lahti, Phys. Rev. B 88, 064423 (2013).
- (23) J.S. Möller, P. Bonfa, D. Ceresoli, F. Bernardini, S.J. Blundell, T. Lancaster, R. De Renzi, N. Marzari, I.Watanabe, S. Sulaiman, and M. I. Mohamed-Ibrahim, Phys. Scr. 88, 068510 (2013).
- (24) A. Amato, P. Dalmas de Réotier, D. Andreica, A. Yaouanc, A. Suter, G. Lapertot, I.M. Pop, E. Morenzoni, P. Bonfa, F. Bernardini, and R. De Renzi, Phys. Rev. B 89, 184425 (2014).
- (25) N. Martin, M. Deutsch, F. Bert, D. Andreica, A. Amato, P. Bonfa, R. De Renzi, U.K. Rössler, P. Bonville, L.N. Fomicheva, A.V. Tsvyashchenko, and I. Mirebeau, arXiv:1602.01756.
- (26) Z. Gercsi and K. G. Sandeman, Phys. Rev. B 81, 224426 (2010).
Supplementary Information
.1 Sample preparation
The manganese phosphide (MnP) polycrystalline sample was synthesized by using a high-pressure furnace. Overall details of the sample cell assembly and high-pressure synthesis process can be found in Ref. S, 1. The mixture of manganese powder (99.99%) and red phosphorus powder (99.999%) in a molar ratio 1:1 was enclosed in a boron-nitride crucible and placed inside a pyrophyllite cube with a graphite heater. All the preparatory steps were done in a glove box under argon atmosphere. In a typical run, the sample was compressed up to 1 GPa at room temperature. While keeping pressure constant, the temperature was ramped up within 3 h to the maximum value of 1200 oC, kept stable for 1 h, then cooled to 950 oC in 14 h and finally quenched to the room temperature. Afterwards, the pressure was released and the final solid product removed. Subsequently recorded x-ray powder diffraction patterns showed no secondary phases.
.2 Experimental Techniques
.2.1 Pressure Cell
The pressure was generated in a double-wall piston-cylinder type of cell made of MP35N alloy. As a pressure transmitting medium 7373 Daphne oil was used. The pressure was measured in situ by monitoring the pressure shift of the superconducting transition temperature of In. The details of the experimental setup for conducting SR under pressure experiments are given in Ref. S, 2.
.2.2 Muon-spin rotation
SR measurements at zero field (ZF) and field applied transverse to the initial muon-spin polarization were performed at the M3 and E1 beamlines (Paul Scherrer Institute, Villigen, Switzerland), by using the dedicated GPS and GPDS (2) spectrometers, respectively. At the GPS spectrometer, equipped with continues flow 4He cryostat, ZF experiments at ambient pressure and down to temperatures K were carried out. At the GPD spectrometer, equipped with continuous flow 4He cryostat (base temperature K), ZF, and 10 mT weak transverse field (wTF) SR experiments under pressure up to 2.4 GPa were conducted. All ZF experiments were performed by stabilizing the temperature prior to recording the muon-time spectra. In wTF experiments the temperature was swept up with the rate K/min. The data were collected continuously. Each muon-time spectra was recorded during approximately 5 minutes.
.3 ZF SR data analysis procedure
At ambient pressure MnP is either in the paramagnetic state (PM, K) or exhibits ferromagnetic (FM, K) or helical-c (Hel, K) magnetic order.
In the PM state the muon-spin polarization is well described by the single exponential decay function:
| (S1) |
Here is the exponential relaxation rate.
In the FM state the muon-spin polarization follows:
| (S2) |
where is the internal field on the muon stopping site, MHz/T is the muon gyromagnetic ratio, and and are the transverse and the longitudinal exponential relaxation rates, respectively. The occurrence of 2/3 oscillating and 1/3 non oscillating SR signal fractions originates from the spatial averaging in powder samples, where 2/3 of the magnetic field components are perpendicular to the muon-spin and cause a precession, while the 1/3 longitudinal field components do not.
In the helical state the magnetic field distribution is characterized by two peaks due to the minimum () and maximum() cutoff fields (see the Fig. 1c in the main text). Following Ref. S, 3 the muon-spin polarization for the helical type of magnetic order is well described as:
Here is the zeroth order Bessel function of the first kind, and the widths of the distribution and the average field are and , respectively.
Considering three above described states the ZF-SR asymmetry spectra of MnP at ambient pressure were analyzed as:
Here is the initial asymmetry at , and and are the total magnetic volume fraction and the volume fraction of the helical phase, respectively.
In pressure experiments a large fraction of the muons, roughly 50%, stops in the pressure cell walls. The fit function consists of the ”sample” and the background (pressure cell) contributions and is described as:
| (S5) |
Here and are the initial asymmetries and and are the muon-spin polarizations belonging to the sample and the pressure cell, respectively. The polarization of the pressure cell is generally studied in separated set of experiments.S (2)
For pressures ranging from 0.1 MPa to GPa, where the MnP sample obeys transition from the FM to the Hel state (see Fig. 1 a), the sample response was analyzed by using Eq. .3 with the individual components described by Eqs. S1, S2, and .3, respectively.
For pressures above GPa the response of the sample in the Hel phase, was found to be well described as:
| (S6) |
where is the transverse Gaussian relaxation rate. The average internal field in the Hel phase is approximately 2.5 times higher than that in the FM phase (, Figs. 3 b, c and e in the main text). Such big difference allows us easy to distinguish between contributions of FM and Hel phases in the SR asymmetry spectra. Fits were made by using Eq. .3 with the ’Hel‘ part replaced by the ’Hel‘ one and the individual components were described by Eqs. S1, S2, and S6, respectively.
.4 wTF SR data analysis procedure
Samples with a strong magnetization placed in a pressure cell may induce a magnetic field in the space around the sample. Typical examples of such samples are superconductors (strong diamagnets), superparamagnets, and ferro- or ferrimagnets. Thus, muons stopping in a pressure cell containing the sample will undergo precession in the vector sum of the applied field and the field induced by the sample. This spatially inhomogeneous field leads to an additional depolarization of the muon spin polarization, which depends on the applied field and the induced field together with the spatial stopping distribution of the muons.S (4)
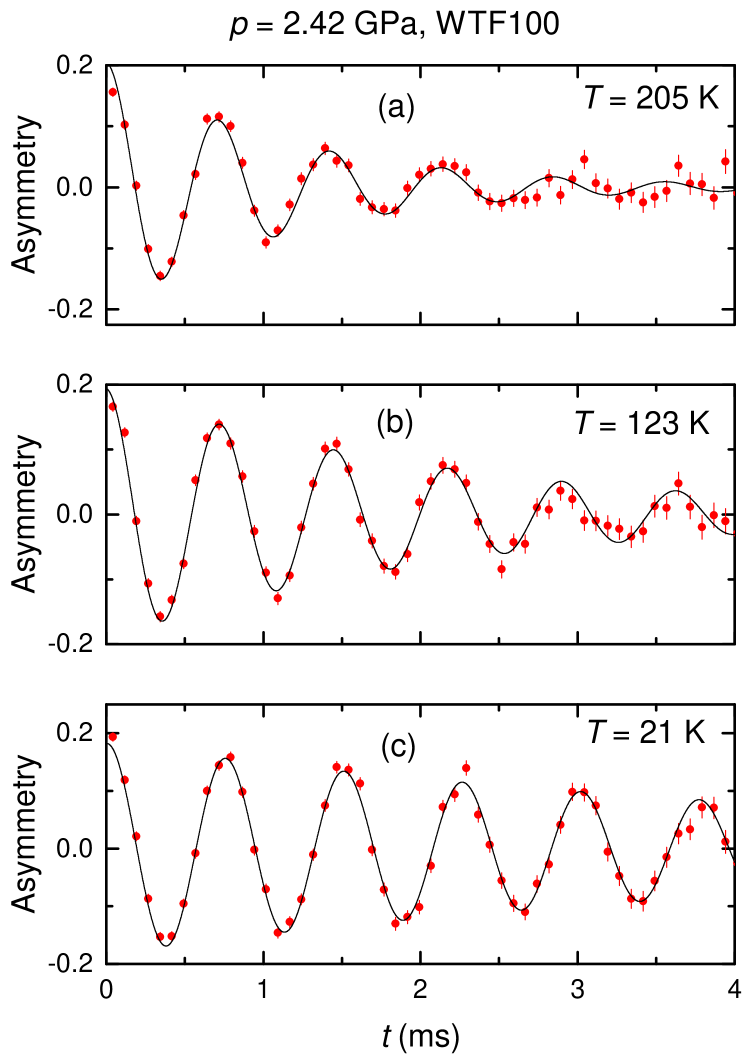
Figure S1 shows weak-transverse field (wTF) SR asymmetry spectra taken at GPa and K (panel a), 123 K (panel b) and 21 K (panel c). The magnetic field mT was applied at K (above the magnetic transition). Note that signals in Fig. S1 are mostly determined by the muons stopped in the pressure cell walls. The sample contribution, with internal fields mT in the FM state or mT in the Hel state, is suppressed with the proper selection of ’binning‘ [data points were grouped together with the corresponding final step of ns ( mT)]. Obviously, at K there is a strong influence of the sample magnetization on the pressure cell response. It becomes much weaker at K and vanishes at K. Note that at K the signal corresponds to the undistorted pressure cell response.
The data presented in Fig. S1 were analyzed by using the following functional form:
| (S7) |
Here is the Gaussian relaxation rate caused by nuclear moments and is the exponential relaxation reflecting the influence of the sample on the pressure cell.
.5 Internal fields on muon stopping sites
.5.1 MnP unit cell
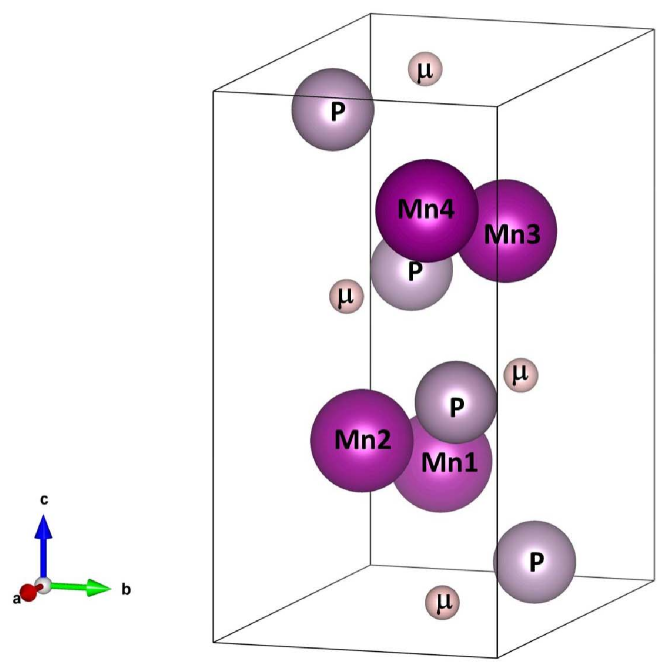
The orthorhombic crystal structure of MnP (, 62) is shown in Fig. S2. The unit cell dimensions are Å, Å and Å at ambient pressure and room temperature. Both the Mn and the P atoms occupy the crystallographic positions with , and , .S (5)
.5.2 Muon stopping sites
The ab initio identification of the muon stopping site was performed with the method described in Ref. S, 7. The description of the electronic density was obtained with DFT using a plane wave and pseudopotential approach as implemented in the Quantum ESPRESSO suite of codes.S (8) The reciprocal space was sampled with a Monkhorst-Pack grid.S (9) The exchange-correlation functional of Perdew, Burke, and Ernzerhof and the Methfessel-Paxton scheme with 0.01 Ry smearing were used.S (10, 11, 12) The ultrasoft pseudopotentials described in Ref. S (13) and a basis set expanded up to a kinetic-energy cutoff of 70 Ry and up to 500 Ry for charge density were adopted.
These settings guarantee an accurate description of the crystalline structure of the material. In the collinear spin formalism, at ambient pressure, the ferromagnetic state has the lowest enthalpy and it is therefore consider as the ground state for the structural relaxations of the impurity in the suprecells.
A supercell containing 129 atoms (including the muon which is described as a hydrogen atom) is used to locate the possible interstitial embedding positions occupied by the muon. To get a reasonable compromise between speed and accuracy, the kinetic energy cutoff and the charge density cutoff were reduced to 60 Ry and 400 Ry respectively. The Baldereschi point was used to sample the reciprocal space.S (14) The lattice cell parameters were kept fixed during the relaxation.
A grid of initial interstitial positions was selected to explore the whole interstitial space of the unit cell and identify all the possible embedding sites. After removing the positions too close to the atoms of the hosting system (less than 1 Å) and disregarding symmetry equivalent sites, the set of 9 interstitial locations was obtained. The structural relaxations were performed with the convergence criteria set to Ry for the total energy and to Ry/a.u. for forces. Five interstitial positions have been identified with this procedure. The total energy differences between the possible interstitial sites is reported in Table 1.
| Candidate muon site | Position | (eV) |
| Site 1 | (0.103, 0.25, 0.921) | 0 |
| Site 2 | (0.486, 0.935, 0.938) | 0.8 |
| Site 3 | (0.549, 0.75, 0.954) | 0.8 |
| Site 4 | (0.93, 0.25, 0.726) | 0.3 |
| Site 5 | (0.772, 0.04, 0.672) | 0.4 |
The identification of multiple candidate sites is not an unexpected feature of DFT based muon site assignements.S (7, 15, 16, 17, 18) This is partially caused by the structural optimization algorithm which neglects both the zero point motion energy of the muon and the effects of temperature. Molecular dynamics approaches would substantially improve the accuracy of the results, but they would also result in a tremendous increase of the computational costs. The selected convergence criteria may also cause the relaxation algorithm to stop in configurations which are not real minima but rather constitute a flat area between different interstitial positions.
Since only one frequency is observed in the FM phase of MnP, it is reasonable to assume that only one fully populated muon site is present in this material. Simulations performed with the double adiabatic approximation and the exploration algorithm discussed in Ref. S, 7 show that the energy barrier binding the muon in site 1 is larger than 0.5 eV while the same analysis shows that sites 4 and 5 cannot bind a muon since their energy barriers are of the order of 0.1 eV. Site 1 was therefore selected for the subsequent analysis of the experimental data (see Fig. S2).
.5.3 Local field on the muon stopping site
Muons probe the local field, which is the vector sum of the internal (dipolar) magnetic field and the contact field at a particular site. The spontaneous local field for the site was calculated as:
| (S8) |
The dipolar magnetic field at position within the lattice unit cell is:S (19)
| (S9) |
Here , and denote the vector components , , and , is the position of th magnetic ion in the unit cell, and is the corresponding dipolar moment. The summation is taken over a sufficiently large Lorentz sphere of radius .
The contact field was obtained as:
| (S10) |
where is the coupling contact constant, are nearest neighboring magnetic moments and is weight obtained as with being distance between the muon and -th magnetic moment.
The contact field was calculated by using Eq. S10 by considering 3 nearest neighbours for each particular muon site.
.5.4 Comparison of the HP-LT magnetic phase with the helical structure from Ref. S, 20 and collinear AFM structures from Ref. S, 21
The calculations of the local fields on the muon sites were started from the known ferromagnetic and double helical magnetic structures at ambient pressure (see Refs. S, 22, 23, 24, 25). This allows us to determine the coupling contact constant . Using the so determined and assuming that the relative positions of Mn atoms and muons are independent on pressure, the pressure dependence of Mn moment in the FM state (Fig. 5 in the main text) was obtained. The pressure dependence of the lattice constants , , and was taken from Ref. S, 20.
Calculations of the local fields at the muon sites for HP helical structure with the propagation vector , suggested in Ref. S, 20, were performed by assuming that the coupling contact constant and the relative positions of Mn atoms and muons are independent on pressure. With per Mn atom two pairs of helical distributions with / field 0.194/0.783 T and 0.236/0.587 T were obtained, which is inconsistent with the single-peak field distribution presented in Fig. 1 d in the main text.
Gercsi and Sandeman Ref. S, 21 have shown that 3 collinear antiferromagnetic structures could be realized in MnP. The results of the calculations are summarized in Table 2. None of the structures result in values comparable with the experimentally determined T.
| Mn1 | Mn2 | Mn3 | Mn4 | ||
|---|---|---|---|---|---|
| (T) | |||||
| AFM1 | 0.461 | ||||
| AFM2 | 0.306 | ||||
| AFM3 | 0.398 |
.5.5 Consistency of the HP-LT magnetic phase with helical structure from Ref. S, 26
Following Ref. S, 26 in the helical structure the Mn moments are coupled in pairs (Mn1/Mn2 and Mn3/Mn4), and rotate within the plane with a constant phase difference between the different pairs along . The magnetic moment was found to be elongated along the crystallographic axis. At GPa and K, and the elongation of the moment is .S (26)
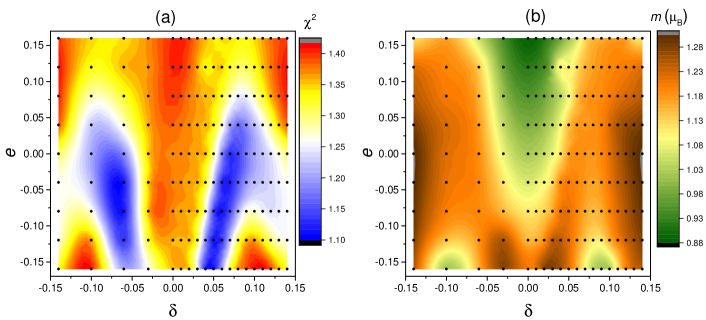
The test of the helical structure was started form the calculations of and fields for each particular muon site in the range of and (black dots in Fig. S3). With such determined sets of and the oscillatory part of the muon-asymmetry spectra was fitted to:
Here denotes the th muon site, is a Gaussian relaxation rate, is the weight ( in our case since all four muon sites are equivalent), , and . The parameter accounts for the possible deviation of the magnetic moment from as determined from calculations in the FM state (see Fig. 5 in the main text). Note that according to Eqs. S8, S9, and S10 the local field at the muon stoping site is directly proportional to .
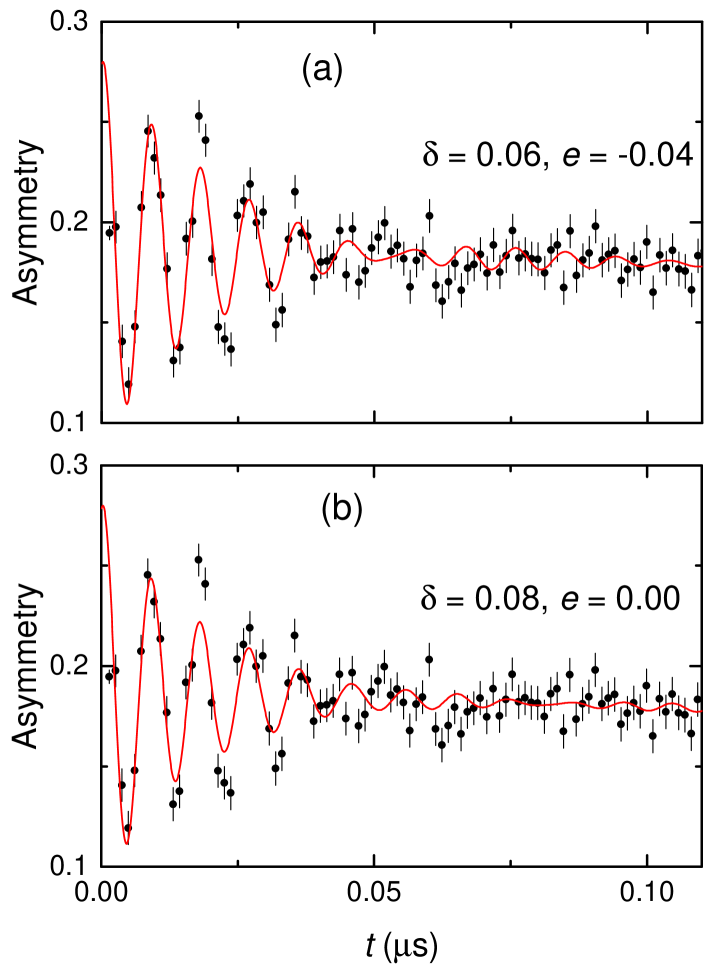
The goodness of fits were checked by using the criteria. As follows from Fig. S3 a for certain values of and the helical structure becomes consistent with the experimental data. The magnetic moment as a function of and is presented in Fig. S3 b. The SR time-spectra and fits within the helical model for two representative sets of and parameters are shown in Fig. S4.
References
- S (1) N.D. Zhigadlo, S. Weyeneth, S. Katrych, P.J.W. Moll, K. Rogacki, S. Bosma, R. Puzniak, J. Karpinski, and B. Batlogg, Phys. Rev. B 86, 214509 (2012).
- S (2) R. Khasanov, Z. Guguchia, A. Maisuradze, D. Andreica, M. Elender, A. Raselli, Z. Shermadini, T. Goko, E. Morenzoni, A. Amato, to appear in High Pressure Research (2016).
- S (3) A. Amato, P. Dalmas de Réotier, D. Andreica, A. Yaouanc, A. Suter, G. Lapertot, I.M. Pop, E. Morenzoni, P. Bonfa, F. Bernardini, and R. De Renzi, Phys. Rev. B 89, 184425 (2014).
- S (4) A. Maisuradze, A. Shengelaya, A. Amato, E. Pomjakushina, and H. Keller, Phys. Rev. B 84, 184523 (2011).
- S (5) S. Rundqvist, Acta Chem. Scand. (1947-1973) 16, 287 (1962).
- S (6) K. Momma and F. Izumi, Journal of Applied Crystallography 41, 653 (2008).
- S (7) P. Bonfà, F. Sartori, and R. De Renzi, J. Chem. Phys C 119, 4278, (2015).
- S (8) P. Giannozzi, S. Baroni, N. Bonini, M. Calandra, R. Car, C. Cavazzoni, D. Ceresoli, G.L. Chiarotti, M. Cococcioni, I. Dabo, A. Dal Corso, S. ano de Gironcoli, S. Fabris, G. Fratesi, R. Gebauer, U. Gerstmann, C. Gougoussis, A. Kokalj, M. Lazzeri, L. Martin-Samos, N. Marzari, F. Mauri, R. Mazzarello, S. Paolini, A. Pasquarello, L. Paulatto, C. Sbraccia, S. Scandolo, G. Sclauzero, A.P. Seitsonen, A. Smogunov, P. Umari, and R.M Wentzcovitch, J. Phys.: Condens. Matter 21, 395502 (2009).
- S (9) H.J. Monkhorst and J.D. Pack, Phys. Rev. B 13, 5188 (1976).
- S (10) J.P. Perdew, K. Burke, and M. Ernzerhof, Phys. Rev. Lett. 77, 3865 (1996).
- S (11) J.P. Perdew, K. Burke, and M. Ernzerhof, Phys. Rev. Lett. 78, 1396 (1997).
- S (12) M. Methfessel and A.T. Paxton, Phys. Rev. B, 40, 3616 (1989).
- S (13) K.F. Garrity, J.W. Bennett, K.M. Rabe, and D. Vanderbilt, Computational Materials Science 81, 446 (2014).
- S (14) A. Baldereschi, Phys. Rev. B 7, 5212 (1973).
- S (15) F.R. Foronda, F. Lang, J.S. Möller, T. Lancaster, A.T. Boothroyd, F.L. Pratt, S.R. Giblin, D. Prabhakaran, and S.J. Blundell, Phys. Rev. Lett. 114, 017602 (2015).
- S (16) F. Xiao, J.S. Möller, T. Lancaster, R.C. Williams, F.L. Pratt, S.J. Blundell, D. Ceresoli, A.M. Barton, and J.L. Manson, Phys. Rev. B 91, 144417 (2015).
- S (17) J.S. Möller, D. Ceresoli, T. Lancaster, N. Marzari, and S.J. Blundell, Phys. Rev. B 87, 121108 (2013).
- S (18) S.J. Blundell, J.S. Möller, T. Lancaster, P.J. Baker, F.L. Pratt, G. Seber, and P.M. Lahti, Phys. Rev. B 88, 064423 (2013).
- S (19) S.J. Blundell, Physica B 404, 581 (2009).
- S (20) Y. Wang, Y. Feng, J.-G. Cheng, W. Wu, J.L. Luo, and T.F. Rosenbaum, arXiv:1511.09152.
- S (21) Z. Gercsi and K. G. Sandeman, Phys. Rev. B 81, 224426 (2010)
- S (22) E.E. Huber and D. H. Ridgley, Phys. Rev. 135, 1033 (1964).
- S (23) G. Felcher, J. Appl. Phys. 37, 1056 (1966).
- S (24) H. Obara, Y. Endoh, Y. Ishikawa, and T. Komatsubara, J. Phys. Soc. Jpn. 49, 928 (1980).
- S (25) J. Forsyth, S. Pickart, and P. Brown, Proc. Phys. Soc. 88, 333 (1966).
- S (26) M. Matsuda, F. Ye, S. E. Dissanayake, J.-G. Cheng, S. Chi, J. Ma, H. D. Zhou, J.-Q. Yan, S. Kasamatsu, O. Sugino, T. Kato, K. Matsubayashi, T. Okada, Y. Uwatoko arXiv:1602.09003.