The effect of baryons on redshift space distortions and cosmic density and velocity fields in the EAGLE simulation
Abstract
We use the EAGLE galaxy formation simulation to study the effects of baryons on the power spectrum of the total matter and dark matter distributions and on the velocity fields of dark matter and galaxies. On scales the effect of baryons on the amplitude of the total matter power spectrum is greater than . The back-reaction of baryons affects the density field of the dark matter at the level of on scales of . The dark matter velocity divergence power spectrum at is changed by less than . The 2D redshift-space power spectrum is affected at the level of at (for ), but for it differs by less than . We report vanishingly small baryonic velocity bias for haloes: the peculiar velocities of haloes with (hosting galaxies with ) are affected at the level of at most km/s, which is negligible for -precision cosmology. We caution that since EAGLE overestimates cluster gas fractions it may also underestimate the impact of baryons, particularly for the total matter power spectrum. Nevertheless, our findings suggest that for theoretical modelling of redshift space distortions and galaxy velocity-based statistics, baryons and their back-reaction can be safely ignored at the current level of observational accuracy. However, we confirm that the modelling of the total matter power spectrum in weak lensing studies needs to include realistic galaxy formation physics in order to achieve the accuracy required in the precision cosmology era.
keywords:
galaxies: haloes - cosmology: theory, dark matter1 Introduction
The standard hierarchical structure formation theory assumes that the distribution of mass in the Universe has evolved out of primordial post-inflationary Gaussian density and velocity perturbations via gravitational instability. The resulting large-scale structures can be described in a statistical way. Two-point statistics (power spectrum and correlation function) are the most widely studied measures (see e.g. Peebles, 1980; Juszkiewicz & Bouchet, 1995; Percival et al., 2001; Gaztañaga et al., 2002; Cole et al., 2005; Eisenstein et al., 2005). With the advent of precision cosmology, defined here as a level of one percent precision in cosmic observables, it is a matter of utmost relevance to obtain accurate theoretical estimates of the two-point statistics. Theoretical modelling is needed to assess and model the systematic effects present in cosmic observables. This modelling needs to be precise enough to reduce the impact of the systematic effects below that of the expected statistical errors. So far the common approach has been to use large computer N-body simulations of a collisionsless dark matter (DM) fluid (see e.g. Frenk & White, 2012, for an extensive review), to model the cosmic density and velocity fields. DM-only simulations are relatively simple and cheap in terms of computer resources. However, they treat the baryonic component in a simplified manner, modelling it as dark and pressureless. In the light of the accuracy required by precision cosmology this approach might well turn out to be inadequate for accurate modelling of all relevant systematic effects.
In linear theory baryons follow the gravitational evolution of dark matter, which dominates the gravitational potential on large scales (i.e. tens of Megaparsecs). However, on smaller scales the highly non-linear nature of the physical processes that govern galaxy formation can lead to significant displacement of the baryonic components relative to the underlying DM (e.g. Jing et al., 2006; Rudd et al., 2008; Guillet et al., 2010; van Daalen et al., 2011; Velliscig et al., 2014; van Daalen et al., 2014; Mohammed et al., 2014). On those smaller scales, we can distinguish two different regimes. The first one concerns scales to hundreds of kiloparsecs, where owing to radiative cooling, gravitationally preheated gas can efficiently dissipate internal energy and condense into halo centres reaching densities much higher than those of the accompanying DM. This effect boosts the variance of the baryon density field w.r.t that of the DM by 10-20% on scales (e.g. van Daalen et al., 2011), (hereafter VD11). The second one is connected to the very energetic processes of Supernovae (SN) explosions and other stellar feedback events, as well as feedback from Active Galactic Nuclei (AGN). These feedback processes can eject significant amounts of gas from the galaxies and haloes in which they reside. Especially efficient AGN energy feedback leads to expulsion of gas from the high-redshift progenitors of today’s group and cluster sized haloes beyond their virial radii. Simulations require such energetic feedback to match simultaneously optical and X-ray observations of galaxy groups and clusters (e.g. McCarthy et al., 2010; Fabjan et al., 2010; McCarthy et al., 2011). Hence SN and AGN feedback yield smoother baryon density contrasts on scales up to a few Megaparsecs (e.g.VD11; Puchwein & Springel, 2013; Vogelsberger et al., 2014).
We expect that on small and intermediate scales (i.e.), the distribution of baryonic matter could differ significantly from that of the collisonless component and that this will produce a back-reaction onto the dark matter (e.g.VD11). This back-reaction, in turn, can produce non-negligible effects in the DM distribution on galactic and intergalactic scales. The baryonic back-reaction may also affect the velocity fields of DM, haloes and galaxies. While these baryonic effects on the total and dark matter density fields have been studied in previous works, the impact on the cosmic velocity fields of DM and galaxies remains to be investigated. Accurate modelling of this phenomenon is important since extraction of cosmological information from galaxy redshift surveys requires precise modelling of the galaxy and DM peculiar velocity fields.
2 The EAGLE simulation suite
In this letter, we use the main simulation (Ref-L100N1504, hereafter eagle) of the eagle (Evolution and Assembly of GaLaxies and their Environments, S15) suite and its DM-only version (hereafter dmo) that was run from the same initial conditions. This was achieved by increasing the DM particle mass by a factor of (here is the universal baryon fraction). eagle uses a state-of-the-art set of subgrid models and treatment of smoothed particle hydrodynamics. The simulations assumes a flat CDM cosmology with parameters from Planck2013 (Planck Collaboration et al., 2014). The initial conditions are generated at using second-order Lagrangian perturbation theory in a volume with a DM particle mass of and initial gas particle mass of (Jenkins, 2013). The particles are then evolved in time using a modified version of the Gadget Tree-SPH code (Springel, 2005) that includes the pressure-entropy formulation of the SPH equations by Hopkins (2013) and other improvements whose effects on the resulting galaxy population are discussed by Schaller et al. (2015c). The maximum physical Plummer-equivalent gravitational softening is .
The subgrid model in this simulation includes element-by-element radiative cooling (Wiersma et al., 2009a), a star formation recipe designed to reproduce the observed Kennicutt-Schmidt relation (Schaye & Dalla Vecchia, 2008), chemical enrichment via stellar mass loss (Wiersma et al., 2009b), stellar feedback (Dalla Vecchia & Schaye, 2012), gas accretion onto supermassive black holes and the corresponding AGN feedback (Booth & Schaye, 2009; Rosas-Guevara et al., 2015). The simulation has been shown to reproduce broadly a variety of other observables (for details see S15; Lagos et al., 2015; Bahé et al., 2016; Furlong et al., 2015; Rahmati et al., 2015; Schaller et al., 2015a; Trayford et al., 2015). With all these successes it is worth mentioning here also a significant shortcoming of the simulation. The eagle X-ray properties of groups and clusters presented in S15 compares rather poorly with observations, with eagle predicting too high gas fractions in those objects. While S15 have shown that eagle model AGNdT9 (which uses more efficient AGN feedback) does much better, its box size of 50 Mpc is too small for our purposes. This discrepancy is important in assessing the prominence of the baryonic effects at intergalactic scales, as the gas fraction of massive objects is a sensitive tell-tale sign of the strength of baryonic effects on the corresponding scales (see e.g. Semboloni et al., 2011, 2013). This should be borne in mind when we analyse the magnitude and scales of the bayonic effects onto the matter spectrum in the eagle simulation.
3 Baryonic effects
We consider basic two-point statistics of the cosmic density and velocity fields in the form of power spectra. Specifically, we examine the real-space total and DM power spectra of density fluctuations, , the power spectrum of the scaled velocity divergence (expansion scalar), , defined here as . The corresponding density-velocity cross-power spectrum is , and the full two-dimensional redshift space density power spectrum is with monopole moment , and quadrupole moment . Here is the comoving 3D Fourier mode wavevector, , is the peculiar velocity, is the cosmic scale factor, is the Hubble parameter, is the growth rate of density fluctuations (defined as the logarithmic derivative of the density perturbation growing mode with respect to the scale factor), and finally are Legendre polynomials. For all calculations in redshift space we use the distant observer approximation in which the -axis of the simulation cube is parallel to the observer’s line of sight (-direction) and the -axes form a plane perpendicular to the observer’s direction (-direction). To compute the power spectra, we estimate the density and velocity fields using the Delaunay Tesselation Field Estimator method of Schaap & van de Weygaert (2000), implemented in the publicly available code by Cautun & van de Weygaert (2011). The dtfe method gives a volume-weighted velocity field and has a self-adaptive smoothing kernel that follows the local density of tracers.
For 1D spectra we sample the fields onto a cubic grid and for spectra we use a sampling grid. The size of the sampling grids implies Nyquist limits for the spectra of and respectively. The analysis of lower-resolution runs of eagle indicates that the power spectra are converged to at . However, since we are focused here on relative differences between dmo and eagle, we will consider the power spectra up to their respective Nyquist sampling limits.
In Fig. 1 we plot all relevant eagle one-dimensional power spectra as absolute values of their relative differences with respect to the corresponding dmo power spectra. For all cases the dashed lines mark the results when the eagle amplitude is lower than the dmo case, whilst the solid lines correspond to the opposite. We first focus on the total matter power spectrum (orange line). Theoretical predictions of this statistic up to are needed for precision cosmology with upcoming surveys like Euclid (Laureijs et al., 2011) and LSST (Ivezic et al., 2008). The simulation suggests that at baryons already produce a difference in the amplitude. This effect is much more pronounced when we consider even smaller scales: at the difference between dmo and eagle can be as large as . The results are compared with two of the OWLS models (Schaye et al., 2010) analysed by VD11. Our results for fall in between VD11 REF model (which had no AGN feedback; tan line) and their AGN model (with strong AGN feedback; magenta). However, at larger scales, we observe that the effect seen in eagle is weaker than their REF model. This regime is affected by eagle limited volume 111i.e. relative lack of extreme objects like rich clusters, and thus susceptible to cosmic variance.
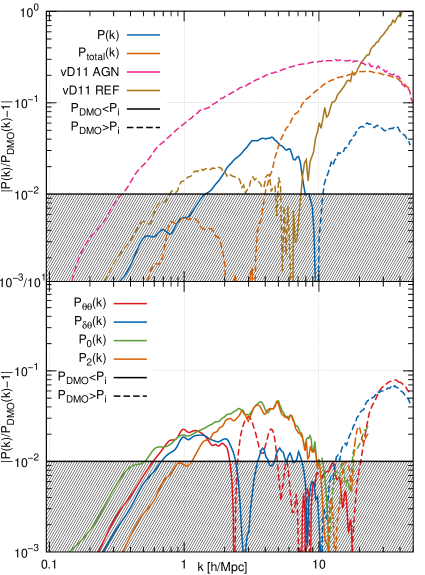
We evaluate the amplitude and scales on which the back-reaction of baryons affects the DM by studying the blue line in Fig. 1, which shows that on scales the back-reaction effects are much smaller (up to ) than the baryonic effects we have seen in the total matter power spectrum. This indicates that on those scales the effect of baryons on the total matter power spectrum is dominated by the distribution of the baryons themselves. Interestingly, in the transitional regime of , the differences between the dmo power spectrum and the DM component of eagle are typically as large as . This is greater than the differences we observe in the total matter . Consequently, even though in this regime the effect of baryons on the total matter power spectrum is small, DM-only simulations will still fail to accurately predict the power spectrum of the DM component. Finally, at there is more power in dmo, than in eagle DM, this reflects the fact that dmo simulations cannot model depletion of gas from lower mass haloes caused by stellar feedback and reionisation, which in turn makes virial masses of those haloes smaller in hydro runs (see e.g. Sawala et al., 2013; Schaller et al., 2015a).
The effects that we have observed here for the DM and baryon density fields are not surprising, considering all the non-linear and highly energetic processes modelled by the eagle simulation. The question that we now want to answer is: to what extent and on what scales does the non-linear physics of the baryonic back-reaction induce changes on the velocity field? We can do this by analysing the red line in the bottom panel of Fig. 1. This line depicts the absolute difference between the amplitude of the DM velocity divergence power spectrum – , and that of the corresponding dmo simulation. The absolute difference is smaller than in the range . At larger scales the difference quickly drops below and at it already becomes negligibly small (). Qualitatively and quantitatively similar behaviour is observed for the density-velocity cross-power spectrum, where differences at are usually smaller than those in . In the case of the monopole of the redshift space power spectrum, , the difference between eagle DM and the dmo result attains its maximal value of at ; however, the baryonic back-reaction drops below already for wavenumbers smaller than . For the quadrupole, , at small scales () we observe the effect of a similar size, while at large scales baryonic effects are even smaller.
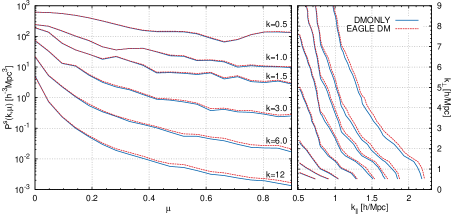
Fig. 2 compares the full two-dimensional (right) and fixed intervals redshift eagle DM and dmo power spectra. For clarity we plot only isoamplitude contours of the full 2D spectra. The eagle box size is probably too small to allow for a proper modelling of large-scale modes () and the Kaiser effect (Kaiser, 1987) due to finite volume effects (see Colombi et al., 1994). However, the box is sufficiently large to appraise the impact of galaxy formation on smaller scales, where the “Fingers of God” effect distorts the matter power spectrum amplitude. The isoamplitude contours are systematically shifted to higher values for eagle , hence indicating that the back-reaction of baryons on the DM leads to a slightly weaker suppression of small-scale power due to viralised motions inside clusters and groups of galaxies. This effect can be better seen on the left panel, where it is noticeable only for close to l.o.s. directions (i.e. ) and small scales . We find that for and the difference can typically be as large as , while at it is contained below for the whole range.
We will discuss the implications of our findings concerning the back-reaction of baryons onto the DM density and velocity power spectra in the discussion section.
So far, with the exception of the total matter power spectrum, we have focused on statistics derived from the velocities and positions of DM particles in our simulations. These are not accessible with astronomical observations but are used in theoretical modelling. However eagle also provides catalogues of galaxies and the haloes they inhabit. This allows us to compare the peculiar velocities222For the purpose of our analysis we define the galaxy/halo peculiar velocity as the velocity of its most bound DM particle. The centre-of-mass velocity definition gives consistent results. of haloes in the dmo and eagle runs. By measuring these differences we can assess the extent to which dmo simulations will suffer from halo and galaxy velocity bias induced by ignoring baryons and their back-reaction onto the DM and galaxy velocity field. Since baryonic physics affects the virial masses of haloes (e.g. Sawala et al., 2013), comparing haloes at fixed masses will suffer from the additional trend induced by the changes in halo mass. To reduce this additional scatter, we first match haloes between both runs, following the method of Velliscig et al. (2014). For each halo in the eagle run we find its unique counterpart in the dmo run by identifying the structure that contains the majority of its most bound particles. The same is done for the dmo halos and only pairs that can be matched bijectively between the two simulations are kept in the catalogue (see also Schaller et al., 2015a). Having matched halo pairs between the two simulations, we compute the difference between their respective peculiar velocities and average this quantity in bins of both eagle halo virial333For the virial mass we use , i.e. the mass contained in a sphere of radius centred on a halo, such that the average overdensity inside the sphere is times the critical closure density, . and galaxy stellar mass. We find that the averaged peculiar velocity difference is km/s for haloes with , hosting galaxies with . For haloes with galaxies more massive than the offset between the dmo and eagle halo peculiar velocities is consistent with zero. The corresponding scatters are 20 km/s and 7 km/s respectively. For all haloes the average difference is much smaller than of matched DM particles, which is km/s, with km/s (i.e. DM particles in the full hydro run have smaller velocities). The average velocity differences are small, but the corresponding dispersions are larger. We have checked that the bulk contribution to the quoted dispersions are coming from large haloes and reflect the fact that differences in time integration between dmo and eagle run can capture a given particle at a different orbital position for the same corresponding snapshot. van Daalen et al. (2014) have demonstrated that the difference in the two-point correlation function of matched haloes in the DMONLY and OWLS AGN simulations is negligible on scales larger than the virial radius of the haloes. In addition Schaller et al. (2015b) have shown that vast majority of eagle galaxies show an offset between their luminous and dark matter component that is smaller than the force resolution of the simulation. A negligible effect on halo and galaxy velocities, that we find in eagle, is thus consistent with their findings, as any long-lasting difference in halo velocity would produce a significant position displacement over a Hubble time.
4 Discussion
We have measured and analysed systematic differences in the DM density, velocity and redshift space power spectra between the full eagle run and its dark matter only version at redshift . The eagle model of galaxy formation reproduces many properties of the galaxy population which suggests that the galaxy formation implementation is plausible in the sense that it does not invoke unreasonably strong or weak feedback from star formation and AGN. This is important as the work of VD11 showed that these two processes mainly modulate the scale and strength of the baryonic back-reaction onto the dark matter. However, recalling that eagle overestimates the gas fraction in massive objects, we can treat the results shown here as an approximate lower bound on the magnitude of the baryonic influence on the DM.
Our findings imply that accurate modelling of hydrodynamical and galaxy formation physics is essential to predict the total matter on scales corresponding to wavenumbers to better than accuracy. On larger scales baryonic effects in eagle change the amplitude by less than , while on scales of the change is greater than . This is a large number in the context of theoretical modelling of the total matter power spectrum from weak lensing tomography in forthcoming surveys such as Euclid or LSST (e.g. Hearin et al., 2012). We stress that eagle is expected to underestimate baryonic effects since the cluster gas fractions are significantly too low S15. This may explain the quantitative difference with VD11, who found a effect for for the OWLS model AGN (Schaye et al., 2010) which does reproduce the observed gas fractions (McCarthy et al., 2010).
The amplitude of the power spectrum of the dmo model deviates by from the scaled DM component of the full eagle run on scales of . This indicates that colisionless simulations fail to model the distribution of the DM component precisely. This was to some extent already present in the results of Schaller et al. (2015a), who found that the DM density profiles of haloes that contain eagle galaxies deviate from their dmo counterparts. Our results indicate that the DM distribution beyond the virial radii of haloes can also be significantly affected by the baryonic back-reaction.
The impact of baryons on the DM peculiar velocity field is less pronounced than on the density field, but it extents to somewhat larger scales. Nevertheless, the effect seen in our simulations is less than on scales . This shows that baryonic effects connected to the galaxy formation physics are not crucial to build accurate models of redshift spaces distortions, provided that these models are restricted to sufficiently large scales. Since theoretical models of the shape and amplitude of the DM and are the main ingredients of redshift space distortions models (e.g. Kaiser, 1987; Scoccimarro, 2004; Taruya et al., 2010; de la Torre & Guzzo, 2012), it was important to appraise the magnitude and scales at which the baryonic physics affects the expansion scalar power spectrum.
The impact of baryons on the peculiar motions of haloes and galaxies is even smaller. This implies that baryonic effects are negligible in the modelling of the large-scale velocity field of galaxies and haloes. This is important because a number of velocity-based observables have been proposed to constrain cosmological parameters and models (see e.g. Nusser & Davis, 1994; Strauss & Willick, 1995; Nusser et al., 2012; Tully et al., 2013; Hellwing et al., 2014; Koda et al., 2014).
To conclude, our results suggest that DM-only simulations may be sufficiently accurate to model the cosmic peculiar velocity field of haloes, galaxies and dark matter. However, baryonic effects are important and need to be taken into account in order to attain the required accuracy of the total-matter and DM power spectra demanded by future surveys like Euclid or LSST.
Acknowledgements
The authors thank the anonymous referee who helped improved the quality of the paper. Peder Norberg, Shaun Cole, Maciej Bilicki, Adi Nusser, Enzo Branchini and Agnieszka Pollo are also acknowledged for valuable discussions and comments. WAH acknowledges support from the European Research Council grant through 646702 (CosTesGrav) and the Polish National Science Center under contract #UMO-2012/07/D/ST9/02785. This work was supported by the Science and Technology Facilities Council (grant numbers ST/F001166/1 and ST/K00090/1); European Research Council (grant numbers GA 267291 “Cosmiway” and GA 278594 “GasAroundGalaxies”) and by the Interuniversity Attraction Poles Programme initiated by the Belgian Science Policy Office (AP P7/08 CHARM). RAC is a Royal Society University Research Fellow. This work used the DiRAC Data Centric system at Durham University, operated by the Institute for Computational Cosmology on behalf of the STFC DiRAC HPC Facility (www.dirac.ac.uk). This equipment was funded by BIS National E-infrastructure capital grant ST/K00042X/1, STFC capital grant ST/H008519/1, and STFC DiRAC Operations grant ST/K003267/1 and Durham University. DiRAC is part of the National E-Infrastructure.
References
- Bahé et al. (2016) Bahé Y. M., et al., 2016, MNRAS, 456, 1115
- Booth & Schaye (2009) Booth C. M., Schaye J., 2009, MNRAS, 398, 53
- Cautun & van de Weygaert (2011) Cautun M. C., van de Weygaert R., 2011, preprint, (arXiv:1105.0370)
- Cole et al. (2005) Cole S., et al., 2005, MNRAS, 362, 505
- Colombi et al. (1994) Colombi S., Bouchet F. R., Schaeffer R., 1994, A&A, 281, 301
- Crain et al. (2015) Crain R. A., et al., 2015, MNRAS, 450, 1937
- Dalla Vecchia & Schaye (2012) Dalla Vecchia C., Schaye J., 2012, MNRAS, 426, 140
- Eisenstein et al. (2005) Eisenstein D. J., et al., 2005, ApJ, 633, 560
- Fabjan et al. (2010) Fabjan D., Borgani S., Tornatore L., Saro A., Murante G., Dolag K., 2010, MNRAS, 401, 1670
- Frenk & White (2012) Frenk C. S., White S. D. M., 2012, Annalen der Physik, 524, 507
- Furlong et al. (2015) Furlong M., et al., 2015, MNRAS, 450, 4486
- Gaztañaga et al. (2002) Gaztañaga E., Fosalba P., Croft R. A. C., 2002, MNRAS, 331, 13
- Guillet et al. (2010) Guillet T., Teyssier R., Colombi S., 2010, MNRAS, 405, 525
- Hearin et al. (2012) Hearin A. P., Zentner A. R., Ma Z., 2012, J. Cosmology Astropart. Phys, 4, 34
- Hellwing et al. (2014) Hellwing W. A., Barreira A., Frenk C. S., Li B., Cole S., 2014, Physical Review Letters, 112, 221102
- Hopkins (2013) Hopkins P. F., 2013, MNRAS, 428, 2840
- Ivezic et al. (2008) Ivezic Z., et al., 2008, preprint, (arXiv:0805.2366)
- Jenkins (2013) Jenkins A., 2013, MNRAS, 434, 2094
- Jing et al. (2006) Jing Y. P., Zhang P., Lin W. P., Gao L., Springel V., 2006, ApJ, 640, L119
- Juszkiewicz & Bouchet (1995) Juszkiewicz R., Bouchet F., 1995, in Maurogordato S., Balkowski C., Tao C., Tran Thanh Van J., eds, Clustering in the Universe. p. 167
- Kaiser (1987) Kaiser N., 1987, MNRAS, 227, 1
- Koda et al. (2014) Koda J., et al., 2014, MNRAS, 445, 4267
- Lagos et al. (2015) Lagos C. d. P., et al., 2015, MNRAS, 452, 3815
- Laureijs et al. (2011) Laureijs R., et al., 2011, preprint, (arXiv:1110.3193)
- McCarthy et al. (2010) McCarthy I. G., et al., 2010, MNRAS, 406, 822
- McCarthy et al. (2011) McCarthy I. G., Schaye J., Bower R. G., Ponman T. J., Booth C. M., Dalla Vecchia C., Springel V., 2011, MNRAS, 412, 1965
- Mohammed et al. (2014) Mohammed I., Martizzi D., Teyssier R., Amara A., 2014, preprint, (arXiv:1410.6826)
- Nusser & Davis (1994) Nusser A., Davis M., 1994, ApJ, 421, L1
- Nusser et al. (2012) Nusser A., Branchini E., Davis M., 2012, ApJ, 744, 193
- Peebles (1980) Peebles P. J. E., 1980, The large-scale structure of the universe. Research supported by the National Science Foundation. Princeton, N.J., Princeton University Press, 1980. 435 p.
- Percival et al. (2001) Percival W. J., et al., 2001, MNRAS, 327, 1297
- Planck Collaboration et al. (2014) Planck Collaboration et al., 2014, A&A, 571, A16
- Puchwein & Springel (2013) Puchwein E., Springel V., 2013, MNRAS, 428, 2966
- Rahmati et al. (2015) Rahmati A., Schaye J., Bower R. G., Crain R. A., Furlong M., Schaller M., Theuns T., 2015, MNRAS, 452, 2034
- Rosas-Guevara et al. (2015) Rosas-Guevara Y. M., et al., 2015, MNRAS, 454, 1038
- Rudd et al. (2008) Rudd D. H., Zentner A. R., Kravtsov A. V., 2008, ApJ, 672, 19
- Sawala et al. (2013) Sawala T., Frenk C. S., Crain R. A., Jenkins A., Schaye J., Theuns T., Zavala J., 2013, MNRAS, 431, 1366
- Schaap & van de Weygaert (2000) Schaap W. E., van de Weygaert R., 2000, A&A, 363, L29
- Schaller et al. (2015a) Schaller M., et al., 2015a, MNRAS, 451, 1247
- Schaller et al. (2015b) Schaller M., Robertson A., Massey R., Bower R. G., Eke V. R., 2015b, MNRAS, 453, L58
- Schaller et al. (2015c) Schaller M., Dalla Vecchia C., Schaye J., Bower R. G., Theuns T., Crain R. A., Furlong M., McCarthy I. G., 2015c, MNRAS, 454, 2277
- Schaye & Dalla Vecchia (2008) Schaye J., Dalla Vecchia C., 2008, MNRAS, 383, 1210
- Schaye et al. (2010) Schaye J., et al., 2010, MNRAS, 402, 1536
- Schaye et al. (2015) Schaye J., et al., 2015, MNRAS, 446, 521
- Scoccimarro (2004) Scoccimarro R., 2004, Phys. Rev. D, 70, 083007
- Semboloni et al. (2011) Semboloni E., Hoekstra H., Schaye J., van Daalen M. P., McCarthy I. G., 2011, MNRAS, 417, 2020
- Semboloni et al. (2013) Semboloni E., Hoekstra H., Schaye J., 2013, MNRAS, 434, 148
- Springel (2005) Springel V., 2005, MNRAS, 364, 1105
- Strauss & Willick (1995) Strauss M. A., Willick J. A., 1995, Phys. Rep., 261, 271
- Taruya et al. (2010) Taruya A., Nishimichi T., Saito S., 2010, Phys. Rev. D, 82, 063522
- Trayford et al. (2015) Trayford J. W., et al., 2015, MNRAS, 452, 2879
- Tully et al. (2013) Tully R. B., et al., 2013, AJ, 146, 86
- Velliscig et al. (2014) Velliscig M., van Daalen M. P., Schaye J., McCarthy I. G., Cacciato M., Le Brun A. M. C., Dalla Vecchia C., 2014, MNRAS, 442, 2641
- Vogelsberger et al. (2014) Vogelsberger M., et al., 2014, MNRAS, 444, 1518
- Wiersma et al. (2009a) Wiersma R. P. C., Schaye J., Smith B. D., 2009a, MNRAS, 393, 99
- Wiersma et al. (2009b) Wiersma R. P. C., Schaye J., Theuns T., Dalla Vecchia C., Tornatore L., 2009b, MNRAS, 399, 574
- de la Torre & Guzzo (2012) de la Torre S., Guzzo L., 2012, MNRAS, 427, 327
- van Daalen et al. (2011) van Daalen M. P., Schaye J., Booth C. M., Dalla Vecchia C., 2011, MNRAS, 415, 3649
- van Daalen et al. (2014) van Daalen M. P., Schaye J., McCarthy I. G., Booth C. M., Dalla Vecchia C., 2014, MNRAS, 440, 2997