The critical mass ratio of double white dwarf binaries for violent merger-induced Type Ia supernova explosions
Abstract
Mergers of carbon-oxygen (CO) white dwarfs (WDs) are considered as one of the potential progenitors of type Ia supernovae (SNe Ia). Recent hydrodynamical simulations showed that the less massive (secondary) WD violently accretes onto the more massive (primary) one, carbon detonation occurs, the detonation wave propagates through the primary, and the primary finally explodes as a sub-Chandrasekhar mass SN Ia. Such an explosion mechanism is called the violent merger scenario. Based on the smoothed particle hydrodynamics (SPH) simulations of merging CO WDs, we derived more stringent critical mass ratio () leading to the violent merger scenario than the previous results. We conclude that this difference mainly comes from the differences in the initial condition, synchronously spinning of WDs or not. Using our new results, we estimated the brightness distribution of SNe Ia in the violent merger scenario and compared it with previous studies. We found that our new does not significantly affect the brightness distribution. We present the direct outcome immediately following CO WD mergers for various primary masses and mass ratios. We also discussed the final fate of the central system of the bipolar planetary nebula Henize 2-428, which was recently suggested to be a double CO WD system whose total mass exceeds the Chandrasekhar-limiting mass, merging within the Hubble time. Even considering the uncertainties in the proposed binary parameters, we concluded that the final fate of this system is almost certainly a sub-Chandrasekhar mass SN Ia in the violent merger scenario.
Subject headings:
binaries: close — galaxies: evolution — supernovae: general — white dwarfs — hydrodynamics1. Introduction
SNe Ia have been considered as thermonuclear explosions of a CO WD. They play important roles in astronomy as a standard candle to determine the cosmological parameters (e.g., Riess et al., 1998; Perlmutter et al., 1999) and as major sources of iron group elements (e.g., Kobayashi et al., 1998). However, their progenitor systems and explosion mechanisms are still uncertain (e.g., Hillebrandt et al., 2000; Maoz et al., 2014). A merger of CO WDs has been considered as one of the potential progenitors of SNe Ia, which is called the double degenerate (DD) scenario (Iben & Tutukov, 1984; Webbink, 1984). A binary of CO WDs loses its angular momentum by emitting gravitational waves and finally merges. When the total mass exceeds the critical mass(, Nomoto et al., 1984) for the carbon ignition in the center, such a system has been proposed to give rise to an SN Ia explosion. Some observational studies reported that neither surviving companions (e.g., González Hernández et al., 2012; Kerzendorf et al., 2012; Schaefer & Pagnotta, 2012) nor signatures of them (e.g., Brown et al., 2012; Foley et al., 2012; Olling et al., 2015) were detected in some well-studied SN Ia remnants and nearby SNe Ia, but recently there are several examples which possibly show these signatures as well both in SNe with special properties (McCully et al., 2014; Cao et al., 2015) and in a normal SN Ia (Marion et al., 2015). These studies suggest that at least a part of SNe Ia would originate from either the DD scenario or the (angular momentum)-loss induced “delayed” carbon ignition in the single degenerate (SD) scenario (e.g., Benvenuto et al., 2015).
After Benz et al. (1990) firstly performed three dimensional (3D) hydrodynamical simulations of CO WD mergers with their SPH code (e.g., Gingold & Monaghan, 1982; Monaghan, 2005; Rosswog, 2009), similar merger simulations have been performed by various groups (e.g., Rasio & Shapiro, 1995; Segretain & Chabrier, 1997; Guerrero et al., 2004; D’Souza et al., 2006; Motl et al., 2007; Yoon et al., 2007; Lorén-Aguilar et al., 2009; Fryer et al., 2010; Pakmor et al., 2010, 2011, 2012a, 2012b; Dan et al., 2011, 2012, 2014; Raskin et al., 2012, 2014; Zhu et al., 2013; Moll et al., 2014; Kashyap et al., 2015; Sato et al., 2015; Tanikawa et al., 2015). These studies showed that a CO WD merger could lead to an SN Ia if several conditions are satisfied. Pakmor et al. (2010, 2011, 2012a, 2012b) simulated mergers of CO WDs, both of the binary members have masses , with their SPH code. They found that the secondary WD violently accreted onto the primary and carbon detonation would occur during the merger. They showed that detonation wave propagated through the primary and the primary finally exploded as an SN Ia. They called this explosion mechanism “the violent merger scenario.” As the mass ratio , where is the primary mass and is the secondary mass, approaches unity, the mass accretion becomes more violent and the carbon detonation occurs more easily. Therefore, the mass ratio is an important parameter for the violent merger scenario.
Pakmor et al. (2011) investigated the critical mass ratio above which the violent merger scenario is realized, and found that for . Dan et al. (2012) studied mergers of WDs over a wide range of masses, i.e., . They found that dynamical carbon burning did not occur in all their models. However, their numerical resolution was low ( particles per star). Sato et al. (2015) performed SPH simulations of CO WD mergers over a wide range of masses and with a resolution of 500,000 particles per , i.e., . They investigated whether or not dynamical carbon burning would occur during the merger. Pakmor et al. (2012b) and Sato et al. (2015) showed that the numerical resolution is another important factor in studying the violent merger scenario, and Sato et al. (2015) suggested that it should be (see also Tanikawa et al., 2015).
Assuming critical mass ratios for the violent merger scenario based on the result of Pakmor et al. (2011), Ruiter et al. (2013) estimated the brightness distribution of SNe Ia and suggested that it could be qualitatively consistent with what is observed (Li et al., 2011). Because the critical mass ratio could have influence on the distribution of SN Ia brightness, detailed investigation of the critical mass ratio is required to verify the violent merger scenario.
Recently, Santander-García et al. (2015) reported that the central system of the bipolar planetary nebula (PN) Henize 2-428 might be a super-Chandrasekhar DD pair. They estimated the combined mass as and the mass ratio as . Although there are some negative arguments against their conclusion (e.g., Frew et al., 2015; Garcia-Berro et al., 2015), Henize 2-428 is a candidate progenitor for the violent merger scenario, if the interpretation by Santander-García et al. (2015) is correct. While Sato et al. (2015) have already simulated a set of primary and secondary masses which cover a plausible parameter space for Henize 2-428, their mass grids were too coarse. In this paper, we perform some additional (much finer grids of the masses) SPH simulations of CO WD mergers to accurately obtain the critical mass ratio for the violent merger scenario. We try to derive the relation between and , and compare it with previous studies. We also use our results to discuss the final fate of Henize 2-428.
This paper is organized as follows. In Section 2, we briefly describe our numerical method. Our results are shown in Section 3 and we discuss them in Section 4. We summarize our findings in Section 5.

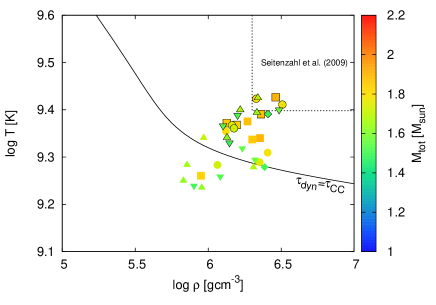
Figure 3 shows the density and temperature of the particle having smallest ratio in each merger simulation, where and are carbon burning and dynamical timescales, respectively, as defined below. Colors and shapes of symbols indicate the total mass, , and primary mass, , respectively. A black solid line shows the line of .
2. Numerical Methods
Our SPH simulations of CO WD mergers are essentially the same as those of Sato et al. (2015). We used the OcTree On OpenCL (OTOO) code, which was developed for various particle simulations for astrophysical fluid phenomena (Nakasato et al., 2012). The equation of state (EOS) is that of Timmes & Swesty (2000). Initial setups are also the same as those in Sato et al. (2015), which refer to Rasio & Shapiro (1995) and Dan et al. (2011). Our CO WD models have an uniform composition of carbon and oxygen in mass. Sato et al. (2015) simulated mergers of CO WDs whose masses were 0.5, 0.6, 0.7, 0.8, 0.9, 1.0, and .
In this paper, we performed additional simulations of CO WD mergers to accurately determine the critical mass ratio to realize the violent merger scenario. We add 0.725, 0.75, 0.775, 0.825, 0.85, and for each 0.75, 0.8, 0.9, 1.0, and , because seems to be in this mass range (see Figure 5 of Sato et al., 2015). The numerical resolution is per solar mass . Our SPH scheme derives the temperature of a particle from the density and internal energy through the EOS. The estimations of density and internal energy have some numerical noises, and the derived temperature is also fluctuated (Dan et al., 2012; Sato et al., 2015; Tanikawa et al., 2015).
Because nuclear burning rate is sensitive to the temperature, it might strongly enhance the fluctuated temperature. Therefore, we firstly performed our simulations without nuclear reactions, as in our previous work (Sato et al., 2015), and determined the critical mass ratio for the violent merger scenario. Then, we added simulations including nuclear reactions in order to confirm that the inclusion of nuclear burning in our SPH simulation increases the temperature high enough to really satisfy the detonation condition for the models above the critical mass ratio (see Section 4.3).
3. Results
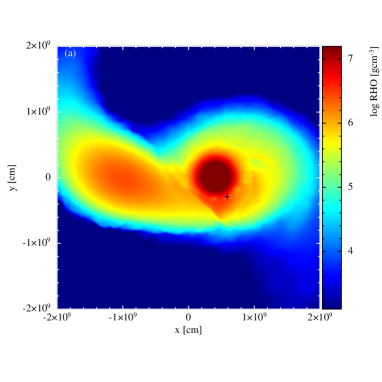
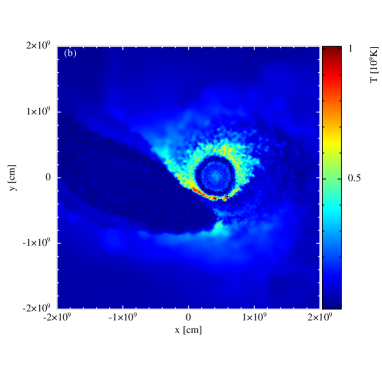
Figure 1 shows time evolutions of the orbital separation and the maximum temperature in the case of . They indicate that the temperature increases drastically when the secondary is completely disrupted and accretes onto the primary, which is consistent with previous studies. Black vertical dashed lines show the time when our detonation condition, which is described below in Section 3.1, is first fulfilled. Figure 2 depicts the density and temperature profiles of the equatorial plane at the time which is indicated by the black dashed lines in Figure 1. The profile and morphology are consistent with the similar cases in Pakmor et al. (2012a, b).
3.1. Conditions for Violent Merger-Induced Explosion
For the violent merger scenario, it is crucial whether or not carbon detonation occurs during a merger. Although Pakmor et al. (2011) used the results of Seitenzahl et al. (2009) as the detonation condition, the treatment is still controversial. In this paper, we judge it from the condition to trigger the dynamical carbon burning. We obtain the dynamical timescale (e.g., Nomoto, 1982),
| (1) |
and the carbon burning timescale,
| (2) |
for each SPH particle. Here, and are particle’s density and temperature, respectively, is the specific heat at constant pressure of a particle, is the gravitational constant, and is the energy generation rate of carbon burning (see Equation (6) of Sato et al., 2015). When there are any particles that satisfy , carbon ignites dynamically. We regard this as the detonation condition.
If , the temperature increases more rapidly than decreases by adiabatic expansion and accelerates carbon burning. The temperature would increase high enough to satisfy the detonation condition, such as the results of Seitenzahl et al. (2009). Thus, we consider that the condition of the dynamical carbon burning () is a plausible detonation condition in the case without nuclear reactions. We confirm this later by including carbon burning in our SPH code in Section 4.3.
As described in Section 2, temperature is possibly affected by numerical noises in our SPH simulations. In order to minimize the influence of temperature noise in judging the condition for carbon detonation, we examine whether the particle continuously satisfies the above condition at least for a dynamical timescale ( s at g cm-3). If so, we assume that dynamical carbon burning is definitely initiated and detonation occurs.
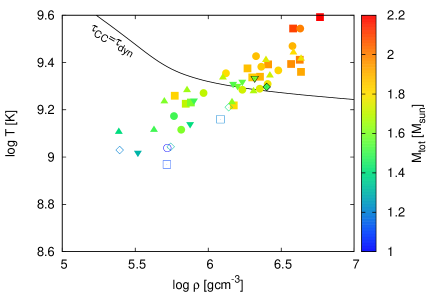
For example, mergers of and , which are surrounded by black frames in Figure 3, both satisfy . However, in the case of , there are no particles which continuously satisfy the above condition for a dynamical timescale. We thus regard that detonation does not occur in the merger of . In the case of , on the other hand, three particles keep for longer than . Therefore, we regard that carbon detonation does occur in the case of and eventually the system leads to an SN Ia in the violent merger scenario.
3.2. Critical Mass Ratio for Violent Merger Scenario
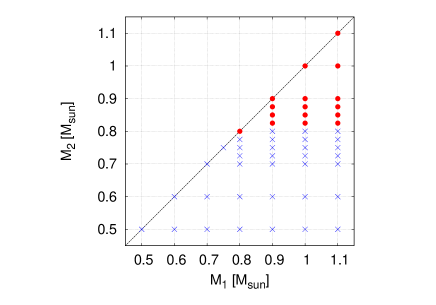
We plot our numerical results of violent merger scenario in Figure 4. Here, the filled circles denote models which satisfy our condition for carbon detonation while the crosses do models which do not. The black dashed line indicates . Figure 4 shows that carbon detonation occurs only in the models whose primary and secondary masses are more massive than , which is consistent with the results of Sato et al. (2015).
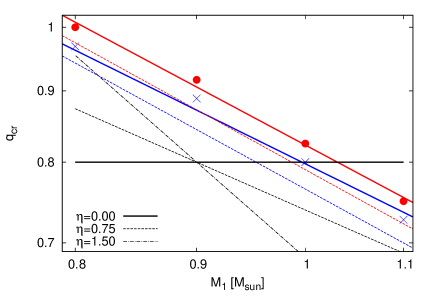
We derived approximate formulae of the critical mass ratio, , as a function of the primary mass, , and plot them in Figure 5, both of which are on logarithmic scales. The red solid line is for an upper bound, while the blue solid line is for a lower bound. They are represented by
| (3) |
| (4) |
respectively. Considering the lowest mass ratios in which the model satisfies our condition for carbon detonation, we derive Equation (3). On the other hand, we derive Equation (4) from the highest mass ratios in which the model does not satisfy our condition for carbon detonation.
If a sizable helium layer exists on the CO WD, helium detonation could occur during merger and induce carbon detonation (e.g. Guillochon et al., 2010; Dan et al., 2012; Raskin et al., 2012; Pakmor et al., 2013; Tanikawa et al., 2015). In this helium-ignited violent merger scenario, could be smaller than Equations (3) and (4). But such a study needs much finer resolution because the occurrence of helium detonation depends strongly on the mass of the helium layer (e.g., Tanikawa et al., 2015). We leave such a systematic study to our future work.
4. Discussion
4.1. Comparison with previous studies
Pakmor et al. (2011) obtained for . Our results show a different value of for . This discrepancy could arise from the differences in (1) the initial conditions, (2) numerical resolution, and (3) inclusion of nuclear burning. We discuss these three effects in this order.
Pakmor et al. (2011) used non-spinning WDs and set them at the initial separation where the Roche lobe overflow (RLOF) just started in the sense of Eggleton’s (1983) approximation. On the other hand, we assume that the WDs spin synchronously with the orbital motion, and set them at the initial separation large enough to avoid the RLOF. We decrease the separation until the RLOF starts (Rasio & Shapiro, 1995; Dan et al., 2011; Sato et al., 2015). For the initial condition of Pakmor et al. (2011), as mentioned in Dan et al. (2011), the secondary accretes onto the primary more violently than for the case of synchronously spinning WDs. As a result, carbon detonation would occur easily. We examined the merger of WDs in the similar initial condition to that of Pakmor et al. (2011). We thereby found that there exist 16 particles which satisfy the condition for carbon detonation in this case, while there is no such a particle for our initial condition (see Figure 3). Although no definite conclusion has been reached yet, several numerical studies suggest that compact WD binaries would reach synchronization before their merging due to angular momentum dissipation by tidally excited gravity waves (e.g. Fuller & Lai, 2014, and references therein).
4.2. Numerical resolution
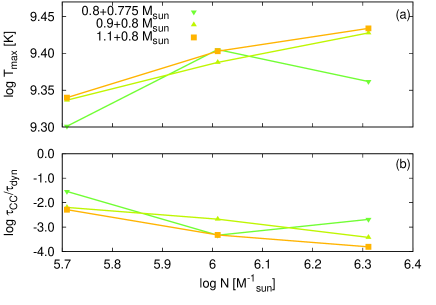
Numerical resolution might also cause the difference. Sato et al. (2015) reported that the maximum temperature and the minimum ratio did not converge in the range of . This is because smaller hot regions can be resolved as the numerical resolution becomes higher. Several previous studies also indicated that numerical resolution would affect their results (e.g., Pakmor et al., 2011, 2012b). In this paper, we performed several simulations with higher numerical resolutions (, ) than our standard ones (), for , , and WDs. Our numerical results are summarized in Figure 6. The maximum temperature still increases and the minimum ratio decreases except for as the numerical resolution increases. Similar trends were also reported in Pakmor et al. (2012b), Sato et al. (2015), and Tanikawa et al. (2015). These trends indicate that our numerical results have not been fully converged yet. Therefore, our critical mass ratio could be slightly lower than the red solid line in Figure 5.
4.3. Effect of nuclear burning
Inclusion of nuclear reactions could also make the difference between theirs and ours. Pakmor et al. (2011) found that particles with high temperature ( K) did not exist in the case of without nuclear reactions. On the other hand, they existed in the case with nuclear reactions.
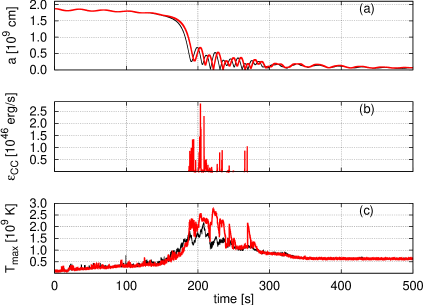
In order to evaluate the effect of nuclear energy release, we performed additional simulations including nuclear burning for some models. In these simulations, we include only carbon burning, i.e., reaction, to avoid large computational cost for solving a reaction network. The formulation of the reaction rate is the same as Equation (6) of our previous work (Sato et al., 2015). Because the initiation of carbon detonation is judged by this reaction, such a simple treatment of nuclear reactions would be sufficient for our purpose. Electron screening effect is negligibly small in the region of – g cm-3 and K, where carbon detonation would occur, so we do not include this effect.
Figure 7 shows the comparison between simulations with and without carbon burning for the case of . The red lines indicate the case with carbon burning, while the black ones do the case without. Although the orbital evolution (Figure 7(a)) is almost the same, the maximum temperature (Figure 7(c)) realized in the case with carbon burning is higher than the case without during the merger phase. This difference comes from the nuclear energy release (Figure 7(b)). We confirmed that the inclusion of carbon burning increase the maximum temperature. Figure 8 summarizes the density and temperature of a particle which has the smallest ratio for all the cases we recalculated including nuclear burning. The symbols surrounded by black frames are the results of the cases with carbon burning.
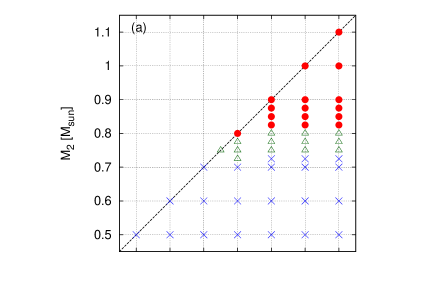
Since our simulations include only carbon burning, the effect of nuclear reactions would be underestimated. To check this effect, we perform post-processing calculations, using an -chain reaction network containing 13 species from 4He to 56Ni (Timmes, 1999). Figure 9 shows the results for a particle which has the highest temperature in the case of . This calculation was done for a period in which carbon burning continued. The red lines indicate the case with the -chain reaction network, while green lines do the case with only carbon burning. Because we find essentially no difference between them, our simulations including only carbon burning are appropriated to estimate the effect of nuclear burning, and being consistent with the previous studies using -chain networks (Pakmor et al., 2010, 2011, 2012a; Raskin et al., 2012), at least until the initiation of detonation. Thus, the inclusion of carbon burning lowers to realize violent merger-induced explosion if we use the same criterion as in Section 3.2. In Figure 10(a), green triangles are the models which satisfy our detonation condition with carbon burning, although they do not satisfy the condition without.
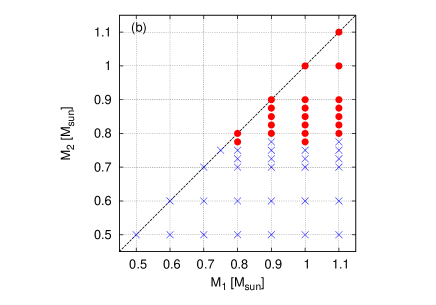
However, our detonation condition in Section 3.2 is considered under the situation without nuclear burning, so it would be no longer valid in the case with carbon burning. Therefore, for comparison with the results of Pakmor et al. (2011), we adopt the same detonation condition as theirs, i.e., the detection of particles having g cm-3 and K (Seitenzahl et al., 2009). The results are presented in Figure 10(b). Although the boundary of Figure 10(b) is slightly lower than that of Figure 4, the difference between them is small. Thus, we confirm that the detonation condition adopted in Section 3.1 is plausible for the case without nuclear reactions.
The approximated lines of in the case with carbon burning are also presented in Figure 5, where the red (blue) dashed line indicates an upper (lower) bound. The value of with carbon burning is slightly lower than that without carbon burning. The lower bound without carbon burning is almost the same as the upper bound with carbon burning, so we adopt the boundary of Equation (4). Then, our is more stringent than that derived in Pakmor et al. (2011). This difference mainly comes from the initial condition as discussed in Section 4.1.
4.4. Brightness distribution in violent merger scenario
Using the results of Pakmor et al. (2011) and the binary population synthesis (BPS) calculation (Ruiter et al., 2011), Ruiter et al. (2013) estimated the brightness distribution of SNe Ia arising from the violent merger scenario. They adopted the value of for from Pakmor et al. (2011), and assumed
| (5) |
where they used . We add these three lines in Figure 5. Our is basically more stringent than Ruiter et al.’s (2013) assumptions.
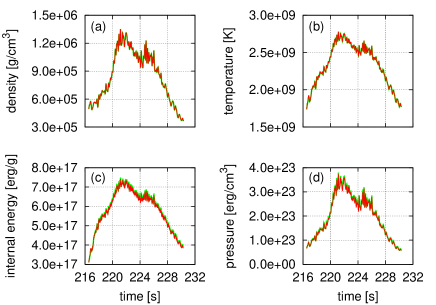
using the 13 species -chain reaction network (Timmes, 1999). Green lines denote the case of only carbon burning while red ones do those of post-processing results. (a) Density, (b) temperature, (c) specific internal energy, and (d) pressure.
In order to examine how our would affect the brightness distribution of the violent merger scenario, we adopt the same assumptions as in Ruiter et al. (2013) except for .
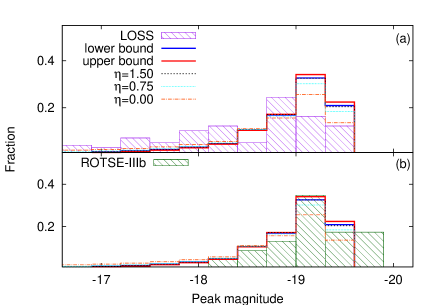
For the primary at the time of merging, we use the same WD mass distribution as Ruiter et al. (2013) (see also Ruiter et al., 2011), although it is highly uncertain whether the WD can increase its mass by avoiding the formation of a common envelope during the very rapid accretion from the He star companion. We also assume the same relation of SNe Ia as Ruiter et al.’s (2013) (see Figure 4 in Ruiter et al., 2013; Sim et al., 2010) and a flat mass ratio distribution of DD systems for simplicity. Using either our critical mass ratio or theirs, we calculated the brightness distribution and compared them each other (Figure 11). We find that there is no significant differences between them qualitatively. This result implies that the of the violent merger-induced explosion is not so crucial for the brightness distribution of SNe Ia, as mentioned in Ruiter et al. (2013). Our results are closest to the case among Ruiter et al.’s three cases. In the both cases of our and Ruiter et al.’s , the brightness distribution concentrates around mag. In Figure 11, we add the observational volume-limited brightness distributions of SNe Ia. One in panel (a) is derived by the Lick Observatory Supernova Search (LOSS, Li et al., 2011), and the other in panel (b) is obtained by ROTSE-IIIb (see Table 1 in Quimby et al., 2012). The fraction of faint events in our models is lower than the observation of LOSS. This discrepancy might decrease if we consider the viewing angle effects (see also discussion in Ruiter et al., 2013), which might be increasingly important especially for a large value of . On the other hand, the results of ROTSE-IIIb are consistent with ours, except most luminous ( mag) events. It should be noted, however, that there are large uncertainties for the observational brightness distribution (e.g., Quimby et al., 2012) and our models are too simple to be compared with the observational results. More detailed studies are required to reach the definitive conclusion.
As the mass ratio is approaching unity, the primary is more strongly deformed by the secondary at merging. As a result, the central density of the primary becomes lower. Because the nucleosynthesis in SN Ia explosions is so sensitive to the density profile near the center of the primary in the violent merger scenario, the amount of 56Ni decreases as the deformation of the primary becomes higher (Pakmor et al., 2010, 2011). Since our is higher than that in the previous studies, the amount of 56Ni in the violent merger scenario would decrease, while this effects are not included in our brightness estimates.
4.5. Outcome of mergers and final fate of Henize 2-428
We summarize the final fates of CO WD mergers in the total mass versus mass ratio (Figure 12), as well as in the mass ratio versus primary mass diagram (Figure 13). The black dotted line shows the line of . If the total mass does not exceed this value, the merger remnant becomes a WD without exploding as an SN Ia (Nomoto et al., 1984).
The direct outcome is a violent merger-induced explosion (VM) in the red hatched region. We adopt Equation (4) as the boundary of this immediate explosion. In other regions, our condition for the violent merger scenario is not satisfied and the merger remnant reaches a quasi-stationary state.
The merger remnant consists of three parts, a cold core, hot envelope, and outer disk (e.g. Benz et al., 1990). In the blue hatched region, off-center carbon burning occurs in the hot envelope (see, e.g., Sato et al., 2015) and the core of the merger remnant would be converted to an oxygen-neon-magnesium (ONeMg) WD (Saio & Nomoto, 1985, 1998, 2004). Because the total mass exceeds , the merger remnant finally collapses to a neutron star, i.e., the accretion induced collapse (AIC) (e.g., Nomoto & Kondo, 1991).
In the green hatched region, the core of the merger remnant remains a CO WD because off-center carbon burning does not occur in the early remnant phase ( after the secondary is completely disrupted, e.g., Sato et al., 2015). Further evolution of the merger remnant depends on the viscosity and the accretion of material from the outer Keplerian disk (Yoon et al., 2007). If the viscous heating is sufficiently large in the viscous evolution phase (, e.g., Mochkovitch & Livio, 1989), or if the accretion rate exceeds the critical rate of in the thermal evolution phase (, e.g., Nomoto & Iben, 1985; Yoon et al., 2007), off-center carbon burning is ignited. The final result would be AIC. On the other hand, if the viscous heating is too small or if the accretion rate does not exceed the critical rate, the mass of the merger remnant could grow to exceed without off-center carbon burning. We should note that of the rotating CO WD is larger than because of the centrifugal force, being if the rotation is uniform (or larger if differential rotation). Eventually, the merger remnant would explode or collapse depending on and the timescale of the angular momentum loss from the merger remnant (Benvenuto et al., 2015). We call the case of explosion as the accretion induced explosion (AIE). Because of the above uncertainties, we indicate the green hatched region as AIE/AIC in Figure 12. The boundary between the AIC and AIE/AIC is derived from the results of Sato et al. (2015).
In the magenta hatched region, because off-center carbon burning does not occur and the total mass of the merger remnant does not exceed , it possibly leaves a massive CO WD (MWD). Outer boundaries are set from the WD mass range ().
Figures 12 and 13 could not be conclusive. If higher numerical resolutions are applied, the VM region in Figures 12 and 13 would extend downward. As mentioned in Section 4.1, the initial condition of simulations also affects the merger outcomes. If we adopt non-synchronously spinning systems as initial conditions, the VM and AIC region might extend (e.g., Dan et al., 2011; Sato et al., 2015).
In Figure 13, we depict the results of previous works for comparison. The squares indicate the models calculated by Pakmor et al. (2011). Their WD masses are , , , and for (Pakmor et al., 2011). The filled squares are the models which satisfy the detonation condition of Seitenzahl et al. (2009), while the open one did not. Their results indicate that for . Note that our boundary is for , which is more stringent than theirs.
We discuss the final fate of Henize 2-428 on the basis of our results. Henize 2-428 is a bipolar PN and its central system was identified as a binary (e.g., Rodríguez et al., 2001). Santander-García et al. (2015) analyzed the light curve and spectra of the central system. From the depth of the light curve minima, the intensities of two He II nm absorption lines, and the obtained radial velocity amplitudes, they interpreted the central system of Henize 2-428 as a DD (double post-AGB core) system with nearly equal masses and effective temperatures. They estimated the total mass of the central system as , which clearly exceeds the Chandrasekhar limit. They also derived the merging time of this system as Myrs from the orbital period of days. If their interpretation is correct, the central system of Henize 2-428 is the first detected super-Chandrasekhar DD system, which is a candidate of SN Ia progenitors in the DD scenario. Because the mass ratio is close to unity, it likely leads to an SN Ia in the violent merger scenario.
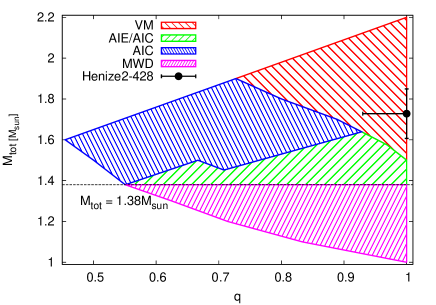
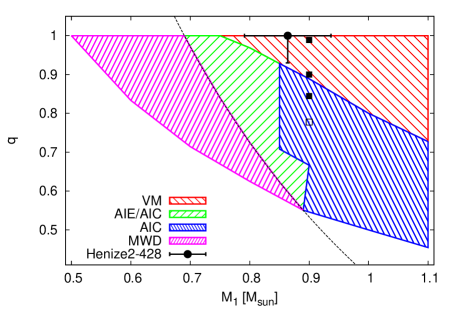
Santander-García et al. (2015) fixed the mass ratio of the central system of Henize 2-428 at unity based on the similar depths of light curve minima and the radial velocity amplitudes. In this paper, considering -uncertainties mentioned in Santander-García et al. (2015), we derive possible ranges of the mass ratio and primary mass without fixing the mass ratio. In Figures 12 and 13, the black point with error bars depicts the possible ranges of the mass ratio and primary mass thus derived. Even considering the uncertainties of the mass ratio and primary mass, we regard that Henize 2-428 is a possible progenitor of SNe Ia in the violent merger scenario.
5. Summary
We summarize our main results as follows:
(1) Based on the SPH simulations of merging CO WDs, we derived the critical mass ratio for the violent merger scenario, i.e., the versus relation, and compared our result with the previous studies. Our is more stringent than that derived by Pakmor et al. (2011). We conclude that this small difference stems mainly from the differences in the initial condition (synchronously spinning or not).
(2) We confirmed that the difference in the critical mass ratio does not affect the brightness distribution of SNe Ia significantly, as claimed in Ruiter et al. (2013). Our results are close to that of the case in Ruiter et al. (2013) and consistent with the observational one obtained by ROTSE-IIIb (Quimby et al., 2012). Our larger would also decrease the relative rate of higher central density primary WDs at the merger, and as a result the total amount of 56Ni synthesized in the violent merger would be reduced.
(3) We also summarized the direct outcome of CO WD mergers and their final fates in the diagram of versus (and versus ). On the basis of this diagram, we discussed the fate of the central system of the bipolar planetary nebula Henize 2-428, which was recently suggested to be a possible super-Chandrasekhar DD system merging in a timescale much shorter than the Hubble time. Even considering uncertainties of the proposed system in the versus diagram, we identify the final fate of this system as almost certainly an SN Ia in the violent merger scenario.
Acknowledgments
We thank the anonymous referee for many detailed comments that helped to improve the paper. Simulations in this paper were performed by using computational resources of Kavli Institute for the Physics and Mathematics of the Universe (IPMU), and HA-PACS at the Center for Computational Sciences in University of Tsukuba under Interdisciplinary Computational Science Program. This research has been supported in part by Grants-in-Aid for Scientific Research (23224004, 23540262, 23740141, 24540227, 26400222, and 26800100) from the Japan Society for the Promotion of Science and by the World Premier International Research Center Initiative, MEXT, Japan. This work is partly supported by MEXT program for the Development and Improvement for the Next Generation Ultra High-Speed Computer System under its Subsidies for Operating the Specific Advanced Large Research Facilities.
References
- Benvenuto et al. (2015) Benvenuto, O. G., Pane, J. A., Nomoto, K., Kitamura, H., & Hachisu, I. 2015, ApJ, 809, L6
- Benz et al. (1990) Benz, W., Cameron, A. G. W., Press, W. H., & Bowers, R. L. 1990, ApJ, 348, 647
- Blinnikov & Khokhlov (1987) Blinnikov, S. I., Khokhlov, A. M. 1987, Soviet Astronomy Letters, 13, 364
- Brown et al. (2012) Brown, P. J., Dawson, K. S., Harris, D. W., et al. 2012, ApJ, 749, 18
- Cao et al. (2015) Cao, Y., Kulkarni, S. R., Howell, D. A. et al. 2015, ApJ, 749, 18
- Dan et al. (2011) Dan, M., Rosswog, S., Guillochon, J., & Ramirez-Ruiz, E. 2011, ApJ, 737, 89
- Dan et al. (2012) Dan, M., Rosswog, S., Guillochon, J., & Ramirez-Ruiz, E. 2012, MNRAS, 422, 2417
- Dan et al. (2014) Dan, M., Rosswog, S., Brüggen, M., & Podsiadlowski, P. 2014, MNRAS, 438, 14
- D’Souza et al. (2006) D’Souza, M. C. R., Motl, P. M., Tohline, J. E., & Frank, J. 2006, ApJ, 643, 381
- Eggleton (1983) Eggleton, P. P. 1983, ApJ, 268, 368
- Foley et al. (2012) Foley, R. J., Challis, P. J., Filippenko, A. V., et al. 2012, ApJ, 744, 38
- Frew et al. (2015) Frew, D. J., Parker, Q. A., & Bojicic, I. S. 2015, MNRAS, 455, 1459
- Fryer et al. (2010) Fryer, C. L., Ruiter, A. J., Belczynski, K., et al. 2010, ApJ, 725, 296
- Fuller & Lai (2014) Fuller, J., Lai, D. 2014, MNRAS, 444, 3488
- Garcia-Berro et al. (2015) Garcia-Berro, E., Soker, N., Althaus, L. G., Ribas, I., & Morales, J. C. 2015, New A, 45, 7
- Gingold & Monaghan (1982) Gingold, R. A., & Monaghan, J. J. 1982, Journal of Computational Physics, 46, 429
- González Hernández et al. (2012) González Hernández, J. I., Ruiz-Lapuente, P., Tabernero, H. M., et al. 2012, Nature, 489, 533
- Guerrero et al. (2004) Guerrero, J., Garcia-Berro, E., & Isern, J. 2004, A&A, 413, 257
- Guillochon et al. (2010) Guillochon, J., Dan, M., Ramirez-Ruiz, E., Rosswog, S. 2010, ApJ, 709, L64
- Hillebrandt et al. (2000) Hillebrandt, W., Niemeyer, J. C. 2000, ARA&A, 38, 191
- Iben & Tutukov (1984) Iben, Jr. I., & Tutukov, A., V. 1984, ApJS, 54, 335
- Kashyap et al. (2015) Kashyap, R., Fisher, R., García-Berro, E. et al. 2015, ApJ, 800, L7
- Kerzendorf et al. (2012) Kerzendorf, W. E., Schmidt, B. P., Laird, J. B., et al. 2012, ApJ, 759, 7
- Kobayashi et al. (1998) Kobayashi, C., Tsujimoto, T., Nomoto, K., Hachisu, I., & Kato, M. 1998, ApJ, 503, L155
- Li et al. (2011) Li, W., Leaman, J., Chornock, R. et al. 2011, MNRAS, 412, 1441
- Lorén-Aguilar et al. (2009) Lorén-Aguilar, P., Isern, J., & Garcia-Berro, E. 2009, A&A, 500, 1193
- Maoz et al. (2014) Maoz, D., Mannucci, F., & Nelemans, G. 2014, ARA&A, 52, 107
- Marion et al. (2015) Marion, G. H., Brown, P. J., Vinkó, J. et al. 2015, arXiv:1507.07261
- McCully et al. (2014) McCully, C., Jha, S. W., Foley, R. J. et al. 2014, Nature, 512, 54
- Mochkovitch & Livio (1989) Mochkovitch, R., & Livio, M., 1989, A&A, 209, 111
- Moll et al. (2014) Moll, R., Raskin, C., Kasen, D., & Woosley, S., E. 2014, ApJ, 785, 105
- Monaghan (2005) Monaghan, J. J. 2005, Reports on Progress in Physics, 68, 1703
- Motl et al. (2007) Motl, P. M., Frank, J., Tohline, J. E., & D’Souza M. C. R. 2007, ApJ, 670, 1314
- Nakasato et al. (2012) Nakasato, N., Ogiya, G., Miki, Y., Mori, M., & Nomoto, K. 2012, arXiv:1206.1199
- Nomoto (1982) Nomoto, K. 1982, ApJ, 257, 780
- Nomoto et al. (1984) Nomoto, K., Thielemann, F. K., Yokoi, K. 1984, ApJ, 286, 644
- Nomoto & Iben (1985) Nomoto, K., Iben, Jr. I., 1985, ApJ, 297, 531
- Nomoto & Kondo (1991) Nomoto, K., & Kondo, Y. 1991, ApJ, 367, L19
- Olling et al. (2015) Olling, R. P., Mushotzky, R., Shaya, E. J., et al. 2015, Nature, 521, 332
- Pakmor et al. (2010) Pakmor, R., Kromer, M., Röpke, F., K. et al. 2010, Nature, 463, 61
- Pakmor et al. (2011) Pakmor, R., Hachinger, S., Röpke, F. K., & Hillebrandt, W. 2011, A&A, 528, A117
- Pakmor et al. (2012a) Pakmor, R., Kromer, M., Taubenberger, S. et al. 2012a, ApJ, 747, L10
- Pakmor et al. (2012b) Pakmor, R., Edelmann, P., Röpke, F., K., & Hillebrandt, W. 2012b, MNRAS, 424, 2222
- Pakmor et al. (2013) Pakmor, R., Kromer, M., Taubenberger, S., Springel, V. 2013, ApJ, 770, L8
- Perlmutter et al. (1999) Perlmutter, S., Aldering, G., Goldhaber, G. et al. 1999, ApJ, 517, 565
- Quimby et al. (2012) Quimby, R. M., Yuan, F., Akerlof, C., Wheeler, J. C., Warren, M. S., 2012, AJ, 144, 177
- Rasio & Shapiro (1995) Rasio, F. A., & Shapiro, S. L. 1995, ApJ, 438, 887
- Raskin et al. (2012) Raskin, C., Scannapieco, E., Fryer, C., Rockefeller, G., & Timmes, F., X. 2012, ApJ, 746, 62
- Raskin et al. (2014) Raskin, C., Kasen, D., Moll, R., Schwab, J., & Woosley, S., E. 2014, ApJ, 788, 75
- Riess et al. (1998) Riess, A. G., Fillipenko, A. V., Challis, P. et al. 1998, AJ, 116, 1009
- Rodríguez et al. (2001) Rodríguez, M., Corradi, R. L. M., & Mampaso, A. 2001, A&A, 377, 1042
- Rosswog (2009) Rosswog, S. 2009, New Astronomy Reviews, 53, 78
- Ruiter et al. (2011) Ruiter, A. J., Belczynski, K., Sim, S. A. et al. 2011, MNRAS, 417, 408
- Ruiter et al. (2013) Ruiter, A. J., Sim, S. A., Pakmor, R. et al. 2013, MNRAS, 429, 1425
- Saio & Nomoto (1985) Saio, H., & Nomoto, K. 1985, A&A, 150, L21
- Saio & Nomoto (1998) Saio, H., & Nomoto, K. 1998, ApJ, 500, 388
- Saio & Nomoto (2004) Saio, H., & Nomoto, K. 2004, ApJ, 615, 444
- Santander-García et al. (2015) Santander-García, M., Rodríguez-Gil, P., Corradi, R. L. M. et al. 2015, Nature, 519, 63
- Sato et al. (2015) Sato, Y., Nakasato, N., Tanikawa, A., et al. 2015, ApJ, 807, 105
- Schaefer & Pagnotta (2012) Schaefer, B., & Pagnotta, A. 2012, Nature, 481, 164
- Segretain & Chabrier (1997) Segretain, L., Chabrier, G., & Mochkovitch, R. 1997, ApJ, 481, 355
- Seitenzahl et al. (2009) Seitenzahl, I. R., Meakin, C. A., Townsley, D. M., Lamb, D. Q., & Truran, J. W. 2009, ApJ, 696, 515
- Sim et al. (2010) Sim, S. A., Röpke, F. K., Hillebrandt, W. et al. 2010, ApJ, 714, L52
- Tanikawa et al. (2015) Tanikawa, A., Nakasato, N., Sato, Y., et al. 2015, ApJ, 807, 40
- Timmes (1999) Timmes, F. X. 1999, ApJS, 124, 241
- Timmes & Swesty (2000) Timmes, F. X., & Swesty, F. D. 2000, ApJS, 126, 501
- Webbink (1984) Webbink, R. F. 1984, ApJ, 277, 355
- Whelan & Iben (1973) Whelan, J., & Iben, Jr. I. 1973, ApJ, 186, 1007
- Yoon et al. (2007) Yoon, S. C., Podsiadlowski, P., & Rosswog, S. 2007, MNRAS, 380, 933
- Zhu et al. (2013) Zhu, C., Chang, P., van Kerkwijk, M. H., & Wadsley, J. 2013, ApJ, 767, 164