Effects of magnetic field and twin domains on magnetostructural phase mixture in Mn3O4: Raman scattering studies of untwinned crystals
Abstract
The ferrimagnetic spinel Mn3O4 exhibits large and anisotropic changes in electronic and structural properties in response to an applied magnetic field. These changes are thought to result from the field-dependent tuning—via strong spin-lattice coupling—between two nearly degenerate magnetostructural phases. Recent variable-magnetic-field studies of Mn3O4 have been performed on melt-grown crystals, which can exhibit twin domains due to a Jahn-Teller structural transition below the melting temperature. Because of the near degeneracy of the magnetostructural phases, however, strain associated with the twin domains likely affects the magnetic responses of Mn3O4. In this report, we present a variable-magnetic-field Raman scattering study of untwinned Mn3O4 crystals grown out of a flux below the Jahn-Teller structural transition. We measure distinct magnetic and vibrational excitation spectra for each isolated magnetostructural phase of untwinned Mn3O4 crystals and determine the symmetries of the observed excitations. We determine how the magnetostructural phase mixture changes in response to magnetic fields applied in the magnetic easy plane. Lastly, by comparing results on flux- and melt-grown Mn3O4 crystals, we show that the intrinsic mixture of the two magnetostructural phases is indeed strongly influenced by the presence of twin domains.
I Introduction
Strongly correlated materials are characterized by a competition among multiple important interactions involving spin, charge, lattice, and orbital degrees of freedom, which often leads to a near degeneracy between competing phases.Dagotto (2005) Significant consequences of this near degeneracy include the coexistence of phases and/or the ‘colossal’ tunability of physical properties in response to external perturbations such as magnetic field and pressure.Dagotto et al. (2008); Ahn et al. (2013); Wu and Leighton (2003); Snow et al. (2001); Kivelson et al. (1998) Examples of such tunable properties include multiferroic behavior,Kimura et al. (2003) colossal magnetoresistance,Ramirez (1997) magnetically tuned shape-memory effects,Lavrov et al. (2002); Kim et al. (2010) and magnetothermal and magnetodielectric behavior.Lawes et al. (2003); Gschneidner et al. (2005); Tackett et al. (2007) Clarifying the mechanisms connecting nearly degenerate phases and tunable behavior in specific materials has been one of the key challenges of condensed matter physics in recent years.
The spinel crystal structure (chemical formula ) is a commonly occurring structure among complex transition metal oxides and chalcogenides.Lacroix et al. (2011) Many spinels display strong correlations between spin, charge, orbital, and lattice degrees of freedom due to a magnetically frustrating sublattice of corner-sharing tetrahedra (see Fig. 1(a)), as well as the anisotropy and spatial extent of the orbitals. Consequently, a wide variety of phenomena have been reported for spinels, including superconductivity,McCallum et al. (1976) charge ordering,Irizawa et al. (2011) heavy fermion behavior,Kopeć et al. (2009) and multiferroicity.Yamasaki et al. (2006); Dey et al. (2014); Giovannetti et al. (2011); Maignan et al. (2012); Singh et al. (2011)
The ferrimagnetic spinel Mn3O4 () also exhibits novel phenomena in the magnetically-ordered state, including large magnetodielectric and magnetoelastic responses.Tackett et al. (2007); Suzuki and Katsufuji (2008); Nii et al. (2013) Magnetic-field-induced changes in the low-frequency dielectric constant and crystal dimensions have been attributed to field-induced transitions between two distinct magnetostructural phases, which are discussed below.Nii et al. (2013) A high-resolution x-ray diffraction study recently revealed that these two magnetostructural phases in fact coexist below the Néel temperature in polycrystalline Mn3O4,Kemei et al. (2014) demonstrating the near degeneracy of their free energies. Thus, Mn3O4 belongs to the class of strongly correlated materials whose bulk physical parameters are ‘tunable’ due to distinct phases existing in close proximity.
Mn3O4 is a tetragonally-distorted spinel at room temperature as a result of a Jahn-Teller cubic-to-tetragonal transition at K.Van Hook and Keith (1958) Mn3O4 first magnetically orders at K in a triangular configuration, with the spins lying approximately in the plane and with the net magnetization along the direction,Jensen and Nielsen (1974); Chardon and Vigneron (1986) where the crystallographic indices here and throughout the paper refer to the conventional (body-) centered-tetragonal setting. The -axis components of the Mn3+ spins form antiferromagnetic chains along the directions.Jensen and Nielsen (1974) Below K, an incommensurate magnetic modulation develops in half of the Mn3+ spins, with a propagation vector that evolves with temperature until it becomes commensurate with the lattice below K, doubling the magnetic unit cell along the direction.Jensen and Nielsen (1974); Chardon and Vigneron (1986)
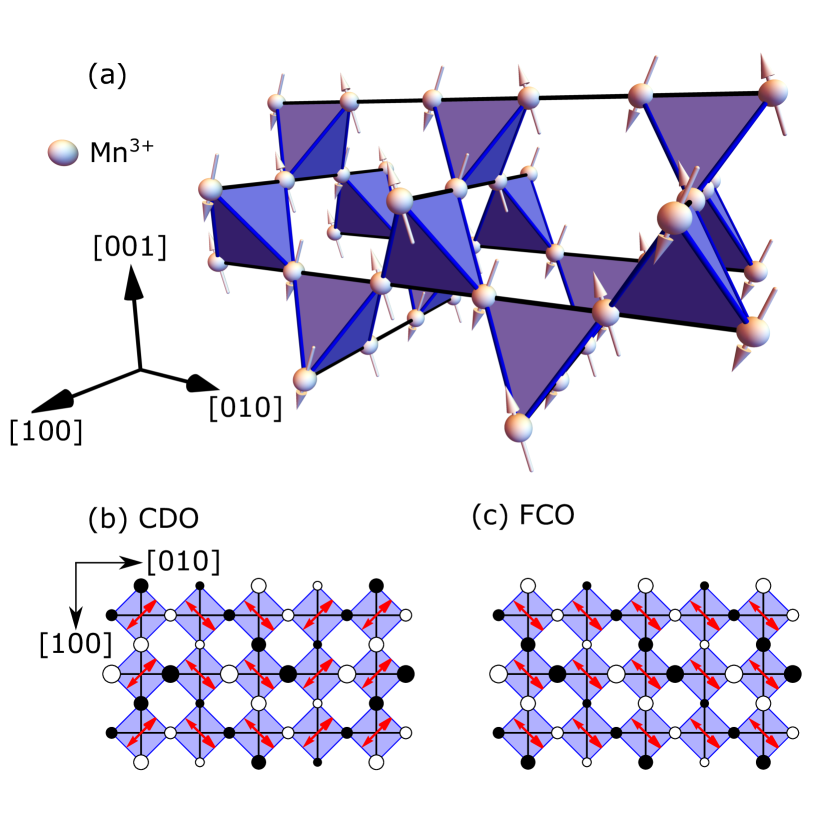
A structural modulation with a propagation vector identical to that of the magnetic modulation has also been observed,Nii et al. (2013) demonstrating the strong spin-lattice coupling in Mn3O4. This strong coupling is proposed to originate from the geometric frustration of the Mn3+ spins, which is only partially relieved by the high-temperature, cubic-to-tetragonal distortion.Nii et al. (2013); Chung et al. (2013) The resultant exchange striction in the magnetically-ordered state leads to a cell-doubled-orthorhombic (CDO) structure whose modulation is of the form pictured in Fig. 1(b) below K.
It is known that structural and magnetic symmetry changes in Mn3O4 can be induced with modest magnetic fields applied in the plane (magnetic easy plane).Kim et al. (2010, 2011); Nii et al. (2013) For example, cooling a sample in the presence of a T magnetic field applied along the direction drives a uniform orthorhombic distortion of the lattice via spin-orbit coupling and inverse exchange striction.Nii et al. (2013) The resultant face-centered-orthorhombic (FCO) structure is proposed to be of the form pictured in Fig. 1(c).
Interestingly, there have been varying reports of partial or complete transitions to FCO symmetry at low temperatures even in the absence of a magnetic field, leading to phase coexistence. In single crystals of Mn3O4, Chung et al. report an instability along the axis, leading to a partial FCO distortion,Chung et al. (2013) and Kim et al. report a complete transformation to FCO symmetry.Kim et al. (2011) Furthermore, in a study of polycrystalline Mn3O4, Kemei et al. report a >50% FCO phase fraction at low temperatures and propose that a partial FCO transition is intrinsic and may be governed by internal strains.Kemei et al. (2014) These varying results raise questions regarding how the ground state properties of Mn3O4 are affected by twin domains, impurities, and other structural properties influenced by specific crystal growth conditions.
Crystals of Mn3O4 are often grown out of a melt ( K); however, such crystals may display twin domains due to the K cubic-to-tetragonal transition in this material.Nielsen (1969); Yamamoto et al. (1972) The strains near twin domain walls may lead to a partial FCO transition, although this issue has yet to be explored in crystals of Mn3O4. Furthermore, the misalignment of twin domains prevents an external magnetic field from creating a homogeneous state. In spectroscopic studies, this inhomogeneity obscures the identification of excitations associated with specific magnetostructural phases.
In this report, we grow untwinned crystals of Mn3O4 from a flux at K, i.e., below the cubic-to-tetragonal transition. This allows us to study the characteristic magnons and phonons associated with each magnetostructural phase of Mn3O4 using Raman spectroscopy—a high-resolution ( meV) probe of the energies and symmetries of excitations in materials. We are able to isolate the CDO and FCO phases of Mn3O4 by applying an external magnetic field along the and directions, respectively, and we report the distinct Raman spectrum of each phase. We find that the number of modes and the polarization selection rules observed in each phase support the descriptions of the CDO and FCO phases discussed above. Finally, we obtain Raman spectra of twinned Mn3O4 crystals, grown from a melt for comparison, and we find that twin domains do indeed increase the FCO phase fraction present at low temperatures.
II Experiment
II.1 Sample preparation
Following the work of Nielsen,Nielsen (1969) untwinned single crystals of Mn3O4 were grown at the University of Illinois using a flux method. Commercial powders of manganese(II,III) oxide (Alfa-Aesar, 99.997%) and anhydrous sodium tetraborate (‘Borax’, Alfa-Aesar, 99.5%) were combined in a one-to-one molar ratio, wet milled under ethanol for 12 hours using a FRITSCH Pulverisette P6 planetary ball mill, and dried in air at 150 ∘C to remove the ethanol. To control vaporization loss of Borax at high temperatures, the ‘crystalline seal’ method developed by Wanklyn was used.Wanklyn (1981) A double crucible was filled with the milled Mn3O4-Borax powder and the top was loosely sealed with a crimped-on lid. The double crucible was heated in a Lindberg/Blue box furnace to 1100 ∘C over 10 hours, held at that temperature for 2 hours, cooled to 900 ∘C over 12 hours, and then decanted as a standard ‘hot-pour’. The Mn3O4-Borax mixture that sealed the two crucibles together was dissolved by soaking the mixture alternately in deionized water and hydrochloric acid.
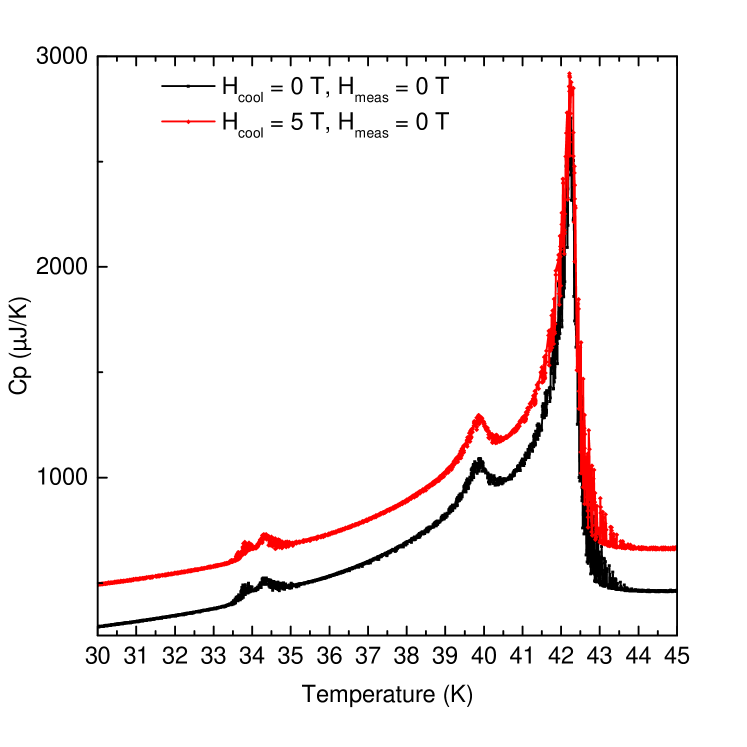
The untwinned Mn3O4 crystals were characterized with magnetization and heat capacity measurements (data shown in Appendix A), which show magnetic transitions at 42, 40, and 34 K, in good agreement with published data.Jensen and Nielsen (1974); Chardon and Vigneron (1986) The crystallographic orientations of the samples used in this experiment were determined via x-ray diffraction measurements performed at room temperature.
The resultant crystals are long, thin parallelepipeds, with approximate dimensions mm. The large crystal facets are parallel to and planes, while the long axis is parallel to the direction. The facets occasionally display visible faults, and x-ray diffraction reveals that there are two twin domains present in these crystals. The twins are related by a rotation about the long axis, and optical polarization studies confirm that the faults separate the two different crystallographic orientations. The same type of twinning has previously been observed on a microscopic scale in Mn3O4 grown at temperatures above the cubic-to-tetragonal transition.Couderc et al. (1994) The twin domains of the flux-grown crystals studied in this report are macroscopic (several mm in size) and much larger than the laser spot size ( m) used in the Raman scattering experiments performed here. Consequently, we were able to obtain Raman spectra from single-domain regions of these samples; we therefore refer to these crystals as ‘untwinned’ or ‘single-domain’ crystals.
For comparison, microscopically twinned crystals of Mn3O4 were grown from a melt using a floating-zone method described by Kim et al.Kim et al. (2011) The structural and magnetic properties of the resulting crystals are reported elsewhere.Kim et al. (2010, 2011); Kim (2011) The crystals exhibit three magnetic transitions at 43, 39, and 33 K, consistent with previously reported temperatures.Jensen and Nielsen (1974); Chardon and Vigneron (1986) These samples did not exhibit polarization selection rules in Raman scattering measurements, indicating that the twin domains in these samples are smaller than the laser spot size ( m) used in the Raman scattering experiments; we therefore refer to these crystals as ‘twinned’ crystals.
II.2 Raman scattering measurements
Raman scattering measurements were performed using the 647.1 nm excitation line of a krypton ion laser. The incident laser power was limited to 10 mW and was focused to a -m diameter spot to minimize laser heating of the sample, which was estimated to be roughly 4 K. The scattered light from the samples was collected in a backscattering geometry, dispersed through a triple-stage spectrometer, and detected with a liquid-nitrogen-cooled CCD detector. The incident light polarization was selected with a polarization rotator, and the scattered light polarization was analyzed with a linear polarizer, providing symmetry information about the excitations studied. The samples were inserted into a continuous He-flow cryostat, which was horizontally mounted in the open bore of a superconducting magnet, allowing Raman measurements in the temperature range K and the magnetic field range T.
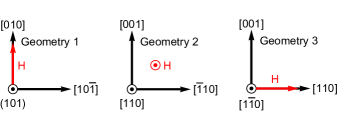
Three different scattering geometries were employed in the variable-magnetic-field measurements (see Fig. 2). Each geometry shown in Fig. 2 specifies the magnetic field orientation and the plane containing the incident- and scattered-light polarizations (scattering plane). Geometry 1 (Fig. 2, left) utilizes the as-grown crystal face, which presents a (or, equivalently, ) surface, and contains a () axis. A magnetic field was applied in the scattering plane along the () direction. The and directions become magnetically inequivalent in the magnetically-ordered state, with labeling the magnetization direction by convention.Jensen and Nielsen (1974) Accordingly, when a sufficiently large magnetic field is applied along the () axis to form a single magnetic domain,dom we refer to that direction as the direction.
Crystals were also cut and polished to present a face normal to the (or, equivalently, ) direction. A magnetic field was applied either along the normal of the scattering plane (Geometry 2; see Fig. 2, middle) or in the scattering plane along the () direction (Geometry 3; see Fig. 2, right). It is known that a sufficiently large magnetic field applied along the () axis in the magnetically ordered state causes these directions to become magnetically and structurally inequivalent, as the crystal elongates along the direction of the applied magnetic field.Nii et al. (2013) We refer to this elongated direction as the direction.
III Results and discussion
III.1 Room-temperature phonon spectra
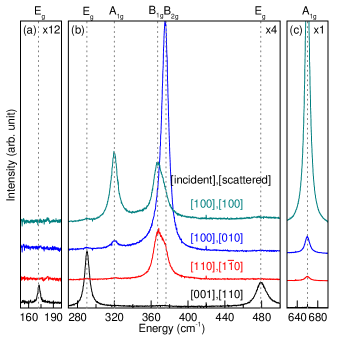
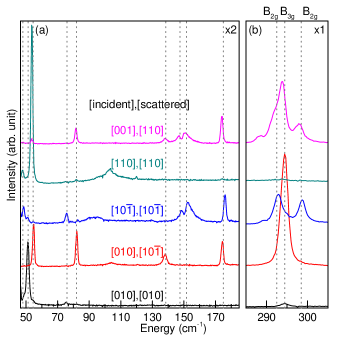
Figure 3 presents the K Raman spectra of an untwinned Mn3O4 crystal taken with various polarizations of the incident and scattered light. We observe seven of the ten Raman-active phonons predicted by a group theoretical analysis of the Mn3O4 crystal structure using the point group. The presence of polarization selection rules indicate well-defined crystallographic axes, as expected of an untwinned crystal, and the phonons exhibit symmetries consistent with the point group. To our knowledge, this is the first experimental determination of the Mn3O4 phonon symmetries.
In addition to demonstrating the absence of twinning in the crystals studied here, the phonon symmetry analysis in Fig. 3 shows for the first time that the large tetragonal distortion from cubic symmetry () is manifest in the phonon Raman spectra. For example, we observe a 54 cm-1 (6.75 meV) splitting between the cm-1 and cm-1 phonons at room temperature; these modes are expected to be degenerate above the cubic-to-tetragonal phase transition at K.*[See; forexample; Table1in][]Takubo2011
III.2 Temperature-dependent excitation spectra
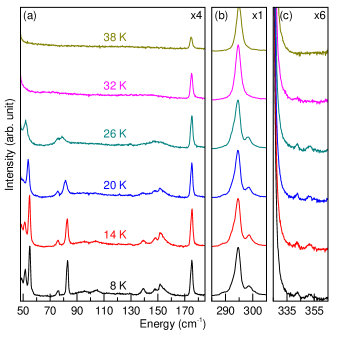
Figure 4 shows the temperature dependence of the untwinned Mn3O4 Raman spectrum (a) in the cm-1 energy range, (b) near the 295 cm-1 phonon, and (c) in the cm-1 energy range. There are three salient developments in Fig. 4 for K: (1) Eight new peaks develop in the low-energy range cm-1, which we attribute to one-magnon excitations following the analysis of Gleason et al.Gleason et al. (2014) (2) Two new phonon peaks appear at cm-1 and cm-1, whose energies and intensities are consistent with optical phonon modes that have been folded to the Brillouin zone center by a cell-doubling structural modulation. (3) The peak at 295 cm-1 develops additional structure, indicating a change in the crystal lattice structure discussed further below.
The first two features offer strong confirmation that simultaneous cell-doubling modulations of the magnetic and structural lattices develop below K. Previous studies of Mn3O4 observed the appearance of both magneticJensen and Nielsen (1974); Nii et al. (2013) and nuclearNii et al. (2013) superlattice reflections at for integer when K. Figure 4 shows that, for K, there is indeed a concomitant development of more than six magnon peaks and two new phonon peaks—consistent with enlarged magnetic and structural unit cells. These data provide direct spectroscopic evidence of simultaneous doubling of the magnetic and nuclear unit cells.
To clarify the last feature of Fig. 4 concerning a change in the crystal lattice for K, we performed a polarization analysis of the magnetic and vibrational excitations. The full details of the symmetry analysis are given in Appendix B, and the experimentally determined energies and symmetries of the observed excitations are tabulated in Table 1. Figure 5 shows representative spectra from this study. The symmetry selection rules exhibited by the phonon and magnon modes in Fig. 5 indicate that the low-temperature, zero-field-cooled phase of untwinned Mn3O4 has orthorhombic symmetry with , , and axes along the , , and directions, respectively.
The high-symmetry directions we observe are consistent with the modulation of the Mn tetrahedra proposed by Nii et al. and illustrated in Fig. 1(b).Nii et al. (2013) We note that the displacement pattern shown in Fig. 1(b) removes the twofold rotations about the and axes, as well as any mirror operations in planes orthogonal to these directions. On the other hand, the twofold rotations about the and axes are preserved (up to a fractional translation, in the case of the axis).
We clearly resolve three non-degenerate phonons near 295 cm-1 in the CDO phase (see Fig. 5(b)), including a mode ( cm-1) and two modes ( and 298 cm-1). The tetragonal-to-orthorhombic transition is expected to split the cm-1 phonon into a phonon and a single phonon. The presence of a second phonon is associated with a phonon mode that has been folded to because of the structural modulation for K, similar to the folded phonon modes at 342 and 351 cm-1 discussed previously.
Based on the number of modes we observe and their respective polarization selection rules, we conclude that untwinned Mn3O4 transitions to the CDO phase depicted in Fig. 1(b) for K in the absence of a magnetic field. An explanation for reports of partial or complete transitions to an FCO phase at low temperatures is given in §III.4.
III.3 Magnetic-field-dependent excitation spectra
Previous studiesKim et al. (2010, 2011); Nii et al. (2013) have shown that an applied magnetic field can significantly influence the crystal lattice of Mn3O4, and that the structural response depends on the orientation of the applied field. For example, a recent x-ray and neutron scattering study by Nii et al. reported that a magnetic field applied along the direction stabilizes the FCO phase with , , and axes along the , , and directions, respectively.Nii et al. (2013) Additionally, no satellite peaks were observed in neutron and x-ray diffraction measurements of the FCO phase, indicating the structural and magnetic modulations are absent in this phase.Nii et al. (2013) Our spectroscopic studies of untwinned Mn3O4 allow a further elucidation of the magnetic-field-induced phases of Mn3O4, by allowing us to study simultaneously the magnetic and phonon excitation spectra while applying a magnetic field along well-defined crystallographic directions. We will first show that a magnetic field applied along the direction does indeed lead to a transition to the FCO magnetostructural phase. Next, we will show that a magnetic field applied along the direction preserves the CDO magnetostructural phase. However, we will also show that reversing the magnetic field from to induces a CDOFCOCDO transition.
III.3.1 : face-centered-orthorhombic phase
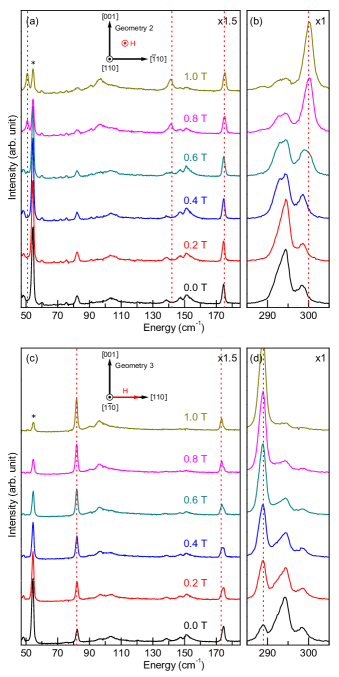
Figure 6 shows the magnetic-field dependence of the Raman spectrum in the energy ranges cm-1 and cm-1 for a magnetic field applied along the direction measured in (a),(b) Geometry 2 and (c),(d) Geometry 3 at K. The two scattering geometries are employed to allow the observation of nearly all of the Raman-active modes. For all measurements, the sample was zero-field-cooled from room temperature to K before a magnetic field was applied. The resulting T and K Raman spectra (bottom curves in Figs. 6(a) and 6(b)) are consistent with the CDO phase, as discussed in §III.2.FCO When , as the magnetic field magnitude is increased, the spectra in Fig. 6 change dramatically in the range T, indicating a magnetostructural phase transition. No further changes in the spectra are observed for T (data not shown). We show below that the phase stabilized for T with is consistent with the FCO phase, in agreement with the results of Nii et al.Nii et al. (2013)
To verify the FCO symmetry of the magnetostructural phase for T and , we performed a polarization study of the magnetic and vibrational excitations in this phase regime. The full details of the symmetry analysis are given in Appendix B, and the experimentally determined energies and symmetries of the observed excitations are tabulated in Table 1. Fig. 7 shows representative spectra from this study. The broad, asymmetric peak at in the FCO phase is identified as a two-magnon excitation based on the analysis of Gleason et al. and will not be discussed.Gleason et al. (2014) The phonon and magnon modes exhibit symmetry selection rules that are consistent with an FCO structure having , , and axes along the , , and directions, respectively. These new high-symmetry axes can be understood by examining the displacement pattern proposed by Nii et al.Nii et al. (2013) and depicted in Fig. 1(c). The uniform distortion of the Mn tetrahedra removes the twofold rotational symmetry about the and axes, as well as the mirror operations in planes orthogonal to these directions. On the other hand, the lattice depicted in Fig. 1(c) possesses twofold rotational symmetry about the and directions, which is consistent with the selection rules we observe. Furthermore, the splitting between the two normal modes near 295 cm-1 is cm-1 in the FCO phase, which is times larger than the splitting between the equivalent modes in the CDO phase. As this splitting reflects the loss of fourfold symmetry in the plane, a larger splitting in the FCO phase makes sense, given the more pronounced asymmetry between the in-plane, high-symmetry directions caused by the uniform distortion of the crystal.
To complete the characterization of the FCO phase, we examined the folded optical phonons, which are a signature of the structural cell-doubling modulation. Figure 8 shows the magnetic-field dependence of (a) the phonon spectrum in the cm-1 energy range and (b) the folded phonons near 342 cm-1 and 351 cm-1 for and K. As discussed above, the T phonon and magnon spectra of untwinned Mn3O4 below K are indicative of the CDO phase.FCO When , the intensities of the folded phonons diminish with increasing magnetic field. For T, the folded phonon modes vanish as the FCO phase is stabilized, as indicated by the appearance of the cm-1 phonon and the suppression of the 293, 295, and 298 cm-1 phonons in Fig. 8(a) (compare with field dependence in Fig. 6(b)). This field dependence confirms that a magnetic field applied along the direction suppresses the cell-doubling structural modulation in Mn3O4, consistent with the results of Nii et al.Nii et al. (2013) Additionally, we observe fewer than six magnons in the FCO phase, as seen in Fig. 6, consistent with the number of spins in the FCO unit cell, indicating the magnetic cell-doubling modulation is not present in the FCO phase. These data provide further evidence that the structural and magnetic cell-doubling modulations are absent in the FCO phase.
A summary of the CDO and FCO excitation spectra is given in Table 1, which tabulates the experimentally determined energies and symmetries of the Raman-active one-magnon and one-phonon excitations with cm-1 for the CDO and FCO phases. Each normal mode can be assigned to an irreducible representation of the point group. The details of the analysis performed are given in Appendix B.
| Energy (cm-1) | () | ||
| CDO phase | FCO phase | ||
| Magnon | 49 | — | Ag |
| 51 | 51 | Ag | |
| 54 | — | B1g | |
| — | 56 | B1g | |
| 75 | — | Ag | |
| 83 | 83 | B3g | |
| 139 | — | B3g | |
| — | 142 | B2g | |
| 148 | — | B2g | |
| 152 | — | B2g | |
| Phonon | — | 174 | B3g |
| 175 | — | B2g | |
| 175 | — | B3g | |
| — | 176 | B2g | |
| — | 289 | B3g | |
| 293 | — | B2g | |
| 295 | — | B3g | |
| 298 | — | B2g | |
| — | 300 | B2g | |
III.3.2 : cell-doubled-orthorhombic phase
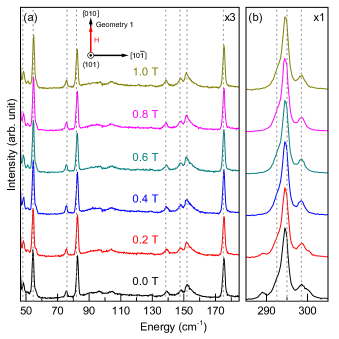
We next show that a magnetic field applied along the magnetic easy axis preserves the CDO phase in untwinned Mn3O4. Figure 9 shows the magnetic-field dependence of the Raman spectrum (a) in the cm-1 energy range and (b) near 295 cm-1 for at K. The sample was zero-field-cooled from room temperature to K before the magnetic field was applied. Once again, the T Raman spectrum of untwinned Mn3O4 (bottom curve) is characteristic of the CDO phase.FCO
As the magnetic field is increased to T, the spectrum does not change appreciably. Moreover, no significant changes are observed in the spectrum for magnetic fields up to T (data not shown). We conclude that the CDO phase is stable for a magnetic field applied along the direction in Mn3O4.
Previous Raman scattering studies by Kim et al. reported that an FCO phase can be stabilized for magnetic fields applied in the plane.Kim et al. (2010, 2011) Indeed, our phonon Raman data are qualitatively similar to those of Kim et al.Kim However, Kim et al. reported that the FCO phase is stabilized for an T magnetic field oriented either along or orthogonal to the easy axis direction (),Kim et al. (2010, 2011) which conflicts with the results in §III.3.1 and §III.3.2 of this paper. Our results, as well as the results of Nii et al.,Nii et al. (2013) suggest that magnetic fields that stabilized the FCO phase in refs. [Kim et al., 2010] and [Kim et al., 2011] were actually along the or directions. This discrepancy likely results from an inconsistent use of both face-centered-tetragonal and body-centered-tetragonal settings when describing crystallographic orientations in refs. [Kim et al., 2010] and [Kim et al., 2011].
III.3.3 : phase hysteresis
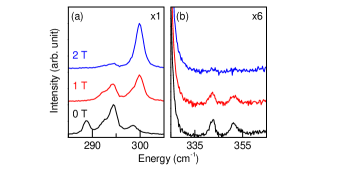
After applying a magnetic field along the direction and subsequently reducing the field to T, we occasionally found that the CDO spectrum would transform to the FCO spectrum. This motivated us to perform a sequence of measurements in which a magnetic field applied along the direction was cycled between and T. Figure 10 shows the Raman spectra of Mn3O4 for various fields in this sequence.
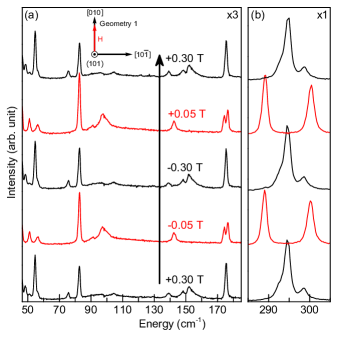
Figure 10 demonstrates that reversing a magnetic field along the direction can dramatically influence the phase fraction of Mn3O4. We have already identified and attributed the T Raman spectra (marked in black) to the CDO phase. The red spectrum observed at T is exactly the FCO spectrum formerly obtained by applying a T magnetic field along the direction, which can be seen by comparing the peaks in this spectrum with those in the T spectra in Fig. 6.
Note that we previously demonstrated that a magnetic field along the direction stabilizes the CDO phase. Remarkably, if the magnetic field is applied along the direction and subsequently reversed to the direction, the phase fractions change dramatically near T. In fact, the crystal intermediately transitions fully to the FCO phase before reverting to the CDO phase at higher field strengths. The ability to tune between the CDO and FCO phases with very small magnetic fields along the direction further illustrates that the free energies of these two phases are nearly degenerate in Mn3O4 at K.
III.4 Effect of twin domains
We have identified the distinct Raman spectra of the CDO and FCO phases of Mn3O4 at low temperatures. The near degeneracy of these phases is evidenced by the ability to manipulate the phase fraction at low temperature with modest magnetic fields applied in the plane. Consequently, it is likely that other parameters, e.g., strain, can also influence the phase fraction of Mn3O4. Indeed, an x-ray diffraction study by Kemei et al. reported phase coexistence in polycrystalline Mn3O4 at low temperatures, which was attributed to strain arising from domain walls.Kemei et al. (2014)
It is well established that growth temperature contributes to the presence or absence of structural domains in crystals of Mn3O4. As discussed in §I, twin domains can be introduced in Mn3O4 crystals by growing at temperatures above the K cubic-to-tetragonal Jahn-Teller transition, e.g., by growing crystals from a melt.Nielsen (1969); Yamamoto et al. (1972) On the other hand, untwinned Mn3O4 crystals can be obtained by growing at temperatures below the Jahn-Teller transition, e.g., from a fluxNielsen (1969) or via chemical vapor transportYamamoto et al. (1972).
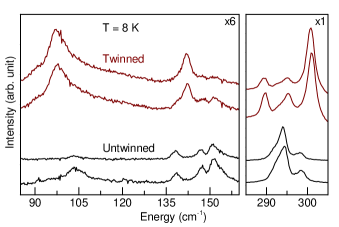
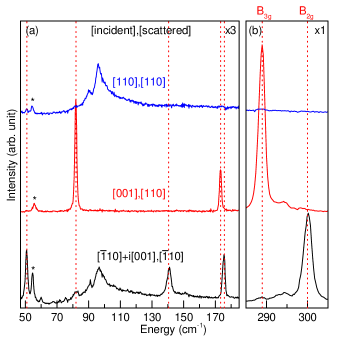
To study the effect of structural domains on the low-temperature phase fraction in Mn3O4 crystals, we compared Raman scattering spectra from both untwinned and twinned Mn3O4 crystals in the absence of a magnetic field. Figure 11 shows the zero-field-cooled, K Raman spectra of multiple untwinned and twinned Mn3O4 crystals. The untwinned crystals overwhelmingly exhibit the CDO phase, while the twinned crystals exhibit a coexistence of both CDO and FCO phases. This indicates that the low-temperature FCO phase fraction is strongly influenced by the presence of structural domains in Mn3O4 crystals, with structural domains promoting the nucleation of the FCO phase.
As the anisotropic responses of the electronic and structural properties of Mn3O4 to an applied magnetic field are thought to result from tuning between the CDO and FCO phases, controlling the phase fraction via the introduction of structural domains may present a novel mechanism for controlling the functional behavior of Mn3O4.
IV Summary
We performed a variable-temperature and variable-magnetic-field Raman scattering study of untwinned Mn3O4 crystals. By studying untwinned crystals, we are able to identify the distinctive magnetic and vibrational Raman excitation energies and symmetries of Mn3O4 for both the CDO and FCO phases at K. Our spectroscopic results for each phase support the microscopic description of the two magnetostructural phases given by Nii et al.Nii et al. (2013) We also report the effects of a magnetic field applied in the plane on the magnetostructural phase mixture of Mn3O4 at K. Specifically, we find that field orientations and for T select the CDO and FCO phases, respectively, in untwinned Mn3O4. Lastly, we compare the T, K Raman spectra of untwinned crystals to the spectra of twinned crystals of Mn3O4. We find that the presence of twin domains increases the low-temperature phase fraction of the FCO phase in crystals of Mn3O4. This result may explain the varying reports of partial or complete transitions to the FCO phase and also suggests a mechanism for controlling the low-temperature phase and functional behavior of Mn3O4.
Acknowledgements.
Research by T.B., S.L.G., and S.L.C. was supported by the National Science Foundation under Grant NSF DMR 14-64090. Research by A.T. and G.J.M. was supported by the NSF under Grant DMR-1455264-CAR.Appendix A Sample characterization
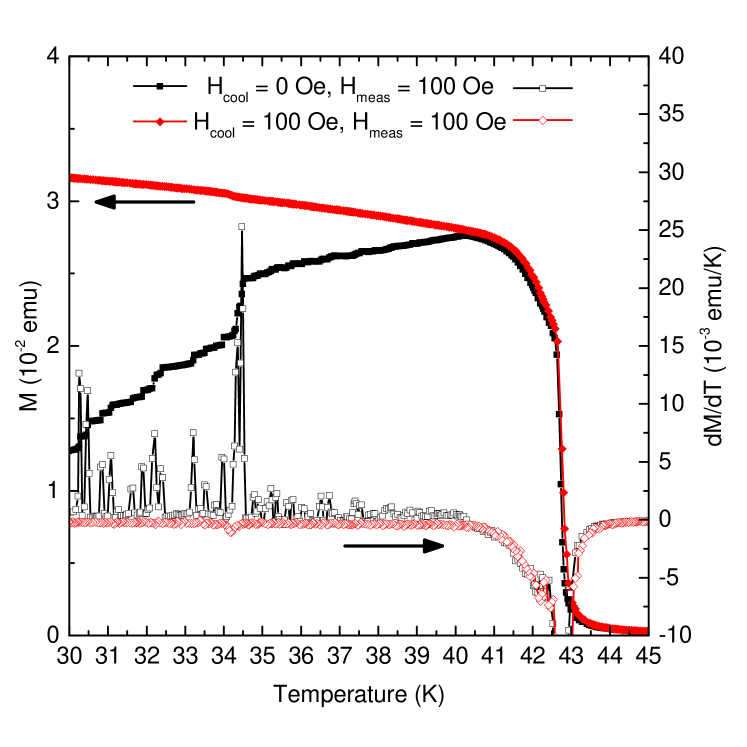
We collected DC magnetization data using a Quantum Design MPMS-3 (see Fig. 12), as well as heat capacity data using a Quantum Design PPMS-DynaCool (see Fig. 13). Both zero-field-cooled and field-cooled data are shown. The data show magnetic transitions at 42, 40, and 34 K, in good agreement with published data.Jensen and Nielsen (1974); Chardon and Vigneron (1986) The apparent 0.5 K splitting of the K cell-doubling transition in Fig. 13 is an artifact of the method by which we collected our data—one peak is from the warming part of the cycle, while the other is from the cooling section. As discussed by Guillou et al., this is a clear signature of a first-order phase transition.Guillou et al. (2011) It also suggests that the quality of these crystals is high, as low-quality, multi-grain crystals have transition temperatures which are too smeared out to see such sharp features.
Appendix B Polarization studies
At room temperature, the Bravais lattice of Mn3O4 is centered tetragonal. Two equivalent conventional unit cells are employed in the literature: a body-centered-tetragonal cell (Fig. 14, left) and a face-centered-tetragonal cell (Fig. 14, right). These coordinate systems differ by a rotation about the axis. In this paper, we choose the body-centered-tetragonal setting as our coordinate system.

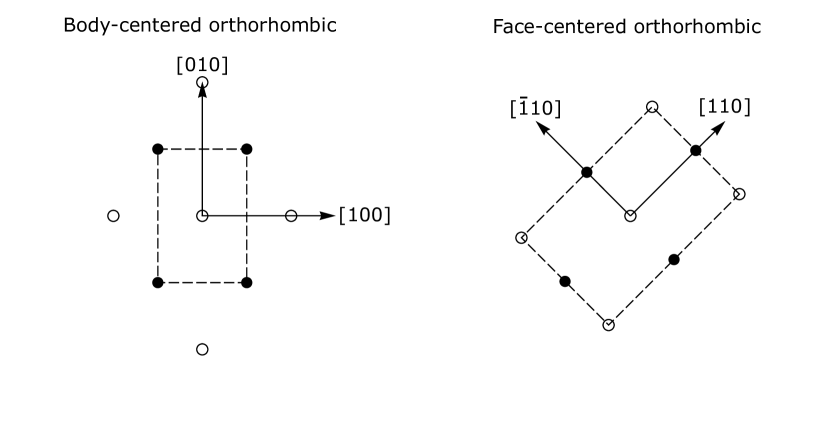
At room temperature, the Mn3O4 crystal structure possesses 4-fold rotational symmetry about the principal axis , up to a fractional translation. The crystal structure also has two pairs of 2-fold symmetry axes in the plane: the secondary axes and and the tertiary axes and .
The low-temperature, orthorhombic magnetostructural phases of Mn3O4, which form the subject of this paper, are distorted such that 4-fold symmetry is lost. Each phase retains only one pair of 2-fold symmetry axes in the plane. The cell-doubled-orthorhombic (CDO) phase retains 2-fold symmetry about the and directions (see Fig. 15, left). (Because the cell-doubling modulation present in this phase leads to a unit cell which is not internally centered, we refer to this phase as cell-doubled orthorhombic rather than body-centered orthorhombic.) On the other hand, the face-centered-orthorhombic (FCO) phase retains 2-fold symmetry about the and directions (see Fig. 15, right).
Table 2 presents the Raman tensors for each phase with respect to the body-centered-tetragonal coordinate system. Symmetric tensors were found sufficient to describe the polarization dependences observed for each peak’s intensity. Magnetic excitations are assigned to irreducible representations of the point group, rather than the monoclinic magnetic point group reported by Jensen et al., Jensen and Nielsen (1974) for the same reason.
| CDO Raman tensors | FCO Raman tensors | ||||||
|---|---|---|---|---|---|---|---|
B.1 Cell-doubled-orthorhombic phase
Seven configurations of incident and scattered light polarizations were used to determine the symmetries of excitations present in the CDO phase of Mn3O4. Each sample was field-trained to create a single domain prior to measurement. The obtained spectra are shown in Fig. 16. For each polarization configuration, the scattering amplitudes of the irreducible representations of the point group are tabulated in Table 3.
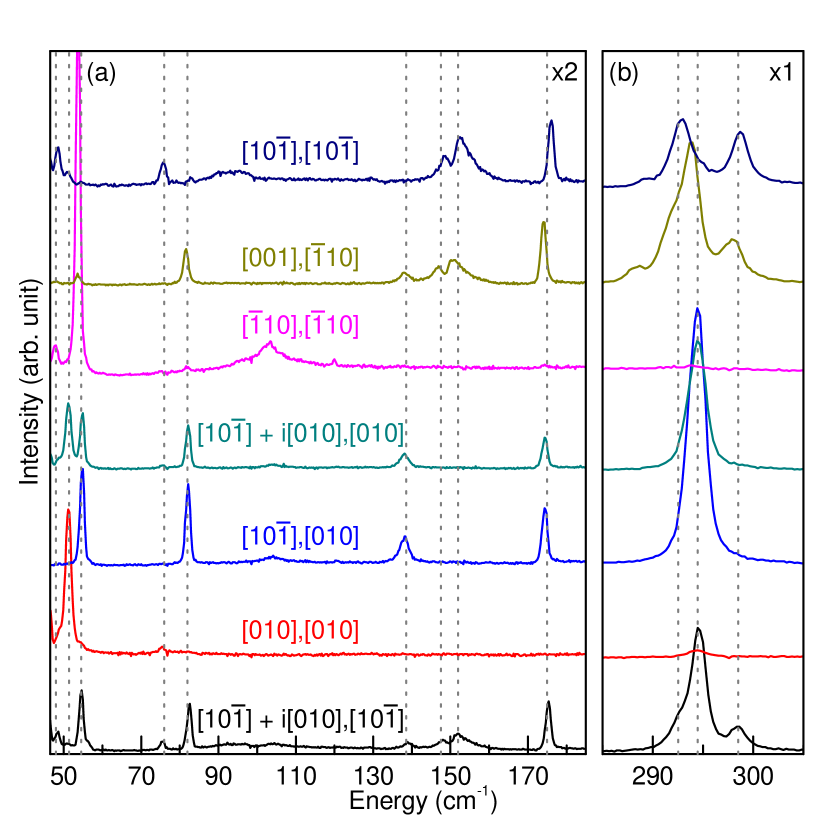
Each CDO normal mode can be assigned to an irreducible representation of the point group using the CDO Raman tensors presented in Table 2. This is not possible using the FCO Raman tensors, indicating that the high-symmetry directions in the CDO phase are along the and directions, as described previously. The experimentally determined energies and symmetries of the Raman-active magnetic and vibrational excitations with are tabulated in Table 4. We note that the Raman tensor of the mode appears to have , suggesting that this normal mode originates from a mode in the tetragonal () phase.
| Polarization | CDO Amplitude () | ||||
|---|---|---|---|---|---|
| Incident () | Scattered () | ||||
| CDO Excitation Symmetries | ||
|---|---|---|
| Excitation | Energy (cm-1) | () |
| Magnon | 49 | Ag |
| 51 | Ag | |
| 54 | B1g | |
| 75 | Ag | |
| 83 | B3g | |
| 139 | B3g | |
| 148 | B2g | |
| 152 | B2g | |
| Phonon | 175 | B2g |
| 175 | B3g | |
| 293 | B2g | |
| 295 | B3g | |
| 298 | B2g | |
B.2 Face-centered-orthorhombic phase
Six configurations of incident and scattered light polarizations were used to determine the symmetries of excitations present in the FCO phase of Mn3O4. Again, each sample was field-trained to create a single domain prior to measurement. The obtained spectra are shown in Fig. 17. For each polarization configuration, the scattering amplitudes of the irreducible representations of the point group are tabulated in Table 5.
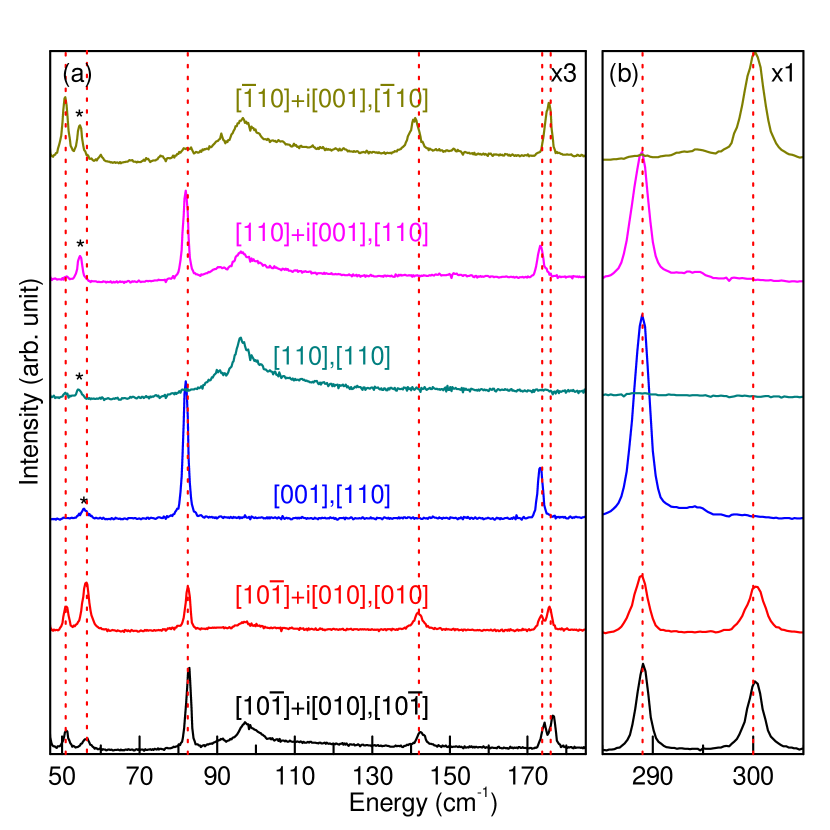
Each FCO normal mode can be assigned to an irreducible representation of the point group using the FCO Raman tensors presented in Table 2. This is not possible using the CDO Raman tensors, indicating that the high-symmetry directions in the FCO phase are along the and directions, as described previously. The experimentally determined energies and symmetries of the Raman-active magnetic and vibrational excitations with are tabulated in Table 6. The broad, asymmetric peak at in the FCO phase is identified as a two-magnon excitation based on the analysis of Gleason et al. Gleason et al. (2014) and will not be discussed.
| Polarization | FCO Amplitude () | ||||
|---|---|---|---|---|---|
| Incident () | Scattered () | ||||
| FCO Excitation Symmetries | ||
|---|---|---|
| Excitation | Energy (cm-1) | () |
| Magnon | 51 | Ag |
| 56 | B1g | |
| 83 | B3g | |
| 142 | B2g | |
| Phonon | 174 | B3g |
| 176 | B2g | |
| 289 | B3g | |
| 300 | B2g | |
Determining the symmetry of the cm-1 magnetic excitation is complicated by the peak at , which is a peak exclusive to the Raman spectrum of the CDO phase. To see this, note that the peak has a large scattering cross-section, as seen in Fig. 16. The nonzero peak intensity at in the FCO phase (Fig. 17) is due to the presence of a small, remnant CDO phase fraction indicated by a nonzero peak intensity at . In our analysis, we conclude that the peak at is absent in all but the bottom two curves in Fig. 17.
References
- Dagotto (2005) E. Dagotto, Science 309, 257 (2005).
- Dagotto et al. (2008) E. Dagotto, S. Yunoki, C. Şen, G. Alvarez, and A. Moreo, Journal of Physics: Condensed Matter 20, 434224 (2008).
- Ahn et al. (2013) K. H. Ahn, T. F. Seman, T. Lookman, and A. R. Bishop, Phys. Rev. B 88, 144415 (2013).
- Wu and Leighton (2003) J. Wu and C. Leighton, Phys. Rev. B 67, 174408 (2003).
- Snow et al. (2001) C. S. Snow, S. L. Cooper, D. P. Young, Z. Fisk, A. Comment, and J.-P. Ansermet, Phys. Rev. B 64, 174412 (2001).
- Kivelson et al. (1998) S. A. Kivelson, E. Fradkin, and V. J. Emery, Nature (London) 393, 550 (1998).
- Kimura et al. (2003) T. Kimura, T. Goto, H. Shintani, K. Ishizaka, T. Arima, and Y. Tokura, Nature 426, 55 (2003).
- Ramirez (1997) A. P. Ramirez, Journal of Physics: Condensed Matter 9, 8171 (1997).
- Lavrov et al. (2002) A. N. Lavrov, S. Komiya, and Y. Ando, Nature 418, 385 (2002).
- Kim et al. (2010) M. Kim, X. M. Chen, Y. I. Joe, E. Fradkin, P. Abbamonte, and S. L. Cooper, Phys. Rev. Lett. 104, 136402 (2010).
- Lawes et al. (2003) G. Lawes, A. P. Ramirez, C. M. Varma, and M. A. Subramanian, Phys. Rev. Lett. 91, 257208 (2003).
- Gschneidner et al. (2005) K. A. Gschneidner, Jr., V. K. Pecharsky, and A. O. Tsokol, Reports on Progress in Physics 68, 1479 (2005).
- Tackett et al. (2007) R. Tackett, G. Lawes, B. C. Melot, M. Grossman, E. S. Toberer, and R. Seshadri, Physical Review B 76, 024409 (2007).
- Lacroix et al. (2011) C. Lacroix, P. Mendels, and F. Mila, Introduction to Frustrated Magnetism: Materials, Experiments, Theory (2011).
- McCallum et al. (1976) R. W. McCallum, D. C. Johnston, C. A. Luengo, and M. B. Maple, Journal of Low Temperature Physics 25, 177 (1976).
- Irizawa et al. (2011) A. Irizawa, S. Suga, G. Isoyama, K. Shimai, K. Sato, K. Iizuka, T. Nanba, A. Higashiya, S. Niitaka, and H. Takagi, Phys. Rev. B 84, 235116 (2011).
- Kopeć et al. (2009) M. Kopeć, J. R. Dygas, F. Krok, A. Mauger, F. Gendron, B. Jaszczak-Figiel, A. Gagor, K. Zaghib, and C. M. Julien, Chemistry of Materials 21, 2525 (2009).
- Yamasaki et al. (2006) Y. Yamasaki, S. Miyasaka, Y. Kaneko, J.-P. He, T. Arima, and Y. Tokura, Physical Review Letters 96, 207204 (2006).
- Dey et al. (2014) K. Dey, S. Majumdar, and S. Giri, Physical Review B 90, 184424 (2014).
- Giovannetti et al. (2011) G. Giovannetti, A. Stroppa, S. Picozzi, D. Baldomir, V. Pardo, S. Blanco-Canosa, F. Rivadulla, S. Jodlauk, D. Niermann, J. Rohrkamp, T. Lorenz, S. Streltsov, D. I. Khomskii, and J. Hemberger, Physical Review B 83, 060402 (2011).
- Maignan et al. (2012) A. Maignan, C. Martin, K. Singh, Ch. Simon, O. I. Lebedev, and S. Turner, Journal of Solid State Chemistry 195, 41 (2012).
- Singh et al. (2011) K. Singh, A. Maignan, C. Simon, and C. Martin, Applied Physics Letters 99, 172903 (2011).
- Suzuki and Katsufuji (2008) T. Suzuki and T. Katsufuji, Physical Review B 77, 220402 (2008).
- Nii et al. (2013) Y. Nii, H. Sagayama, H. Umetsu, N. Abe, K. Taniguchi, and T. Arima, Phys. Rev. B 87, 195115 (2013).
- Kemei et al. (2014) M. C. Kemei, J. K. Harada, R. Seshadri, and M. R. Suchomel, Physical Review B 90, 064418 (2014).
- Van Hook and Keith (1958) H. J. Van Hook and M. L. Keith, Am. Mineral. 43, 69 (1958).
- Jensen and Nielsen (1974) G. B. Jensen and O. V. Nielsen, Journal of Physics C: Solid State Physics 7, 409 (1974).
- Chardon and Vigneron (1986) B. Chardon and F. Vigneron, Journal of Magnetism and Magnetic Materials 58, 128 (1986).
- Chung et al. (2013) J. H. Chung, K. H. Lee, Y. S. Song, T. Suzuki, and T. Katsufuji, Journal of the Physical Society Japan 82, 034707 (2013).
- Kim et al. (2011) M. Kim, X. M. Chen, X. Wang, C. S. Nelson, R. Budakian, P. Abbamonte, and S. L. Cooper, Phys. Rev. B 84, 174424 (2011).
- Nielsen (1969) O. V. Nielsen, Journal of Crystal Growth 5, 398 (1969).
- Yamamoto et al. (1972) N. Yamamoto, K. Nagasawa, Y. Bando, and T. Takada, Japanese Journal of Applied Physics 11, 1754 (1972).
- Wanklyn (1981) B. M. Wanklyn, Journal of Crystal Growth 54, 610 (1981).
- Couderc et al. (1994) J. J. Couderc, S. Fritsch, M. Brieu, G. Vanderschaeve, M. Fagot, and A. Rousset, Philosophical Magazine Part B 70, 1077 (1994).
- Kim (2011) M. Kim, Magnetic field- and pressure-tuned phases in LaxPryCa1-x-yMnO3 and Mn3O4: Inelastic light scattering studies and single crystal growth, Ph.D. thesis, University of Illinois at Urbana-Champaign (2011).
- (36) A magnetic field sufficiently large to remove any signature of domains in a polarization study. In the present case, approximately 0.2 T.
- Takubo et al. (2011) K. Takubo, R. Kubota, T. Suzuki, T. Kanzaki, S. Miyahara, N. Furukawa, and T. Katsufuji, Phys. Rev. B 84, 094406 (2011).
- Gleason et al. (2014) S. L. Gleason, T. Byrum, Y. Gim, A. Thaler, P. Abbamonte, G. J. MacDougall, L. W. Martin, H. D. Zhou, and S. L. Cooper, Physical Review B 89, 134402 (2014).
- (39) The peak at 54 cm-1 represents an excitation of the CDO phase with a relatively large cross-section, as seen in Fig. 5. A nonzero peak intensity at 54 cm-1 in the FCO phase is due to the presence of a small, remnant CDO phase fraction, as evidenced by a nonzero peak intensity at 295 cm-1.
- (40) The weak peak at 289 cm-1 indicates a minority FCO phase is present.
- (41) See Fig. 3(a) in ref. [Kim et al., 2010] and Fig. 8(a) in ref. [Kim et al., 2011].
- Guillou et al. (2011) F. Guillou, S. Thota, W. Prellier, J. Kumar, and V. Hardy, Phys. Rev. B 83, 094423 (2011).