present address: ]École Polytechnique Fédérale de Lausanne, 1015 Lausanne, Switzerland and Paul Scherrer Institute, 5232 Villigen PSI, Switzerland
present address: ]Paul Scherrer Institute, 5232 Villigen PSI, Switzerland
present address: ]Oak Ridge National Laboratory, TN 37831 Oak Ridge, USA
Anomalous thermal decoherence in a quantum magnet measured
with neutron spin-echo spectroscopy
Abstract
The effect of temperature dependent asymmetric line broadening is investigated in Cu(NO3)2.5D2O, a model material for a 1-D bond alternating Heisenberg chain, using the high resolution neutron-resonance spin-echo (NRSE) technique. Inelastic neutron scattering experiments on dispersive excitations including phase sensitive measurements demonstrate the potential of NRSE to resolve line shapes, which are non-Lorentzian, opening up a new and hitherto unexplored class of experiments for the NRSE method beyond standard line width measurements. The particular advantage of NRSE is its direct access to the correlations in the time domain without convolution with the resolution function of the background spectrometer. This novel application of NRSE is very promising and establishes a basis for further experiments on different systems, since the results for Cu(NO3)2.5D2O are applicable to a broad range of quantum systems.
pacs:
75.10Pq,75.40.Gb,75.50.Ee,61.05.fgI introduction
Thermal decoherence of quantum states is of wide-reaching importance for the application of quantum materials. The generic scenario encountered in condensed matter is due to quasiparticle interactions associated with exponential loss of coherence in the time domain and manifests in a symmetric Lorentzian-type line broadening in energy Bayrakci et al. (2006); Rønnow et al. (2001); Huberman et al. (2008); Xu et al. (2007). According to the standard quasi-particle interaction theory the principal effect of the temperature is to increase this Lorentzian line width corresponding to shortening the lifetime by more frequent collisions. Such behavior is accessible in magnetic systems Forster (1995); Marshall and Lovesey (1971) where even the appearance of universal line width behavior for chain systems has been proposed Sachdev (2011); Zheludev et al. (2008); Kenzelmann et al. (2001). However, in dimensionally constrained systems and those with hard core interactions it can be expected that strongly correlated effects should become evident and these will modify the decoherence in time away from an exponential form.
Experimental studies on Cu(NO3)D2O (copper nitrate), a model material for a 1-D bond alternating Heisenberg chain (AHC), have detected the development of non-Lorenzian line shapes using inelastic neutron scattering (INS) Tennant et al. (2012). Non-perturbative calculations which take into account the cummulative effect of quantum interference effects in collisions have predicted such non-exponential decoherence in the time domain and their non-Lorentzian energy line shapes Essler and Konik (2008, 2009). Further, the direct application to the dimerized chain James et al. (2008); Goetze et al. (2010) provides approximate agreement with the temperature dependence observed experimentally. Subsequently non-Lorentzian-type line broadening has been observed in a 3-D dimerized magnet Sr3Cr2O8, and it has been argued that these may be found in a broad range of quantum systems Quintero-Castro et al. (2012); Tennant et al. (2012).
In the present work, we explore the neutron spin-echo triple-axis technique (NRSE-TAS) Keller et al. (2002); Habicht et al. (2004) as an alternative approach to the study of line shapes and widths of spin excitations. The particular advantage of the neutron spin-echo method is its capability to directly probe correlations in the time domain, the natural dimension for such processes. NRSE-TAS gives access to time scales which correspond to features in energy in the eV-range and so is able to probe slow physical processes inaccessible to conventional INS. As a second advantage, background intensity has no influence on the line width or asymmetry due to the fact, that the background with its broad distribution in energy is depolarized and does not contribute to the measured NRSE signal. This is in contrast to conventional INS (ToF and TAS), where inaccuracies in background subtraction affects both the line width and the asymmetry. As a third advantage, the deconvolution of the data with the instrument resolution function necessary in conventional INS reduces to a simple normalization of the raw data in the case of spin-echo.
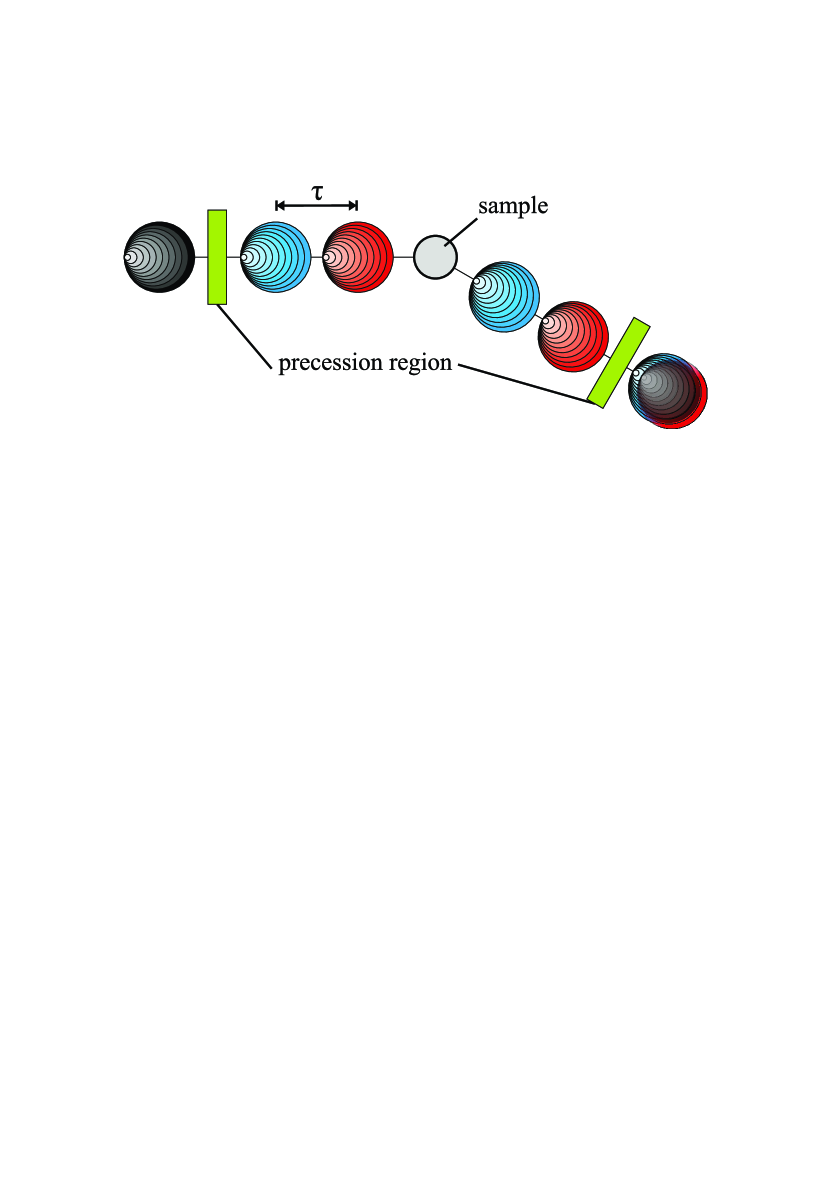
The quantity measured by neutron spin-echo is the polarization of the neutron beam , defined as the expectation value of the -component of the neutron spin operator. An intuitive picture is given in terms of two correlation volumes associated with spin up and spin down spin states Habicht (2003); Felber et al. (1998) (Fig.1). The correlation volumes are finite spatial regions with a well-defined phase correlation of the neutron wavefunction. The longitudinal and transverse widths of the correlation volume are the inverse of the divergence and monochromaticity of the neutron beam, respectively. Inside the precession regions, the kinetic energies of the spin up and spin down states splitGolub et al. (1994) and the two correlation volumes acquire a relative time delay (spin-echo time). The spin states then scatter at the sample at times and , where is identical to the van-Hove correlation time Gähler et al. (1998). After cancellation of the time-delay in a second inverted precession region, the scattered waves interfere at the detector such that the polarization is a direct measure of the time-dependence of the intermediate scattering function :
| (1) |
is the mean energy of the excitation. The instrumental resolution is proportional to , which is limited only by the homogeneity of the precession field and is independent of the size and shape of the correlation volumes. As theories are usually formulated in the momentum-energy space , in practice eq. (2) is used to model spin-echo data:
| (2) |
where is the scattering function. The factor describes the transmission of the so-called background spectrometer, a TAS in the present case. Usually is much broader than the narrow line widths studied with spin-echo and thus is set to unity. The resolution function includes effects from the sample, such as mosaic spread and curvature of the dispersion sheet, and instrumental effects resulting, for example, from small imperfections of the precession regions Habicht et al. (2003).
Classical NSE instruments based on DC fields generated by long solenoids were very successful during the past decades in the study of quasi-elastic scattering, i.e. with a mean energy transfer of zero. Famous examples of non-exponential relaxation with non-Lorentzian line shapes observed by NSE include relaxation of spin-glasses Mezei (1980); Pickup et al. (2009), the stretched exponential relaxation of glasses Mezei et al. (1987a, b), deviations from the exponential relaxation in ferromagnets Mezei (1986); Mezei et al. (1989) or the characteristic relaxation due to reptation in polymers Richter et al. (1990); Schleger et al. (1998). For the study of excitations outside the quasi-elastic regime with finite energy, such as phonons and magnons, it proved necessary to combine the spin-echo and the triple axis (TAS) techniques and thus to select a small region in the space. A first version of the spin-echo TAS method using DC precession coils found indirect evidence for non-Lorentzian line shapes for a phonon mode in germaniumKulda et al. (2004). In previous studies of spin excitations using NRSE-TAS, only Lorentzian line shapes were observed Bayrakci et al. (2006); Náfrádi et al. (2011); Bayrakci et al. (2013).
II experiment
Copper nitrate (Cu(NO3)2.5D2O) is a near ideal 1-D dimerized spin- antiferromagnet Garay (1968); Morosin (1970); Xu et al. (2000); Tennant et al. (2003). The alternating Heisenberg chains are formed of spin-1/2 moments on the Cu2+ ions and symmetry equivalent chains lie along the and the directions, which project onto the same direction on the (h 0 l)-plane. The dimerization gives rise to a singlet ground state and the elementary excitation is a triplet of spin-1 states Barnes et al. (1999) corresponding to excited dimer states that hop from site-to-site along the chain. For the dominant exchange couplings (interdimer meV, intradimer meV) the magnon bandwidth is small compared to the gap and due to the small alternation ratio , there is a clear energy separation of about meV between intra-band transitions, single magnon excitations, and two magnon continua even at high temperatures Tennant et al. (2012).

High-quality single crystals of Cu(NO3)D2O were grown at the HZB, Berlin, using the enrichment and solution growth method Tennant et al. (2012). The single crystal used throughout the experiments had a mass of g and a deuteration ratio of %.
The NRSE-TAS spectrometer TRISP Keller et al. (2002) (Fig. 2) at the FRM II was used to study the one-magnon mode at at the minimum of the dispersion corresponding to r.l.u., meV, where the intensity is maximized. The copper-nitrate crystal was aligned in the scattering plane in a closed cycle 3He cryostat. TRISP was operated with a graphite monochromator and a Heusler analyzer, with scattering sense , , at the monochromator, sample, and analyzer, respectively ( is clockwise). With , the TAS energy resolution in this configuration is (vanadium width, FWHM), which was in the present case sufficient to suppress the elastic background to about of the signal amplitude. The frequencies applied to the coils (see Fig. 2) were tuned according to the spin echo tuning conditions eqs. (4,5) in ref.Habicht et al. (2004).
At TRISP, the polarization of the neutron beam (eq. (2)) is determined by scanning the coil C4 along the beam direction, such that the length of the second precession region differs by from the first one. This leads to a sinusoidal variation of the count rate , where one period corresponds to a rotation of the neutron spins. is the effective neutron Larmor frequencyGähler and Golub (1988), is the neutron mass. This scan is repeated for different values of , with the present parameters . The polarization is the contrast of the modulated count rate
| (3) |
where is the mean intensity corresponding to , is a phase offset.
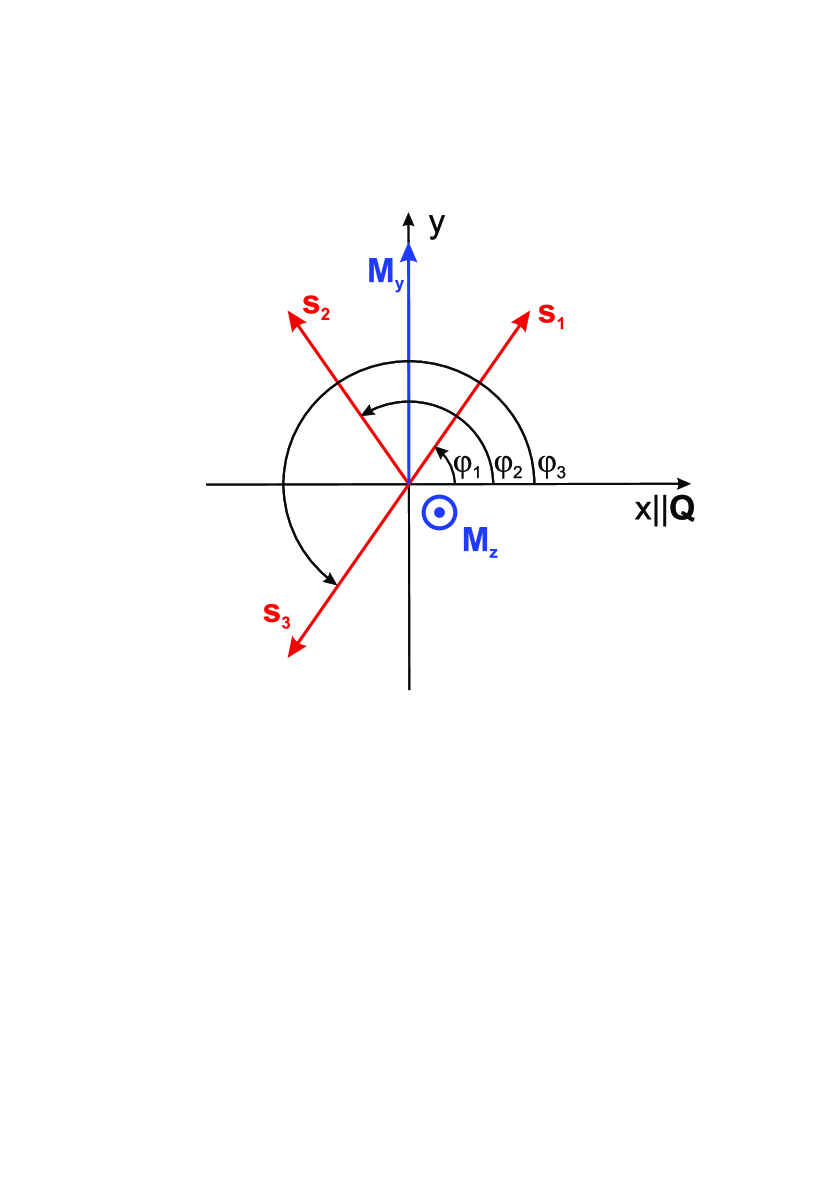
One complication met in spin-echo experiments on spin excitations arises from the spin flips of the neutron spins during the scattering process (Fig. 3). In spin-echo, the neutron spins accumulate different Larmor phases in the first precession region due the spread in , which is with in the present experiment. This spread of the phase is proportional to , and typically is much larger than at the highest fields. Thus at the sample, the neutron spin phases are spread within a plane perpendicular to , the precession plane. At TRISP, is vertical, and the precession plane is horizontal. This situation is different to 1-D polarization analysisMoon et al. (1969), where at the sample all neutron spins are aligned in the same direction, parallel (or anti-parallel) to a guide field. If no spin flip occurs during scattering in the spin-echo spectrometer (nuclear scattering), the polarization is recovered in the second precession region with inverted field direction and forms the so called spin-echo Mezei (1980). For the spin flip scattering in spin-echo experiments, the two cases of spin fluctuations and have to be distinguished (Fig 3): adds a phase to the neutron spin phase, whereas inverts the sign of the neutron spin phase, and thus effectively inverts the sign of the first precession field . Thus, to fulfill the echo condition for () fluctuations, the polarity of the fields must be anti-parallel (parallel)Tseng et al. . If both types of spin fluctuations contribute with equal amplitudes, it is better to choose the parallel field configuration, as in this case nuclear non-spinflip background is dephased and will not contribute to the polarization. In practice, the magnetic structure and the fluctuations are often not exactly known or obscured by the formation of domains. Thus at TRISP the suitable configuration (parallel or anti-parallel) is experimentally determined. In the present case, both and were expected to contribute equally to the aforementioned flips, but the anti-parallel configuration showed better polarization close to the expected and therefore was chosen for the subsequent measurements.
Spin-echo data were collected at 4 temperatures (, , , ) below the characteristic activation temperature of the gap (K), for in the range to . Typical count rates were and at and , respectively. A background rate of was subtracted from all scans.
III data analysis
A phenomenological function describing an asymmetric modified Lorentzian lineshape has been used for the analysis of magnon line shapes measured by ToF-INS Tennant et al. (2012):
| (4) |
Here, the argument of the usual Lorentzian is replaced by a polynomial, that includes two parameters to model the asymmetry, an asymmetry term , and a damping term . A symmetric Lorentzian is obtained for . The function provides reasonable results for fitting the ToF data in the space, but tends to give unphysical solutions with several peaks at the zeros of the polynomial when applied to the spin echo data. To avoid these multiple peaks, we keep and as independent variables, and calculate , such that the second derivative of has only two zeros, defining the inflection points of the peak. Other representations of asymmetric LorentziansStancik and Brauns (2008) with only one asymmetry parameter gave no satisfactory description of the ToF data.
The usual way to model NRSE data consists in a 2-step fitting process. First, the magnitude of the polarization and the phase for one value are determined by fitting eq. (3) to the raw data (Fig. 2, inset). Then the model is fitted to using eq. (2). The phase in eq. (3) is usually neglected, as it contains only a trivial factor . In the present case with asymmetric linewidths, also carries information about the asymmetry, and thus was included in the analysis. Besides the structure factor , and the spectral width of the incident beam, also the aforementioned spin flips and the TAS energy resolution have to be modeled in the data analysis, but it proves difficult to implement all these factors in an analytical expression. In a first attempt we calculated the polarization using a Monte Carlo (MC) ray tracing simulation of the spectrometer, which tracks the spin phase of individual neutrons running through the precession regions and spectrometer. The TAS was simplified by defining a Gaussian spectrum for the incident neutrons ( (FWHM)), and a Gaussian probability distribution of energy transfers ( FWHM). The fitting procedure based on this simulation took excessively long time to converge, as the minimization algorithm of the fitting function James (1994) is disturbed by the statistical noise of the MC algorithm. Finally we simplified the model by using discrete equally spaced values instead of random numbers to select the and .
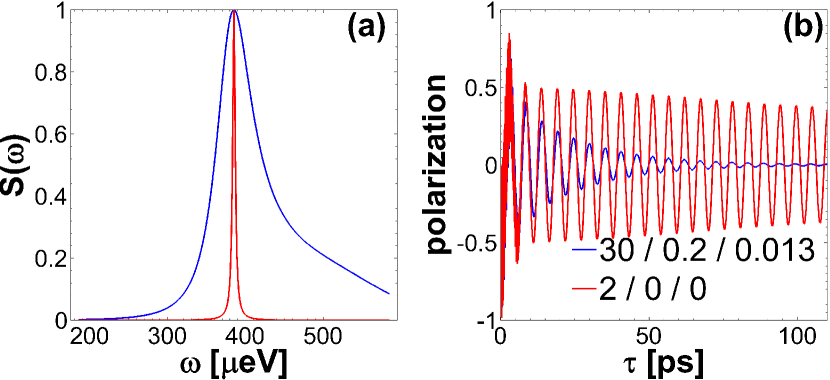
The model is shown in Fig. 4 for a narrow symmetric Lorentzian and a broad asymmetric line. shows fast oscillations for arising from an interference of the spins flipped by fluctuations and , which were assumed to contribute with equal weight. In the chosen anti-parallel configuration the component does not obey the echo condition and is rapidly damped. In the present experiment with , these fast interference oscillations are not visible. The weight of the component determines the constant factor in eq. (3), where for isotropic fluctuations we expect , which is in good agreement with obtained for the present data. The phase shift between the two curves in Fig. 4(b) is in the order of a few and is similar to the data in Fig. (7).
IV results and discussion
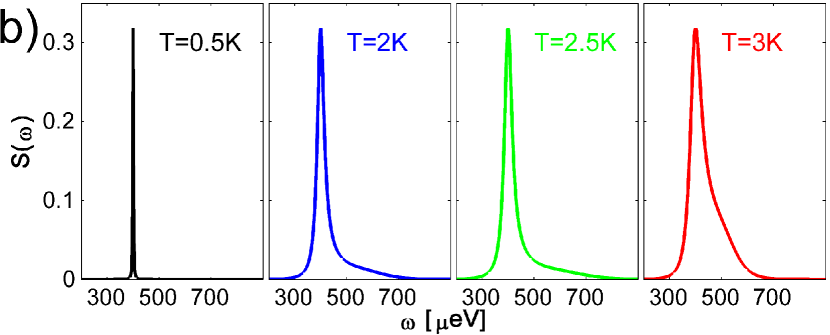
(b) The resulting fit parameters for the different temperature sets correspond to the plotted . With increasing temperature a clear asymmetry develops.
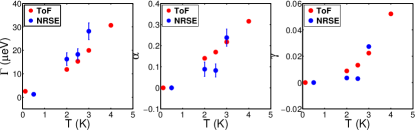
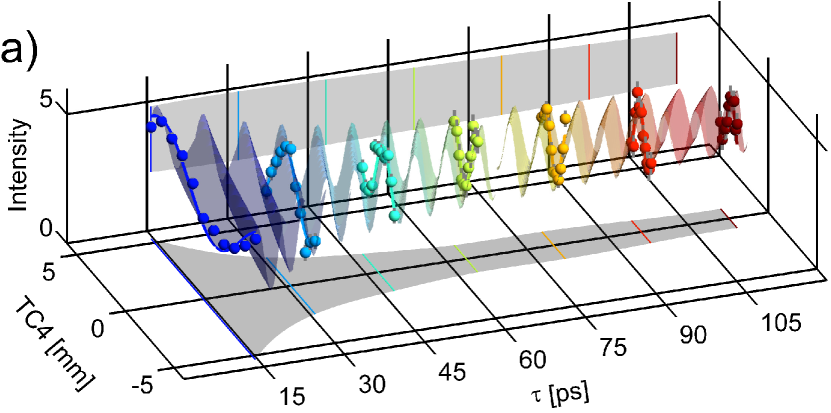
Fig. 5 shows the data and the model for . The data where collected by scanning the length of the second precession region for a set of spin-echo times . The structure factors resulting from the fit show a clear asymmetry increasing with . The resulting parameters , , and (eq. (4)) are plotted in Fig. 6 and are compared to the parameters obtained for the ToF data fitted with the same model, where both for the spin-echo and the ToF data is calculated from and . The agreement between the two methods is surprisingly good, although the analysis of the ToF data included subtraction of a sloping background and deconvolution with a Gaussian resolution function (). At first sight, the quality of the spin-echo data looks worse than ToF with larger errorbars and thus an increased scatter. On the other hand, the intrinsic width and the asymmetry are obtained by spin-echo method without including assumptions about the background or the spectrometer resolution. The larger error bars on the spin-echo data are due to the low count rates, as in spin-echo the losses in the neutron polarizer and analyzer cost about 2/3 of the intensity, and additionally the polarization and thus the signal is reduced by a factor of 2 due to the flips of the neutron spins upon scattering.
In the following paragraphs the phase of the polarization resulting from our model (Fig. 4) is discussed. For a symmetric , a phase shift at a constant occurs only if the peak of the line shifts, but is otherwise independent of the width or shape of this line:
| (5) |
Eq. (5) is frequently used to determine the -dependence of the excitation energy . With and a typical statistical error in the phase of a few degrees, energy shifts on the order of can be detected without knowledge of the line shape and width Fåk et al. (2012).
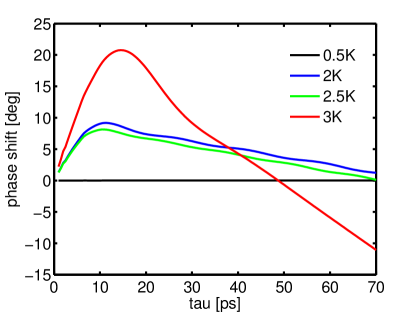
This powerful method for measuring the renormalization of fails in the present case with a -dependent asymmetry of the line shape. The phase shift between the polarization curves (see Fig. 4) for the parameters obtained from the fits of the spin-echo data from Fig. 5 are plotted in Fig. 7. Here the phase of the lowest temperature was taken as a reference. The clear non-linear evolution of the phase shift is a direct consequence of the non-linear lineshapes. This also means that applying eq. (5) to non-symmetric lineshapes leads to meaningless results for the energy shift . The relation between and the asymmetry depends on the specific line shape and can in general only be calculated numerically from eq. 2.
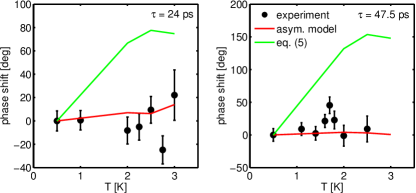
To further investigate the breakdown of the simple relation in eq. (5), we measured for two values of , and , again such as all previous measurements at the minimum of the dispersion curve at . The data vs. are displayed as black dots in Fig. 8. The phase shift resulting from our model for the parameters of Fig. 6 shows good agreement with the data within statistical accuracy. In contrast, the phase shift calculated from eq. (5), where was taken as the shift of the center of gravity of the asymmetric line with parameters Fig. 6, clearly disagrees with the experimental data.
The observation that the phase of the polarization obtained from asymmetric lineshapes with a T-dependent asymmetry is not proportional to is one of the main results of this paper. Thus in this case application of eq. (5) to calculate will lead to wrong results. On the other hand the phase carries information about the line shape and thus should be included in the fit determining
V conclusions
A new application of the NRSE method dedicated to line shape analysis on dispersive excitations has been presented opening up opportunities to look at strongly correlated quantum systems and extend beyond the more conventional systems investigated so far. This method was applied to the temperature dependent asymmetric line broadening present in the 1-D bond alternating Heisenberg chain material Cu(NO3)D2O. The results clearly demonstrate that the NRSE approach has the potential to detect anomalous effects due to strong correlations, which arise from the dimensional constraint of the system and hard core interactions of the excited states Tennant et al. (2012). The particular advantage is the direct access to decoherence in the time domain and therefore the method complements the frequency measurements using conventional neutron spectroscopy. Further, the NRSE method does not depend on systematic errors arising from the convolution with the resolution function as in conventional spectroscopy. Its extremely high resolution also opens up the possibility to overcome the resolution limitations of energy domain measurements imposed by monochromating components.
Furthermore, as the second important result it could be shown, that for a line shape differing from a Lorentzian the phase of the spin-echo signal becomes a non-linear function of the spin-echo time . In this regard analysis beyond the conventional phase shift of a single spin echo time is necessary.
The results and applications are promising and establish a basis for further experiments on different quantum systems and high resolution measurements of edge singularities can now be made to test field theories and critical exponents in quantum critical systems.
Acknowledgements.
The authors would like to thank Prof. Dr. Bella Lake (HZB) and Dr. Diana Lucia Quintero-Castro (HZB) for fruitful discussions and Kathrin Buchner (MPI) for technical support during the experiments. This work is based upon experiments performed at the TRISP instrument operated by MPG at the Forschungs-Neutronenquelle Heinz Maier-Leibnitz (FRM II), Garching, Germany. T.K. acknowledges financial support from the Deutsche Forschungsgemeinschaft through TRR80.References
- Bayrakci et al. (2006) S. Bayrakci, T. Keller, K. Habicht, and B. Keimer, Science 312, 1926 (2006).
- Rønnow et al. (2001) H. M. Rønnow, D. F. McMorrow, R. Coldea, A. Harrison, I. D. Youngson, T. G. Perring, G. Aeppli, O. Syljuåsen, K. Lefmann, and C. Rischel, Phys. Rev. Lett. 87, 037202 (2001).
- Huberman et al. (2008) T. Huberman, D. A. Tennant, R. A. Cowley, R. Coldea, and C. D. Frost, J. Stat. Mech.-Theory Exp. , P05017 (2008).
- Xu et al. (2007) G. Xu, C. Broholm, Y.-A. Soh, G. Aeppli, J. F. DiTusa, Y. Chen, M. Kenzelmann, C. D. Frost, T. Ito, K. Oka, and H. Takagi, Science 317, 1049 (2007).
-
Forster (1995)
D. Forster, Hydrodynamic
Fluctuations, Broken Symmetry,
and Correlation Functions, Advanced Book Classics (Basic Books, 1995). - Marshall and Lovesey (1971) W. Marshall and S. Lovesey, Theory of thermal neutron scattering, International series of monographs on physics (Clarendon Press, 1971).
- Sachdev (2011) S. Sachdev, Quantum Phase Transitions, Quantum Phase Transitions (Cambridge University Press, 2011).
- Zheludev et al. (2008) A. Zheludev, V. O. Garlea, L. P. Regnault, H. Manaka, A. Tsvelik, and J. H. Chung, Phys. Rev. Lett. 100 (2008).
- Kenzelmann et al. (2001) M. Kenzelmann, R. Cowley, W. Buyers, and D. McMorrow, Phys. Rev. B 63 (2001).
- Tennant et al. (2012) D. A. Tennant, B. Lake, A. J. A. James, F. H. L. Essler, S. Notbohm, H.-J. Mikeska, J. Fielden, P. Koegerler, P. C. Canfield, and M. T. F. Telling, Phys. Rev. B 85 (2012).
- Essler and Konik (2008) F. H. L. Essler and R. M. Konik, Phys. Rev. B 78, 100403 (2008).
- Essler and Konik (2009) F. H. L. Essler and R. M. Konik, J. Stat. Mech. - Theory Exp. 2009, P09018 (2009).
- James et al. (2008) A. J. A. James, F. H. L. Essler, and R. M. Konik, Phys. Rev. B 78 (2008).
- Goetze et al. (2010) W. D. Goetze, U. Karahasanovic, and F. H. L. Essler, Phys. Rev. B 82 (2010).
- Quintero-Castro et al. (2012) D. L. Quintero-Castro, B. Lake, A. T. M. N. Islam, E. M. Wheeler, C. Balz, M. Månsson, K. C. Rule, S. Gvasaliya, and A. Zheludev, Phys. Rev. Lett. 109, 127206 (2012).
- Habicht (2003) K. Habicht, Neutron Spin Echo Spectroscopy, edited by F. Mezei, T. Gutberlet, and C. Pappas, Lecture Notes in Physics (Springer-Verlag Berlin Heidelberg, 2003).
- Felber et al. (1998) J. Felber, R. Gähler, R. Golub, and K. Prechtel, Physica B 252, 34 (1998).
- Gähler et al. (1998) R. Gähler, J. Felber, F. Mezei, and R. Golub, Phys. Rev. A 58, 280 (1998).
- Keller et al. (2002) T. Keller, K. Habicht, H. Klann, M. Ohl, H. Schneider, and B. Keimer, Appl. Phys. A 74, S332 (2002).
- Habicht et al. (2004) K. Habicht, R. Golub, F. Mezei, B. Keimer, and T. Keller, Phys. Rev. B 69 (2004).
- Golub et al. (1994) R. Golub, R. Gähler, and T. Keller, American Journal of Physics 62, 779 (1994).
- Habicht et al. (2003) K. Habicht, T. Keller, and R. Golub, J. Appl. Crystallogr. 36, 1307 (2003).
- Mezei (1980) F. Mezei, Phys. Rev. Lett. 44, 1601 (1980).
- Pickup et al. (2009) R. M. Pickup, R. Cywinski, C. Pappas, B. Farago, and P. Fouquet, Phys. Rev. Lett. 102, 097202 (2009).
- Mezei et al. (1987a) F. Mezei, W. Knaak, and B. Farago, Phys. Rev. Lett. 58, 571 (1987a).
- Mezei et al. (1987b) F. Mezei, W. Knaak, and B. Farago, Physica Scripta 1987, 363 (1987b).
- Mezei (1986) F. Mezei, Physica B & C 136, 417 (1986).
- Mezei et al. (1989) F. Mezei, B. Farago, S. Hayden, and W. Stirling, Physica B 156, 226 (1989).
- Richter et al. (1990) D. Richter, B. Farago, L. J. Fetters, J. S. Huang, B. Ewen, and C. Lartigue, Phys. Rev. Lett. 64, 1389 (1990).
- Schleger et al. (1998) P. Schleger, B. Farago, C. Lartigue, A. Kollmar, and D. Richter, Phys. Rev. Lett. 81, 124 (1998).
- Kulda et al. (2004) J. Kulda, A. Debernardi, M. Cardona, F. de Geuser, and E. E. Haller, Phys. Rev. B 69, 045209 (2004).
- Náfrádi et al. (2011) B. Náfrádi, T. Keller, H. Manaka, A. Zheludev, and B. Keimer, Phys. Rev. Lett. 106, 177202 (2011).
- Bayrakci et al. (2013) S. P. Bayrakci, D. A. Tennant, P. Leininger, T. Keller, M. C. R. Gibson, S. D. Wilson, R. J. Birgeneau, and B. Keimer, Phys. Rev. Lett. 111, 017204 (2013).
- Garay (1968) J. Garay, Acta Chem. Scand. 22, 1710 (1968).
- Morosin (1970) B. Morosin, Acta Cryst. B B 26, 1203 (1970).
- Xu et al. (2000) G. Xu, C. Broholm, D. Reich, and M. Adams, Phys. Rev. Lett. 84, 4465 (2000).
- Tennant et al. (2003) D. Tennant, C. Broholm, D. Reich, S. Nagler, G. Granroth, T. Barnes, K. Damle, G. Xu, Y. Chen, and B. Sales, Phys. Rev. B 67 (2003), 10.1103/PhysRevB.67.054414.
- Barnes et al. (1999) T. Barnes, J. Riera, and D. Tennant, Phys. Rev. B 59, 11384 (1999).
- Gähler and Golub (1988) R. Gähler and R. Golub, Journal de Physique 49, 1195 (1988).
- Moon et al. (1969) R. M. Moon, T. Riste, and W. C. Koehler, Phys. Rev. 181, 920 (1969).
- (41) K. F. Tseng, T. Keller, A. Walters, S. P. Bayrakci, and B. Keimer, “Critical scattering in the antiferromagnets and studied by neutron spin-echo.” .
- Stancik and Brauns (2008) A. L. Stancik and E. B. Brauns, Vibrational Spectroscopy 47, 66 (2008).
- James (1994) F. James, MINUIT reference manual, Tech. Rep. D506 (CERN, 1994).
- Fåk et al. (2012) B. Fåk, T. Keller, M. E. Zhitomirsky, and A. L. Chernyshev, Phys. Rev. Lett. 109, 155305 (2012).