Probing the hard and intermediate states of X-ray binaries using short time-scale variability
Abstract
Below an accretion rate of approximately a few per cent of the Eddington accretion rate, X-ray binary systems are not usually found in the soft spectral state. However, at accretion rates a factor of a few lower still, in the hard state, there is another spectral transition which is well observed but not well understood. Below -1 per cent of the Eddington accretion rate (), the spectral index hardens with increasing accretion rate, but above , although still in the hard state, the spectral index softens with increasing accretion rate. Here we use a combination of X-ray spectral fitting and a study of short time-scale spectral variability to examine the behaviour of three well-known X-ray binaries: Cygnus X-1, GX 339-4 and XTE J1118+480.
In Cygnus X-1 we find separate hard and soft continuum components, and show using root-mean-square (rms) spectra that the soft component dominates the variability. The spectral transition at is clearly present in the hard-state hardness-intensity diagrams of Cygnus X-1. Above , GX 339-4 shows similar softer-when-brighter behaviour at both long and short time-scales. Similarly, XTE J1118+480, which remains well below , is harder-when-brighter behaviour on all time-scales.
We interpret these results in terms of two continuum components: a hard power-law which dominates the spectra when the accretion rate is low, probably arising from Comptonisation of cyclo-synchrotron photons from the corona, and a soft power-law which dominates at higher accretion rates, arising from Comptonisation of seed photons from the accretion disc.
keywords:
X-rays: binaries - accretion, accretion discs - X-rays: individual: Cygnus X-1 - X-rays: individual: GX 339-4 - X-rays: individual: XTE J1118+480.1 Introduction
Black hole X-ray binaries (XRBs) are usually observed in one of a number of characteristic states, each of which is associated with specific X-ray spectral and timing properties (e.g. Homan and Belloni, 2005; Remillard and McClintock, 2006; Belloni, 2010). The hard (or low) state is believed to be the result of thermal Comptonisation of lower energy seed photons in a cloud of hot electrons, and the X-ray spectra are usually consistent with a model comprising a power-law (which takes the form , where is the photon number density at energy and is the photon index), accompanied by a weak iron line at and a weak reflection component (e.g. Zdziarski et al., 1998; Ueda et al., 1994).
In the soft (or high) state the X-ray spectra become dominated below by the thermal emission from a geometrically thin, optically thick accretion disc (Shakura and Sunyaev, 1973), and the iron line and reflection components increase in strength. A power-law component, thought to be the result of Comptonisation of disc seed photons in a hybrid (thermal plus non-thermal) corona of high-energy electrons (Sunyaev and Titarchuk, 1980), forms a tail out to (Grove et al., 1998).
During the outburst cycle of a typical XRB the source moves from the hard state to the soft state and then back again, but in order to do so it must pass through the intermediate state. Although the intermediate state phase lasts for a relatively short period of time, the changes in the spectral and timing properties have led to this state being divided into the hard-intermediate state and the soft-intermediate state (e.g. Belloni, 2005; Belloni et al., 2006).
The photon index of the power-law spectral component is known to be correlated with the source accretion rate (), or, alternatively, the X-ray luminosity, which is often used as a proxy for . However, the nature of this correlation is fundamentally different depending upon whether is above or below a critical accretion rate (, typically 0.5-1 per cent of the Eddington limit). When then and are positively correlated (the source is softer when brighter), and when then the same two properties are anti-correlated (Sobolewska et al., 2011). The correlation has been established for XRBs on a variety of time-scales (Wu and Gu, 2008; Zdziarski et al., 2002; Wu et al., 2010), and also for active galactic nuclei (AGN) in large surveys (Constantin et al., 2009; Gu and Cao, 2009; Shemmer et al., 2006) and individual sources (Lamer et al., 2003; Sobolewska and Papadakis, 2009; Emmanoulopoulos et al., 2012).
The transition from the hard state to the soft state typically occurs at an accretion rate of a few per cent of the Eddington limit (Maccarone, 2003; Gierliński and Newton, 2006), and during this transition will increase significantly from 1.4-1.8 to and above. However, the switch from harder-when-brighter to softer-when-brighter behaviour at is not a state transition, and after increases beyond the boundary (which is typically a factor of a few lower in accretion rate than the hard-to-soft state transition) the source will initially remain in the hard state.
Physically, the harder-when-brighter behaviour at is usually attributed to the Comptonisation of cyclo-synchrotron seed photons in a geometrically thick, optically thin and radiatively inefficient accretion flow (RIAF; e.g. Narayan and Yi 1994; Abramowicz et al. 1995), which contrast with the mostly thermal disc seed photons that are thought to supply the Comptonised power-law in the soft state. The soft-state power-law is expected to be softer when brighter due to Compton cooling of the scattering corona (e.g. Guilbert et al., 1982), but to observe this effect in XRBs requires spectral fitting in order to separate the power-law component from the less variable (Churazov et al., 2001) thermal disc emission which typically dominates the spectrum below keV.
However, in the brightest limits of the hard state, in which , the clear softer-when-brighter behaviour suggests the presence of a cool accretion disc which contributes little to the energy spectra above 2 keV but is still able to provide sufficient thermal seed photons in order to cool the Comptonising corona. It has been suggested (e.g. Esin et al., 1997; Done and Zycki, 1999; Tomsick et al., 2009) that in this state the inner edge of the accretion disc is truncated at some distance from the black hole, so that the geometry in the bright hard state can be described as an outer truncated disc and an inner RIAF. As the accretion rate of the source increases there will be a corresponding decrease in the truncation radius, thereby shifting the balance of seed photon supply from the RIAF to the disc. Conversely, other studies (e.g. Miller et al., 2006; Liu et al., 2007; Reis et al., 2010) have suggested that, due to the detection of broad iron lines, as well as evidence from spectral fitting of the disc component, the cool accretion disc persists to the innermost stable circular orbit even in the hard state.
If the truncated disc model is correct, then it may be reasonable to expect the X-ray continuum to be composed of two separate power-law component: one produced in the inner RIAF that is harder-when-brighter and another produced in the outer corona that is softer-when-brighter. Yamada et al. (2013) showed that their hard-state Suzaku spectra of Cygnus X-1 can be described by such a two-component model. Numerous other studies have also found that the hard-state spectra of Cygnus X-1 are well described by a model comprised of two power-law components (e.g. Gierliński et al., 1999; Böck et al., 2011; Wilms et al., 2006; Grinberg et al., 2013), or alternatively that the spectra ’pivot’ around 10-20 keV (Cui et al., 2002; Malzac et al., 2006).
Luminosity and spectral changes can occur on time-scales much shorter than the integrated time of a typical 1 - 3 kilosecond (ks) observation by the Rossi X-ray Timing Explorer (RXTE), and we therefore combine spectral fitting of X-ray data from RXTE with an examination of short time-scale (100 milliseconds [ms] to a few kiloseconds) spectral variability to investigate whether or not the hypothesised hard and soft power-law components could be responsible for producing the change in spectral behaviour at . We also determine how these two components evolve as the source brightens from quiescence right through the hard and hard-intermediate states.
2 Observations and data reduction
2.1 The sample
In order to examine the behaviour of XRBs over a wide range of accretion rates, including both above and below the boundary, we select as our sample the high-mass XRB Cygnus X-1 and the low-mass transient XRBs GX 339-4 and XTE J1118+480. The basic properties of these three sources are summarised in Table 1.
Cygnus X-1 is amongst the best studied XRBs (e.g. Zdziarski et al., 2002; Wilms et al., 2006), and is both bright and persistent, with a luminosity that varies only by a factor or . Accretion rates are typically around a few per cent of the Eddington limit (Di Salvo et al., 2001), which places this source near to, or slightly above, .
Also included in our sample is the low-mass XRB GX 339-4, which is a transient source that, unlike Cygnus X-1, varies in accretion rate by several orders of magnitude (Zdziarski et al., 2004). Although its greater distance and lower black hole mass make GX 339-4 less suitable than Cygnus X-1 for short time-scale study with RXTE, it does however have clearer state transitions and a more definite outburst cycle.
XTE J1118+480 was included in the sample of Wu and Gu (2008), who monitored the changes in during its outburst in 2000 and showed that this source exhibits the typical harder-when-brighter behaviour expected of an XRB accreting at below . The X-ray spectrum of XTE J1118+480 is characterised by a power-law component with a weak iron line at 6.4 keV (Hynes et al., 2000; McClintock et al., 2001).
| Source | LMXB/HMXB | Distance | RA | Dec | |
|---|---|---|---|---|---|
| [kpc] | [] | ||||
| Cygnus X-1 | HMXB | 1.86 | 14.8 | 19h58m21.7s | +35d12m05.8s |
| GX 339-4 | LMXB | 5.8 | 17h02m49.4s | -48d47m22.8s | |
| XTE J1118+480 | LMXB | 1.81 | 6.9 - 8.2 | 11h18m10.8s | +48d02m12.6s |
Notes: a Low-mass XRB or high-mass XRB, b From SIMBAD Astronomical Database, c Reid et al. (2011), d Orosz et al. (2011), e Zdziarski et al. (2004), f Hynes et al. (2003), g Average of distances estimated by Wagner et al. 2001 (1.90.4 kpc), McClintock et al. 2001 (1.80.6 kpc) and Gelino et al. 2006 (1.720.1 kpc), h Khargharia et al. (2013)
2.2 Data selection
All observations used in this paper have been retrieved from the RXTE archive, and were identified based upon our requirements that the PCA configuration remains the same for all observations obtained for each source, the data demonstrate a long-term variability in either the count rate (CR) or hardness ratio (HR), and the observations are of hard or intermediate state and are evenly sampled in time over a reasonably large number of observations. For Cygnus X-1 we were restricted by the tendency for the high time-resolution coverage of the 3-20 keV energy range to be split between binned array mode for channels 0 to 35 (which roughly cover the 2-15 keV band) and event mode for channels 36 and above; all observations with PCA configurations split in this way were ignored.
We have therefore selected 52 observations of Cygnus X-1, all of which have proposal ID 30157 and date from between 1997 December 11 and 1998 December 3. The observations offer the binned array mode PCA configuration, and provide 42 channels to cover the whole 3-20 keV energy range. The exposure times are of between 1.5 ks and 4.4 ks, which, once good time intervals (GTIs) had been generated (see below), provided usable exposure times of between 0.9 ks and 3.4 ks. The lightcurve of count rate and HR produced from these observations is shown in Fig. 1 (top). Here, and throughout this paper, we choose to use the count rate in the 3-6.5 keV and 6.5-20 keV energy bands in order to calculate HR (defined as ); these bands have been selected for two reasons: firstly, they provide HRs which are consistently close to unity (and should therefore produce similar levels of statistical variation in each band) and, secondly, the iron line at 6.4 keV is roughly divided between the two bands, thereby reducing the effect this component may have upon the HRs.
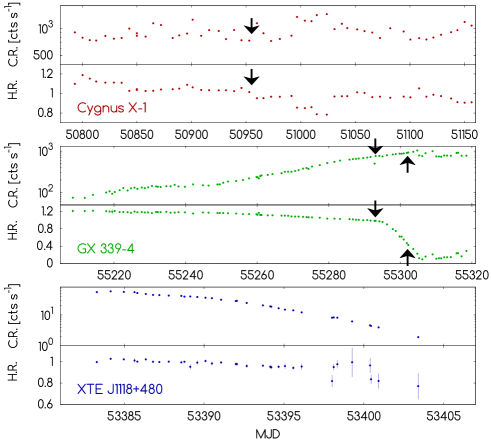
For GX 339-4 we have selected 91 observations from proposal 95409, dating from between 2010 January 12 and 2010 May 2. These observations all offer the event mode PCA configuration, and provide 25 channels to cover the 3-20 keV energy range. Once GTIs had been applied then the usable exposure times were between 750 s and 3.3 ks, with two additional observations offering longer exposures of 4.5 ks and 9.3 ks; 20 observations with good time intervals of less than 750 s were ignored, as were all soft-state observations which followed after 2010 May 2. The lightcurve of count rate and HR is shown in Fig. 1 (centre).
Finally, for XTE J1118+480 we selected 30 observations from proposals 90011 and 90111, dating from between 2005 January 14 and 2005 January 28. These observations offer the good xenon mode PCA configuration, and provide 42 channels to cover the 3-20 keV energy range. The GTIs have usable exposure times of up to 4.7 ks, although eight observations were found to be less than 750 s in length and were ignored. The lightcurve of count rate and HR is shown in Fig. 1 (bottom).
A summary of the observations used in this paper is provided in Table 2.
| Source | Obs. | RXTE Obs. ID | Date |
|---|---|---|---|
| Num. | |||
| Cygnus X-1 | 1 | 30157-01-01-00 | 1997 Dec. 11 |
| 52 | 30157-01-51-00 | 1998 Dec. 3 | |
| GX 339-4 | 1 | 95409-01-01-00 | 2010 Jan. 12 |
| 91 | 95409-01-17-02 | 2010 May 2 | |
| XTE J1118+480 | 1 | 90011-01-01-00 | 2005 Jan. 14 |
| 14 | 90011-01-01-13 | 2005 Jan. 20 | |
| 15 | 90111-01-01-00 | 2005 Jan. 13 | |
| 45 | 90111-01-07-00 | 2005 Feb. 26 |
2.3 Data reduction
In total, 173 observations were retrieved from the RXTE archive, and GTIs were generated based upon the spacecraft elevation angle being greater than , the pointing offset being less than and the time since the last south Atlantic anomaly (SAA) passage being at least 30 minutes. Next, synthetic background data based upon the bright PCA background models were generated using the script runpcabackest, and suitable response files created using the pcarsp tool.
For each observation, the data reduction was performed upon both the standard-2 datasets and the higher time resolution binned or event mode data. The standard-2 data offer excellent spectral resolution, but the time resolution of is insufficient for some of the later analysis in this paper. Spectra were extracted from both the standard-2 data and background data for all layers of PCU 2 using the saextrct tool, and these data were used to construct the source lightcurves shown in Fig. 1.
The method of reducing high time-resolution PCA data is dependent upon the mode in which the data are supplied, and it was therefore necessary to follow a slightly different process for each of our three sources. For XTE J1118+480 we first used the makese script to generate event mode data from the good xenon data, from which spectra could subsequently be extracted using the seextrct tool. The data from the GX 339-4 observations were already provided in event mode format, and could be extracted with seextrct immediately. For both XTE J1118+480 and GX 339-4 the spectra were extracted from all layers of PCU 2 only. For Cygnus X-1, spectra were extracted from the binned array mode data using the saextrct tool. However, for this source we were restricted by the less flexible format of the binned array mode (in which counts from all detectors are binned into a single column) to using all five PCUs. The response files for the event and array mode data were generated using the pcarsp tool, and background spectra created by rebinning the background files generated from the standard-2 data.
3 Spectral analysis of complete observations
3.1 Definitions of time-scales used in this paper
Before we look for spectral variations within individual observations we first analyse the standard-2 mode spectra that were extracted from each complete observation (typically 1 - 3 ks in length), which we shall hereafter refer to as the ’observation-averaged’ spectra. Similarly, we shall hereafter refer to any study of the source behaviour across many separate observations (for which we only use the standard-2 data) as being on long time-scales (days to weeks), and any study of the source behaviour within a single observation (for which we only use the higher time-resolution modes) as being on short time-scales (seconds to minutes). Furthermore, the term ’observation’ shall only be used in reference to the entire RXTE observation, and never to describe any short time-scale section of data.
3.2 Hardness-intensity diagrams
Fig. 2 shows the long time-scale hardness-intensity diagrams (HIDs) for the three sources, based upon the background subtracted count rates of the standard-2 data. Each data point represents one complete observation (which are typically a few kiloseconds in length), and observations are separated in time by intervals of between a few hours and several days. The data from the observations selected for analysis in this paper (denoted with coloured crosses) are shown alongside other observations from around the same time in order to provide a more complete picture of the evolution of each source on these plots.
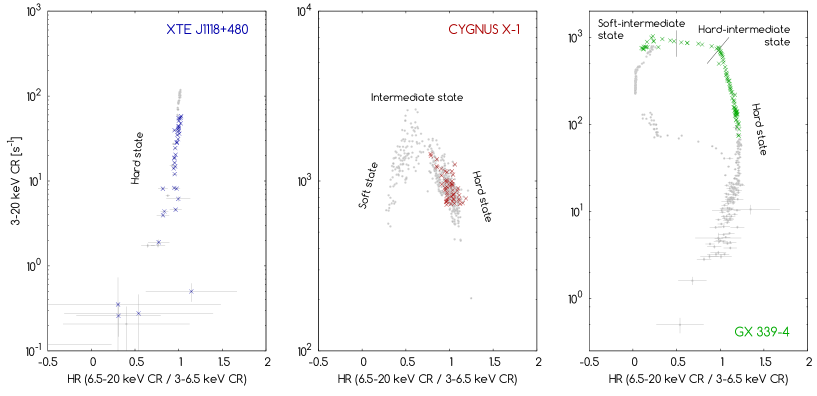
The HID of GX 339-4 takes the form of the familiar q-shaped hysteresis curve (sometimes called the turtle-head diagram), the head of which is always traversed in an anti-clockwise direction (Fender et al., 2004; Belloni et al., 2005). The observations selected for analysis in this paper begin in the hard state at the point at which the source switches from harder-when-brighter to softer-when-brighter behaviour, and continue through the intermediate state (the top horizontal branch of the distribution). The fainter hard-state observations, in which the source is harder when brighter, were found to be too faint to examine on 100 ms time-scales. In contrast, Cygnus X-1 does not exhibit clear state transitions between the hard and intermediate states in its HID (although the soft state can be seen towards the left-hand side of the plot), so we do not yet attempt to distinguish between the two; it is clear, however, that none of these data is expected to be of the soft state. Finally, XTE J1118+480 is at a low accretion rate and is always found in the hard state. The HID of this source shows only harder-when-brighter behaviour, and is therefore comparable to the tail of the "q" in the HID of GX 339-4.
The absence of hysteresis in the HID of Cygnus X-1 has been attributed (e.g. Smith et al., 2002; Maccarone and Coppi, 2003) to the high-mass nature of the donor and the wind-fed accretion mechanism, which are expected to form smaller accretion discs than those found in low-mass transient systems. Belloni (2010) further adds that the weaker the outburst, the smaller the difference in flux between the hard-to-soft and the soft-to-hard state transitions, and that state transitions in Cygnus X-1 represent hysteresis that is too small to observe.
3.3 Single power-law fits
The spectra extracted from the standard-2 mode data are initially fitted in xspec version 12.8 using just a single power-law model (which, at this stage, does not include absorption). Whereas a model of such simplicity cannot adequately subsume other known features such as the iron line or accretion disc, the residuals to the fit do however provide a useful first look at the spectral components that are present, and the model therefore provides a suitable basis upon which further complexity can be added if required.
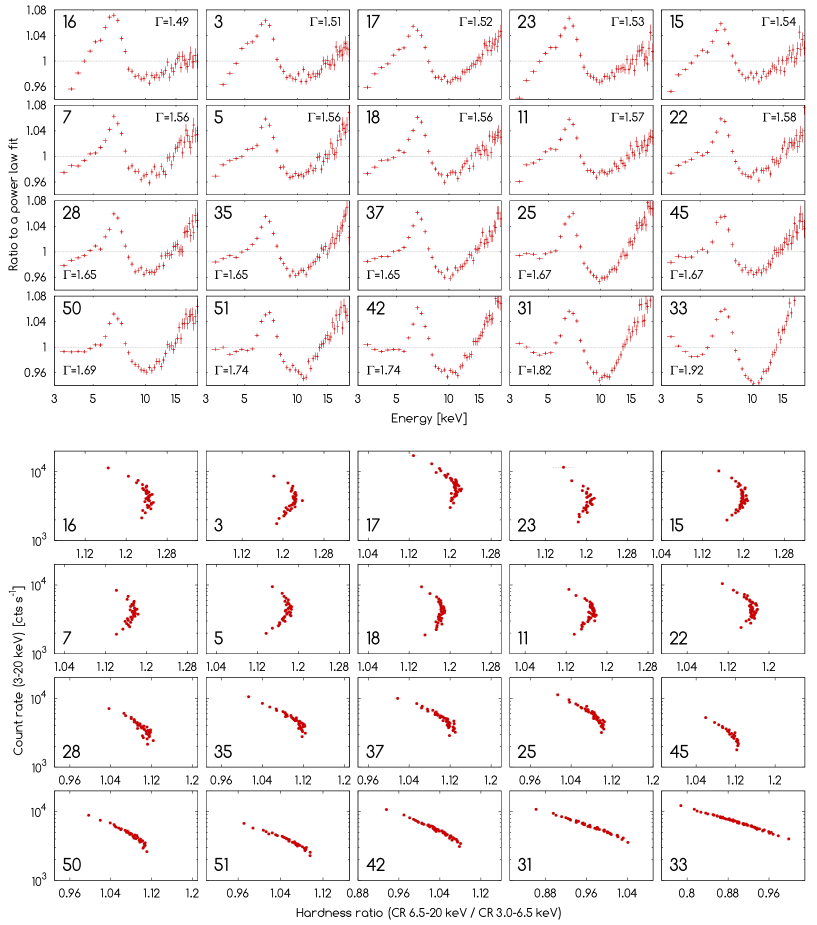
Fig. 3 (top) shows the standard-2 mode spectra from 20 observations of Cygnus X-1, which have been sorted by decreasing HR and are presented in the form of ratios to the power-law fits. Each of these spectra show a clear excess at around 6 or , consistent with a broad iron line. In addition to the iron line, the spectra also reveal the presence of at least one further component which is responsible for causing a change in spectral slope at approximately 10 keV in some of the brighter, softer observations (see, for example, obs. 31 and 33). This additional component could either be attributed to a combination of thermal disc emission and/or reflection, both of which one would expect to increase in strength in the softer, brighter observations due to the inward motion of the disc, or otherwise to an additional Comptonised power-law component.
3.4 Adding an additional continuum component: disc or power-law?
The process of decomposing these spectra into their separate components is made more complicated by absorption from a large () column density. Furthermore, if two separate power-laws are present then it is not possible to disentangle them from their associated reflection components due to the high level of degeneracy in the fit. Therefore, the Cygnus X-1 spectra were fitted with two different models: the first (hereafter referred to as the PL+PL model) consisted of two power-laws (powerlaw), a Gaussian representing the iron line (gaussian) and photoelectric absorption (phabs, with approximately in most of the observations and around 2-4 times higher in the remaining few; the absorption was applied to both power-laws), and the second (hereafter referred to as the PL+R model) consisted of a single power-law plus reflection (pexrav, see Magdziarz and Zdziarski 1995), an iron line and photoelectric absorption. Whilst fitting the reflection component, the inclination angle of the disc was fixed to (Orosz et al., 2011).
Physically, we interpret the PL+R model as representing a corona and reflection from an accretion disc, and the PL+PL model as representing the two-component Comptonised emission arising from the inner and outer accretion flows. We do not initially include a reflection component in our PL+PL model due to concerns over degeneracy in our fits, although we do expect there to be some reflection from the truncated accretion disc.
When the data were fitted with the PL+R model we found a steep soft excess below -5 keV in approximately one half of the observations (see Fig. 4). When this excess was fitted with an accretion disc (diskbb) the disc normalisation () failed to converge to a value consistent with a truncation radius greater than one gravitational radius () in any of the fits, and was therefore fixed to (a truncation radius of , or ). It was found that varying between and (a truncation radius of , or ) made little difference to the quality of the fits (although tended to increase as increased), or to the parameters of the power-law, and affected only the inner disc temperature. Increasing above this range produced a noticeably poorer fit, which is not consistent with the expected large truncation radius of the disc in the hard or hard-intermediate state.
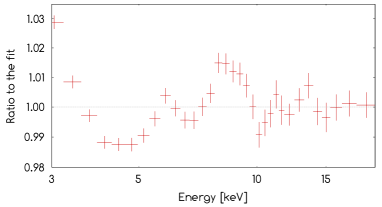
Fig. 5 shows two observations of Cygnus X-1 (17 and 33), which were selected because they have similar count rates but very different HRs; in addition, obs. 33 shows a clear change in spectral slope at 10 keV, whereas obs. 17 does not. The parameters derived from the PL+R model are not unreasonable, with reflected fractions of 11.0 per cent and 20.7 per cent in obs. 17 and 33 respectively. In addition, the soft excess in obs. 33 was fitted with an accretion disc with a temperature at the inner disc radius of 0.358 keV. A summary of the fit parameters for obs. 17 and 33 is provided in Table 3.
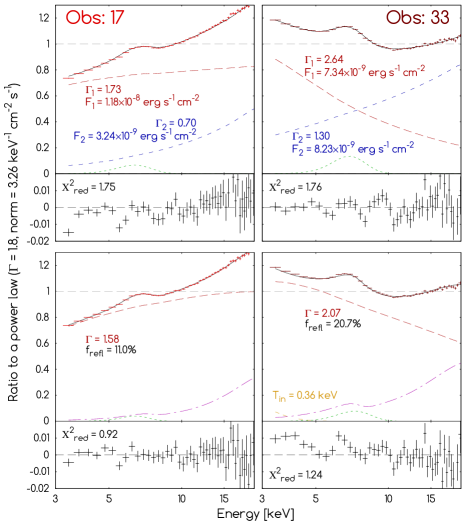
After fitting all 52 Cygnus X-1 observations with the same two models, it was found that, in general, the PL+R model offered a slightly better fit than the PL+PL model, but both models consistently delivered a reduced () of between 0.8 and 2, and it is not possible with these data to determine which model is the most appropriate. Whilst fitting obs. 33 we found that the fit from the PL+PL model could be improved considerably () by including a component to model the reflection from the soft power-law, but any attempt to expand the model to include reflection from the hard power-law resulted in degeneracy between the hard power-law photon index () and the reflection scaling factor, and the did not improve.
| Model/ | Obs 17 | Obs 33 |
|---|---|---|
| Parameter | ||
| powerlaw + powerlaw (PL+PL model) | ||
| (40 d.o.f.) | 1.75 | 1.76 |
| 1.73 | 2.64 | |
| 0.70 | 1.30 | |
| pexrav + diskbb (PL+R model) | ||
| (41 and 44 d.o.f. respectively) | 0.92 | 1.24 |
| 1.58 | 2.07 | |
| [keV] | / | 0.358 |
| 0.46 | 1.13 | |
| [] | 11.0 | 20.7 |
Notes: a Disc temperature at inner radius. The normalisation was fixed to , which is equivalent to an inner radius of , b pexrav reflection scaling factor, c reflection flux divided by power-law flux
4 Short time-scale spectral variability
4.1 Overview
In order to examine spectral variability on short time-scales the high time-resolution data were split into 100 ms segments, and spectra were extracted from each segment using either saextrct or seextrct, as appropriate. On such short time-scales spectra may be severely affected by Poisson noise due to the low count statistics (Wu et al., 2010), so the individual spectra were sorted by count rate and then added together using the addspec tool such that each summed spectrum contains a similar number of background subtracted counts; for Cygnus X-1 this total was chosen to be counts, for GX 339-4 it was counts and for XTE J1118+480 it was counts. The total number of summed spectra for each observation therefore depends upon both the brightness and length of the observation, and we find that we have between 12 and 61 spectra for each Cygnus X-1 observation, between 5 and 35 spectra for each GX 339-4 observation and between 5 and 9 spectra for each observation of the much fainter XTE J1118+480.
4.2 Short time-scale HIDs
The short time-scale spectral variability is examined by constructing HIDs from the summed 100 ms spectra, where each data point represents a measurement of count rate and HR from a single summed spectrum, and a separate HID is constructed for each observation.
Fig. 3 (bottom) shows the HIDs from 20 observations of Cygnus X-1, which are sorted by decreasing HR. Many of the panels show a weak softer-when-brighter behaviour, which becomes much stronger in the observations with the softest spectra (e.g. obs. 31 and 33). Conversely, some observations (e.g. obs 7, 11, 15, etc) have slightly crescent-shaped distributions and show signs of harder-when-brighter behaviour at low count rates. In general, crescent-shaped HIDs are found only when (roughly equivalent to ). Although the shape of the short time-scale HIDs is mostly dependent upon HR, the weak correlation between count rate and HR means that many of the strong softer-when-brighter HIDs are found in the brightest observations.
The data also suggest that the shape of the HID evolves fairly slowly in time, and observations only a few weeks apart tend to have similar HIDs even when the count rate has changed noticeably (for example, see obs. 25 and 28, and obs. 16 and 17). The long time-scale evolution in HR and shape of the HID (for instance, the disappearance of the crescent-shaped HIDs and a decrease in HR to a value less than 1.12) coincide with the appearance in the energy spectra of the additional soft component below 10 keV, the origin of which will be further examined in the next section.
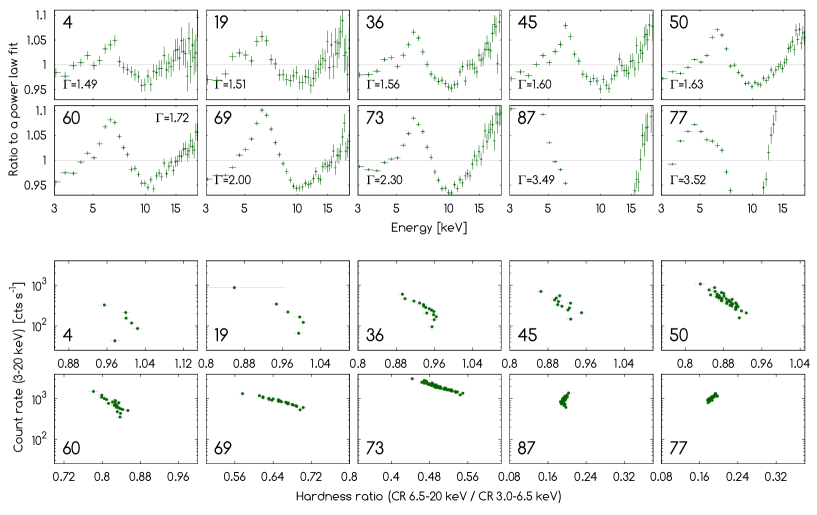
In general, the short time-scale HIDs of GX 339-4 (Fig. 6, bottom) show a softer-when-brighter behaviour in the hard state, which is consistent with the behaviour found in the same observations on time-scales of weeks (Fig. 2, right). Once the source enters the hard-intermediate state (obs. 64+) then the spectra become softer, and the softer-when-brighter behaviour appears stronger. At a later time still (roughly obs. 75+) there is a transition from a hard-intermediate to a soft-intermediate state, with a reduction in the spectral variability of the source.
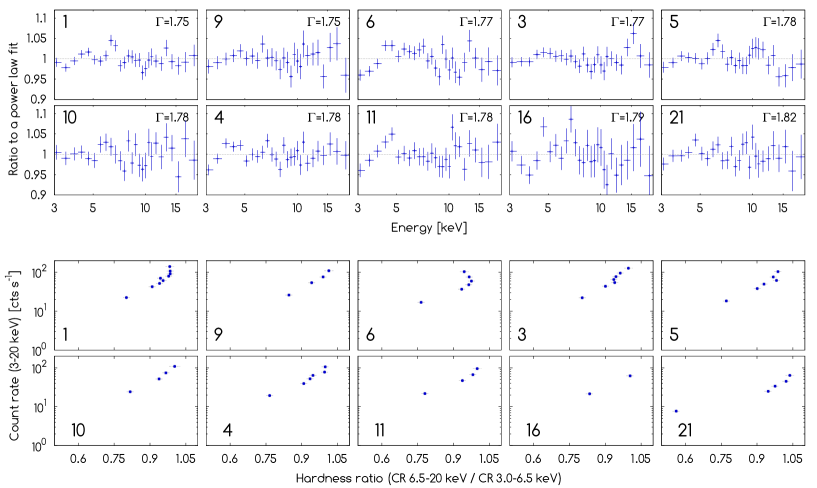
For XTE J1118+480 the short time-scale HIDs (Fig. 7, bottom) show only the typical harder-when-brighter behaviour expected from a low accretion rate source, and are therefore similar to the HID produced on time-scales of days (Fig. 2, left). Since this source does not undergo any state transitions, and its accretion rate does not increase above , then the short time-scale HIDs show few changes between observations.
4.3 Spectral fitting of short time-scale data
In Section 3 we found that the Cygnus X-1 observation-averaged spectra could be fitted equally well with a dual power-law model (PL+PL) or with a single power-law plus reflection model (PL+R, including an accretion disc if required). Here, we fit the short time-scale, flux-binned spectra with the same two models in order to compare the quality of fit, and also determine how the spectral index varies as a function of the Eddington ratio (, hereafter denoted ) on short time-scales.
Whilst fitting the short time-scale data we choose to keep some of the parameters, such as the disc temperature and iron line equivalent width (EW), fixed to the values that were fitted to the observation-averaged spectra (see Skipper et al. 2013 for a discussion of the validity of fixing these parameters). In order to fix the iron line EW, a gabs component with a negative line depth was used in place of the Gaussian emission component.
We find that both the PL+PL and PL+R models are successfully able to fit the short time-scale spectra of Cygnus X-1, with an average of between 1 and 1.2 for the 133 flux-binned spectra extracted from obs. 5, 33 and 37 (where over all 133 spectral fits, with 40 degrees of freedom for both models). For the PL+PL model it is necessary to keep the parameters of the soft power-law component, along with the normalisation of the hard power-law, as free parameters, but the photon index of the hard power-law component can be fixed without any increase in . For the PL+R model, the photon index, normalisation and reflection scaling factor () were initially allowed to vary, and it was found that tends to increase as the flux increases (from 1.02 to 1.32 in obs. 33, equivalent to an increase in reflected fraction from per cent to per cent). However, fixing made little difference to the average (which increased from 1.17 to 1.19 in obs. 33, and from 1.16 to 1.17 in obs. 37).
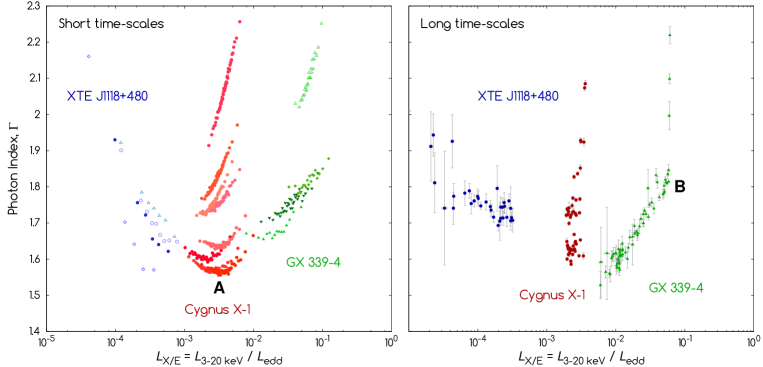
Fig. 8 (left) shows the short time-scale distribution of with for a selection of observations (each of which is plotted with a different symbol and colour), and is contrasted (Fig. 8, right) with the long time-scale distribution obtained from fits to the standard-2 data from each full observation. All spectra were fitted with the PL+R model (including an accretion disc, if required), with the reflected fraction, iron line EW and disc temperature and normalisation fixed whilst fitting the short time-scale data. The disc inclination angle was fixed to for Cygnus X-1 (Orosz et al., 2011), for GX 339-4 (the inclination angle is not well constrained, but we use the value suggested by Shidatsu et al. 2011) and for XTE J1118+480 (the mid-point of the estimate of Khargharia et al. (2013); although this measurement relates to the binary inclination rather than the disc inclination we have assumed that the disc will roughly follow the binary plane). The X-ray luminosity to Eddington luminosity ratios were estimated from the fluxes by using the masses and distances listed in Table 1. For XTE J1118+480 the absorption column density was fixed to .
For GX 339-4 and XTE J1118+480 we find little difference in the distribution of on long and short time-scales, but for Cygnus X-1 the short time-scale data show a marked deviation from the steep positive correlation found in the long time-scale data. When is low, the Cygnus X-1 data show the same crescent-shaped form that was evident in the HIDs, but as increases then the slope of the correlation gradually approaches that found on longer time-scales. The transition from the hard to the hard-intermediate state in GX 339-4 causes the rapid rise in at point ’B’ in Fig. 8 (right).
5 RMS variability
5.1 Count rate versus total rms
The linear relationship between the flux (in counts per second) and root mean squared (rms) variability in the hard state of Cygnus X-1 was first revealed by Uttley and McHardy (2001), who also suggested that the non-zero intercept of this relation with the flux axis implied the presence of a second, non-varying component to the light curve. The rms-flux relation has since been found in a wide variety of sources, including XRBs, AGN, a white dwarf and an ultraluminous X-ray source (see Heil et al., 2012, and references therein).
Here we choose to use the method described by Arévalo et al. (2008) (and references therein), in which the variance is derived from summing the discrete power density spectrum (PDS) over the required frequency interval , and then subtracting the contribution from Poisson noise to obtain the normalised excess variance . Poisson noise is expected to contribute to the normalised variance by adding a component that is almost constant at all frequencies (see also Vaughan et al., 2003), and here we subtract (where and are the total count rate and background subtracted count rate respectively) from each frequency bin of the PDS. The rms variability is given by the square root of , which is multiplied by the mean count rate to give the total (not normalised) rms, .
We have calculated the rms (in the 5 mHz to 5 Hz frequency range) separately for the hard band (6.5-20 keV), soft band (3-6.5 keV), and for the whole 3-20 keV energy range. The frequency range was constrained at the lower end by our minimum observation length of 750 s, and at the upper end by the shortest time-scale on which we choose to measure (100 ms).
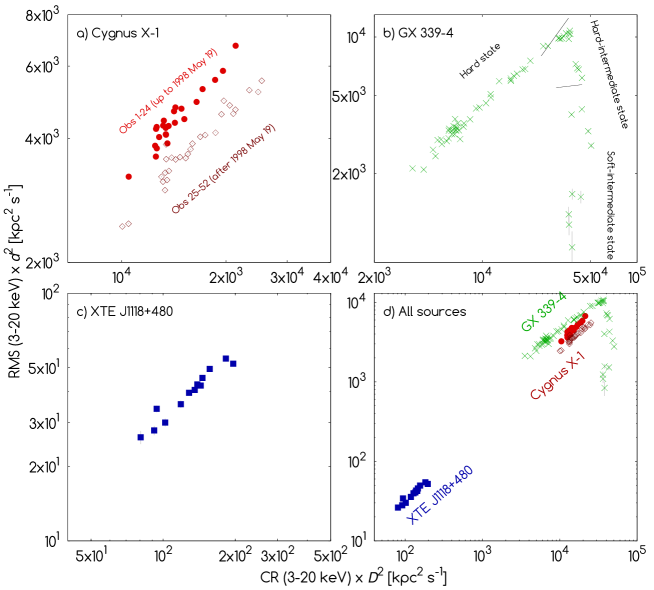
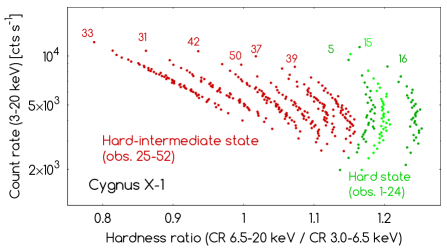
Fig. 9 shows the 3-20 keV count rate plotted against the total rms (5 mHz to 5 Hz) for all of our observations. The Cygnus X-1 data consist of one observation every seven days between 1997 December 11 and 1998 December 3, and reveal that the observations from after 1998 May 19 (obs. 25-52) have a lower fractional rms than those from before (obs. 1-24). This reduction in rms has previously been noted by Pottschmidt et al. (2003), who also found that the power spectra of these data could be well-fitted with four Lorentzians, the peak frequencies of which increased following the reduction in rms; the authors associate some or all of the Lorentzian components with the accretion disc corona. We also note from the observation-averaged energy spectra of Fig. 3 that obs. 25-52 generally have softer spectra, higher count rates, and a more pronounced change in spectral slope at keV than obs. 1-24.
Changes in the intercept and/or slope of the rms-flux relation in Cygnus X-1 are often indicative of state transitions or failed state transitions (Gleissner et al., 2004), and we shall hereafter refer to the observations from up to and including 1998 May 19 (obs. 24) as being in the hard state, and those from after this date as being in the hard-intermediate state; similar transitions between these two states have also been observed at other times (e.g. Belloni et al., 1999). For a detailed analysis of state transitions in Cygnus X-1 see Grinberg et al. (2013).
The GX 339-4 data reveal a marked change in the rms-flux relation during the hard to hard-intermediate state transition that occurred around April 2010 (obs. 63 to 64). The large reduction in fractional rms that follows during the intermediate-state phase is consistent with the results of Muñoz-Darias et al. (2011), who found that the rms-flux relation of GX 339-4 follows a complete hysteresis curve as the source moves through all the states of a typical outburst. Since we only investigate this source up until the time it makes the transition from the intermediate state to the soft state, our data only show one half of this cycle.
5.2 RMS spectra
5.2.1 Overview
RMS, or Fourier-resolved, spectra allow us to distinguish varying components of a spectrum (within the frequency range being investigated) from constant components, or those varying at a different frequency. Here we derive rms spectra to attempt to determine the relevance of reflection components within our spectra. As in the previous section, the present data are of sufficient quality to allow us to investigate two frequency ranges, 5-500 mHz (low) and 500 mHz - 5 Hz (high).
5.2.2 The soft rms spectra of Cygnus X-1
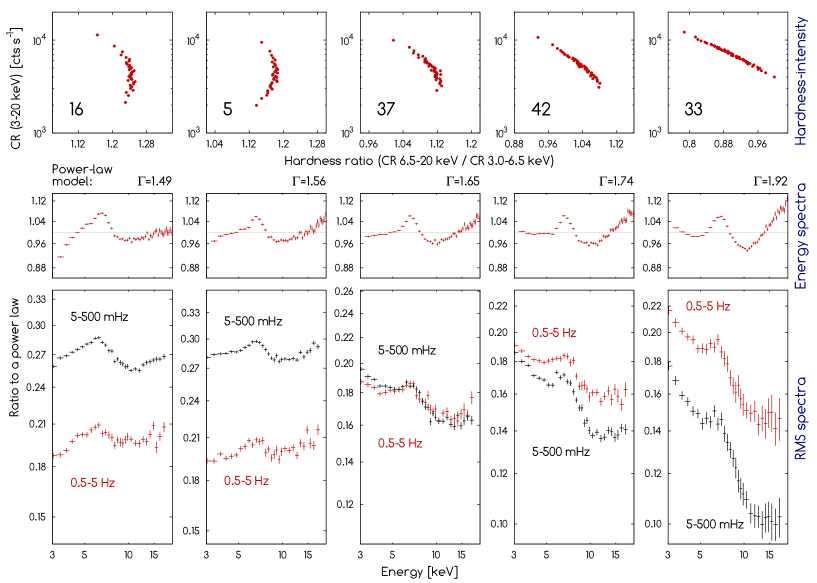
Fig. 10 shows the HIDs, the observation-averaged energy spectra and the rms spectra of five observations of Cygnus X-1, which are sorted by decreasing HR. For each observation the energy spectrum was fitted with a single power-law, and the energy and rms spectra are shown as ratios to the same power-law model.
In the observations with the hardest overall energy spectra, the variability in the low frequency band is greater than in the high frequency band, and both bands are dominated by a relatively hard power-law. However, in the observations with the softer energy spectra high frequency variations dominate, and both frequency bands exhibit a steep power-law spectrum.
5.2.3 The hard component of Cygnus X-1: a result of reflection?
The rms of any reflected component is expected to be suppressed in comparison to the underlying power-law due to smearing from the light-crossing time of the reflector (Gilfanov et al., 2000), and the hard spectral component could therefore be the result of strong reflected emission. The effect of smearing should be stronger on short time-scales than long time-scales, and we would therefore expect to see greater suppression of the reflected power-law component in the high-frequency rms spectra than in the low-frequency rms spectra.
We have tested our rms spectra for reflection by fitting the PL+R and PL+PL models to the high- and low-frequency rms spectra of obs. 33, which is both the softest and brightest amongst our observations of Cygnus X-1, and its energy spectra show the clearest indication of a change in spectral slope at 10 keV. A summary of the fit parameters, and flux contributions from each component, is provided in Table 4.
Whilst fitting the rms spectra with the PL+R model we chose to fix the power-law photon index (), the disc normalisation (), the temperature at the inner disc radius () and the iron line width () and centroid energy to the values obtained from fitting the observation-averaged energy spectra, but allowed the pexrav reflection scaling factor to vary. The disc component was convolved with cflux in order that the flux could vary whilst the temperature and inner radius remained fixed. For the PL+PL model we similarly fixed the photon indices of the two power-laws ( and respectively) and the iron line width and centroid energy.
| Energy | 5-500 mHz rms | 0.5-5 Hz rms | ||||
| spectra | spectra | spectra | ||||
| PL+PL model | ||||||
| Fit parameters: | ||||||
| 1.76 (40 d.o.f.) | 0.58 (27 d.o.f.) | 0.33 (27 d.o.f.) | ||||
| 2.64 | 2.64 f | 2.64 f | ||||
| 1.30 | 1.30 f | 1.30 f | ||||
| Flux contribution [ erg cm-2 s-1]: | ||||||
| P-L 1 b | 849.11 | (53.0%) | 149.19 | (74.1%) | 176.14 | (65.1%) |
| P-L 2 b | 707.07 | (44.1%) | 44.90 | (22.3%) | 85.90 | (31.7%) |
| Iron line | 46.12 | (2.9%) | 7.14 | (3.6%) | 8.71 | (3.2%) |
| PL+R model | ||||||
| Fit parameters: | ||||||
| 1.24 (44 d.o.f.) | 12.51 (26 d.o.f.) | 2.72 (26 d.o.f.) | ||||
| 2.07 | 2.07 f | 2.07 f | ||||
| [keV] | 0.358 | 0.358 f | 0.358 f | |||
| 1.13 | 0.00 | 0.00 | ||||
| Flux contribution [ erg cm-2 s-1]: | ||||||
| P-L b | ||||||
| Reflection | ||||||
| Disc | ||||||
| Iron line | ||||||
Notes: a pexrav reflection scaling factor, b Power-law component, f fixed parameter
Whereas the PL+R model provided a good fit to the energy spectrum ( = 1.24), the quality of the fit to the high-frequency rms spectrum was poor ( = 2.72), and the model failed to provide a satisfactory fit to the low-frequency rms spectrum ( = 12.51). The fits to the low- and high-frequency rms spectra could be improved dramatically if were allowed to vary ( = 0.28 and 0.30 respectively), but the corresponding increase in (from 2.07 to 2.43 and 2.32 respectively) is contrary to our expectation that should be equal in the energy and rms spectra. When, conversely, we attempted to fit the observation-averaged energy spectra of obs. 33 with a steeper power-law () we found that the PL+R model was unable to successfully fit the hard spectral component that dominates above . Although we note from our spectral fits of Figs. 4 and 5 that there are some residuals present in the vicinity of the iron line, and these residuals could potentially affect our fits to the energy spectra, we do not believe that they are sufficient to explain our inability to fit the PL+R model to the rms spectra.
Furthermore, attributing the absence of the hard component from the low-frequency (5-500 mHz) rms spectrum to suppression of variability in the reflected emission would require a reflector of at least two light-seconds in diameter (roughly ), which is much larger than the expected value of (Revnivtsev et al., 1999) for Cygnus X-1 in the hard state.
The results from fitting the rms spectra with the PL+PL model were more encouraging, with less than 1 for both the low- and high-frequency spectra. The strength of the hard power-law relative to the soft power-law is weakened in comparison to the energy spectrum fit, implying that the hard power-law is less variable than the soft power-law, with the suppression stronger at low frequencies than at high frequencies. Although the fits to the energy spectra were slightly poorer than those using the PL+R model ( and 1.24 respectively) there is some indication (from fitting obs. 33; see Section 3.4) that the inclusion of a reflection component (or components) could considerably improve the fit.
5.2.4 Fractional rms in the high- and low-frequency bands
We note that in the hard-state observations of Cygnus X-1 (Fig. 10, obs. 5 and 16) the fractional rms in the low-frequency band ( 25-29 per cent) is greater than that of the higher frequency band ( 18-21 per cent). However, in the hard-intermediate-state observations (37, 42 and 33) this situation becomes reversed, and the fractional rms of the high-frequency band is now greater than or equal to that of the low frequency band. This tendency for the high-frequency variability to dominate the rms spectra of the softest observations is consistent with the findings of Grinberg et al. (2014), who showed that higher frequencies tend to dominate the power spectra as the photon index of the soft power-law increases.
5.2.5 GX 339-4
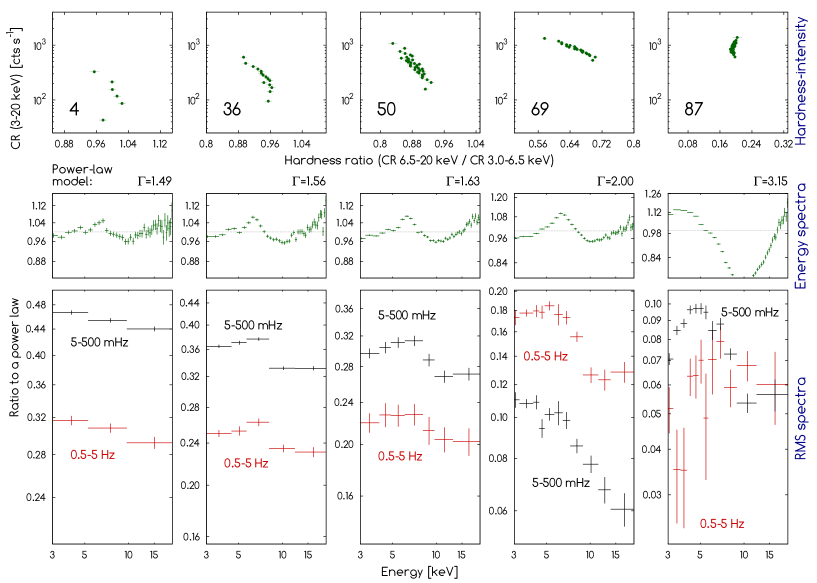
The evolution of the rms spectra of GX 339-4 (Fig. 11) through the hard and hard-intermediate states (obs. 4 through 69) is very similar to that of Cygnus X-1 (Fig. 10), although a possible increase in EW of the iron line with increasing count rate is more pronounced in this source.
However, in obs. 87 we find that GX 339-4 has entered the soft-intermediate state, which we do not see in our Cygnus X-1 data, and in this state a strong thermal disc component is present. In this observation the rms spectrum in the high-frequency band is harder than the energy spectrum due to the suppression of the disc component in the former. The lack of variability in the HID demonstrates the behaviour we would expect to see when an accretion disc dominates the spectrum below , and is in clear contrast to the large variability in hardness ratio found in the hard-intermediate state observations of Cygnus X-1 (Figs. 3 and 10).
5.2.6 The soft rms spectra of the hard-intermediate state
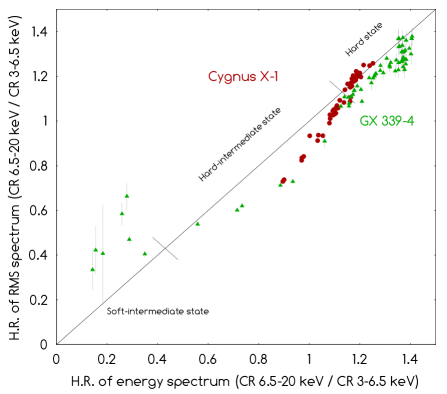
One common feature of the Cygnus X-1 and GX 339-4 spectra shown in Figs. 10 and 11 is the tendency for the rms spectra to become softer than the energy spectra as the count rate increases and the source moves into the hard-intermediate state. This trend only reverses in GX 339-4 once the source moves towards the soft state and a strong thermal disc component enters the spectrum. Fig. 12 illustrates this point by plotting the HR of the energy spectra () against the HR of the rms spectra (). In the hard state we find that , but as the spectra soften and enter the hard-intermediate state we find that ; this difference is greatest when , at which point .
5.2.7 The hard rms spectra of the soft-intermediate state
In contrast, the soft-intermediate-state observations of GX 339-4 (Fig. 11, obs. 87) reveal the growing influence of the accretion disc on the energy spectra, which are characterised by thermal disc emission in the soft band and a power-law in the hard band. The short-time-scale HIDs show little variability in either HR or CR, and the fractional rms of these data is now much lower than that found in the hard-intermediate state ( per cent, with the reduction strongest in the high frequency band). As the disc is more stable than the power-law in the soft state (Churazov et al., 2001), the power-law is relatively stronger (compared to the disc) in the rms spectra than the energy spectra, and we find that .
6 Discussion
6.1 Summary of results
In order to understand the reason for the hard-state spectral transition at we choose to focus our analysis and discussion mainly upon Cygnus X-1, which has an accretion rate which is usually very close to this critical accretion rate. The most relevant results can be summarised as follows:
-
•
In the hard state of Cygnus X-1 (obs. 1-24) both the observation-averaged energy spectra (Fig. 3, top) and rms spectra (Fig. 10) consist of a single power-law and iron line, and the short time-scale HIDs (Fig. 3, bottom) show a clear transition from harder-when-brighter to softer-when-brighter as increases above .
-
•
In the hard-intermediate state of Cygnus X-1 (obs. 25-52) many of the observation-averaged energy spectra (Fig. 3, top) exhibit a different spectral slope below the iron line () to that found above the iron line (), and require an additional harder model component such as an additional power-law (the PL+PL model) or a reflection component (the PL+R model). However, the rms spectra (Fig. 10) show little or no evidence of this additional component, and appear to be single power-law distributions. The rms spectra are softer than the energy spectra, with photon indices that appear closer to those of the soft component of the energy spectra than to those of the hard component. The short time-scale HIDs (Fig. 3, bottom) are strongly softer-when-brighter, and no spectral transition is observed when the count rate goes below the level at which this transition occurs in the hard state.
-
•
Although spectral fitting of the energy spectra of Cygnus X-1 failed to determine which of our two models (PL+PL and PL+R) is the most appropriate choice for these data (see Section 3), our inability to fit the PL+R model to the low-frequency rms spectrum of obs. 33 without a large increase in favours the PL+PL model.
-
•
The rms spectra of Cygnus X-1 (Fig. 10) are dominated by low-frequency (500 mHz to 0.5 Hz) variability in the hard state, but the fractional rms in the low-frequency band weakens as the source softens, until eventually the high-frequency (0.5 to 5 Hz) variability dominates in the hard-intermediate state.
-
•
GX 339-4, for which the accretion rate is greater in all of our observations than that at which the transition is observed in Cygnus X-1, shows only softer-when-brighter behaviour (Fig. 6). Similarly, XTE J1118+480 (for which the accretion rate is less than that of the Cygnus X-1 transition) shows only harder-when-brighter behaviour (Fig. 6). For these sources there appears very little difference in the way that HR (or ) responds to changes in count rate on long and short time-scales (Fig. 8), which is contrary to what we observed in Cygnus X-1.
6.2 Cygnus X-1 across the boundary
The hard-state spectral transition from harder-when-brighter to softer-when-brighter behaviour at is observed in Cygnus X-1 (Figs. 3 and 8) on time-scales that are up to the typical observation length of 1-2 ks; this transition is typically observed at count rates of around . In the hard state the rms spectra (Fig. 10) show no evidence of greater variability in either the soft or hard bands, which is contrary to what we might expect if a fixed soft component, such as a cool disc or thermal emission, were responsible for causing the harder-when-brighter behaviour at low count rates.
In the hard-intermediate state we do not observe any clear transition to harder-when-brighter behaviour, even though the range of count rates found in some of these observations (i.e. obs. 28 and 51) extend below the point at which a transition to harder-when-brighter behaviour was observed in the hard state. Some hard-intermediate state observations (i.e. obs 37, 39 and 50) do show a slight indication of hardening at lower count rates (below about ), and if the emission process were less efficient in the hard-intermediate state we might argue that these lower count rates implied a higher absolute accretion rate than for the same count rates in the hard state. However, since we expect the hard-intermediate state to have softer spectra and a greater radiative efficiency than the hard state then the potentially lower count rates at which the transition is observed in the former cannot possibly correspond to the same absolute accretion rate in the latter. The rms spectra (Fig. 10) show that in the hard-intermediate state the variability of the source is dominated by the soft spectral component, and the hard component changes comparatively little on either long or short time-scales.
We note from Figs. 3 and 8 that at low count rates all of the HIDs (in both the hard and hard-intermediate states) appear to approach a single point, which is located at approximately (where the luminosity was measured in the 3-20 keV range). This intersection of the HIDs occurs at a luminosity at which the soft spectral component is weak or absent, and only the hard component remains.
We also note from Fig. 8 (left) that it may be possible to describe the harder-when-brighter behaviour of both Cygnus X-1 and XTE J1118+480 with the same linear fit, implying a similarly simple, single power-law origin for the harder-when-brighter behaviour of both sources. However, the dynamic range of the Cygnus X-1 data below is too low for such a claim to be firmly established.
6.3 Unifying the hard and hard-intermediate states of Cygnus X-1
In this paper we have examined the spectra of the hard-intermediate-state Cygnus X-1 observations, and found that a two-power-law interpretation (the PL+PL model) fits the data better. This interpretation agrees with that of Makishima et al. (2008) and Yamada et al. (2013). A similar model, consisting of a weakly absorbed and highly variable soft component, and a more highly absorbed, slowly varying hard component, was successfully applied by Noda et al. (2014) to describe their Suzaku observations of the Seyfert galaxy NGC 3227, and we note the similarity between the variability properties of these components and those described in this paper.
In the hard state, the short time-scale HIDs (Fig. 3) show a change from harder-when-brighter to softer-when-brighter behaviour as the count rate increases. A simple explanation is that there are two components in the emission, such as the Comptonisation of thermal seed photons from the accretion disc and the Comptonisation of cyclo-synchrotron seed photons from the RIAF and corona itself, and we are observing a change in the relative proportion of these two components. A similar model was proposed by Skipper et al. (2013) to explain the complex correlations between spectral index and count rate on very short time-scales.
In the hardest of the hard-intermediate state observations (e.g. obs. 28 and 35, Fig. 3, and obs. 50, 37 and 39, Fig. 13) there is a hint of harder-when-brighter behaviour, possibly at a slightly lower count rate than in the hard state, but most of the hard-intermediate-state observations are at higher count rates and show only softer-when-brighter behaviour, consistent with disc-dominated seed photon supply. One possible explanation for the lower count rates of the transition in the hard-intermediate state is that the accretion disc persists to smaller radii, and thus the harder-when-brighter behaviour which is characteristic of domination by seed photons from the corona or RIAF does not dominate until lower absolute accretion rates.
The tendency for both Cygnus X-1 and GX 339-4 to become increasingly dominated by high-frequency variability as the source softens through the hard and hard-intermediate states (Fig. 10) is consistent with the inward motion of a truncated accretion disc, although the low-energy limit of 3 keV precludes us from attempting to fit any cool disc component which may be present in the hard state. The observations are furthermore consistent with variations being generated mainly in the disc, with higher frequencies coming from smaller radii (e.g. Lyubarskii, 1997; Arévalo and Uttley, 2006).
Whereas the rms spectra are reasonably well fitted by a single power-law in both the hard and hard-intermediate states, the energy spectra in these states are slightly different. In the hard state the energy spectra are fitted well by a single power-law with slope similar to that of the rms spectra, but the short time-scale HIDs (Fig. 3) show some harder-when-brighter behaviour and some softer-when-brighter behaviour, indicative of two components. The single power-law fits to both the energy and rms spectra may simply mean that both components have similar spectral indices, arising from similar optical depths and temperature distributions. However, one component could still be more variable than the other.
In the hard-intermediate state an additional power-law is required to account for the excess emission in the energy spectrum above 10 keV. The spectral fits show that a second power-law, rather than a reflection component, is the best fit to this component, which we therefore associate with Comptonisation of seed photons from the RIAF. This hard component is considerably weakened in the low-frequency rms spectra (Fig. 10), and is absent from the high-frequency rms spectra. Overall fractional variability is lower in the hard-intermediate state than in the hard state (Fig. 9), and therefore this component must be less variable than the soft power-law component arising from disc variations.
The dual power-law spectra found in the hard-intermediate state suggest a much-increased difference between the temperature (due to the increasing effect of cooling from the inwardly-moving disc) and/or the optical depth (e.g. Makishima et al., 2008) of the inner accretion flow (where the cyclo-synchrotron seed photons are Comptonised) and the outer accretion flow (where the disc seed photons are Comptonised).
We note that a strongly polarised hard tail, possibly from a jet, has been detected above 400 keV in Cygnus X-1 using the INTEGRAL/IBIS telescope (Laurent et al., 2011). However, the polarised hard tail is not bright enough to explain the hard component seen here at lower energies. Extrapolating the polarised hard tail down to lower energies indicates that it would only contribute per cent of the flux seen here; alternatively, extrapolating the hard component deduced from obs. 33 (Table 4) to indicates that it would be times brighter than the observed polarised hard tail. We also note that the polarised hard tail has so far been seen only in a significantly softer state than those which we have discussed here, and so, at this stage, we do not associate it with the hard component seen here at lower energies.
7 Conclusion
We conclude that most of the variability properties discussed in this paper can be explained by the combination of a soft, variable component driven by disc variations with seed photons coming from the disc, and a second, harder, but less variable component arising from cyclo-synchrotron seed photons from the RIAF or corona. We associate the single harder-when-brighter power-law of XTE J1118+480 with the hard power-law found in Cygnus X-1, and the softer-when-brighter power-law which dominates the spectra of GX 339-4 with the soft power-law found in Cygnus X-1.
8 Acknowledgements
This research has made use of data obtained through the High Energy Astrophysics Science Archive Research Center Online Service, provided by the NASA/Goddard Space Flight Center. CJS acknowledges support from a STFC studentship and a summer bursary from the University of Southampton. IMcH acknowledges support from STFC under grant ST/G003084/1.
References
- Homan and Belloni (2005) J. Homan and T. Belloni, “The Evolution of Black Hole States”, Ap&SS 300 (2005) 107–117, astro-ph/0412597.
- Remillard and McClintock (2006) R. A. Remillard and J. E. McClintock, “X-Ray Properties of Black-Hole Binaries”, ARA&A 44 (2006) 49–92, astro-ph/0606352.
- Belloni (2010) T. M. Belloni, “States and Transitions in Black Hole Binaries”, in “Lecture Notes in Physics, Berlin Springer Verlag”, T. Belloni, ed., vol. 794 of Lecture Notes in Physics, Berlin Springer Verlag, p. 53. 2010. arXiv:0909.2474.
- Zdziarski et al. (1998) A. A. Zdziarski, J. Poutanen, J. Mikolajewska, M. Gierlinski, K. Ebisawa, and W. N. Johnson, “Broad-band X-ray/gamma-ray spectra and binary parameters of GX 339-4 and their astrophysical implications”, MNRAS 301 (1998) 435–450, astro-ph/9807300.
- Ueda et al. (1994) Y. Ueda, K. Ebisawa, and C. Done, “Spectral study of GX 339-4 in the low-intensity state observed with GINGA”, PASJ 46 (1994) 107–115.
- Shakura and Sunyaev (1973) N. I. Shakura and R. A. Sunyaev, “Black holes in binary systems. Observational appearance.”, A&A 24 (1973) 337–355.
- Sunyaev and Titarchuk (1980) R. A. Sunyaev and L. G. Titarchuk, “Comptonization of X-rays in plasma clouds - Typical radiation spectra”, A&A 86 (1980) 121–138.
- Grove et al. (1998) J. E. Grove, W. N. Johnson, R. A. Kroeger, K. McNaron-Brown, J. G. Skibo, and B. F. Phlips, “Gamma-Ray Spectral States of Galactic Black Hole Candidates”, ApJ 500 (1998) 899, astro-ph/9802242.
- Belloni (2005) T. Belloni, “Black Hole States: Accretion and Jet Ejection”, in “Interacting Binaries: Accretion, Evolution, and Outcomes”, L. Burderi, L. A. Antonelli, F. D’Antona, T. di Salvo, G. L. Israel, L. Piersanti, A. Tornambè, and O. Straniero, eds., vol. 797 of American Institute of Physics Conference Series, pp. 197–204. 2005. astro-ph/0504185.
- Belloni et al. (2006) T. Belloni, I. Parolin, M. Del Santo, J. Homan, P. Casella, R. P. Fender, W. H. G. Lewin, M. Méndez, J. M. Miller, and M. van der Klis, “INTEGRAL/RXTE high-energy observation of a state transition of GX 339-4”, MNRAS 367 (2006) 1113–1120, astro-ph/0601031.
- Sobolewska et al. (2011) M. A. Sobolewska, I. E. Papadakis, C. Done, and J. Malzac, “Evidence for a change in the X-ray radiation mechanism in the hard state of Galactic black holes”, MNRAS 417 (2011) 280–288, arXiv:1106.1645.
- Wu and Gu (2008) Q. Wu and M. Gu, “The X-Ray Spectral Evolution in X-Ray Binaries and Its Application to Constrain the Black Hole Mass of Ultraluminous X-Ray Sources”, ApJ 682 (2008) 212–217, 0803.2551.
- Zdziarski et al. (2002) A. A. Zdziarski, J. Poutanen, W. S. Paciesas, and L. Wen, “Understanding the Long-Term Spectral Variability of Cygnus X-1 with Burst and Transient Source Experiment and All-Sky Monitor Observations”, ApJ 578 (2002) 357–373, astro-ph/0204135.
- Wu et al. (2010) Y. X. Wu, T. M. Belloni, and L. Stella, “Fast spectral variability from Cygnus X-1”, MNRAS 408 (2010) 2413–2425, arXiv:1007.0474.
- Constantin et al. (2009) A. Constantin, P. Green, T. Aldcroft, D.-W. Kim, D. Haggard, W. Barkhouse, and S. F. Anderson, “Probing the Balance of AGN and Star-forming Activity in the Local Universe with ChaMP”, ApJ 705 (2009) 1336–1355, arXiv:0909.4086.
- Gu and Cao (2009) M. Gu and X. Cao, “The anticorrelation between the hard X-ray photon index and the Eddington ratio in low-luminosity active galactic nuclei”, MNRAS 399 (2009) 349–356, arXiv:0906.3560.
- Shemmer et al. (2006) O. Shemmer, W. N. Brandt, H. Netzer, R. Maiolino, and S. Kaspi, “The Hard X-Ray Spectral Slope as an Accretion Rate Indicator in Radio-quiet Active Galactic Nuclei”, ApJL 646 (2006) L29–L32, astro-ph/0606389.
- Lamer et al. (2003) G. Lamer, I. M. McHardy, P. Uttley, and K. Jahoda, “X-ray spectral variability of the Seyfert galaxy NGC 4051”, MNRAS 338 (2003) 323–330, astro-ph/0209155.
- Sobolewska and Papadakis (2009) M. A. Sobolewska and I. E. Papadakis, “The long-term X-ray spectral variability of AGN”, MNRAS 399 (2009) 1597–1610, arXiv:0911.0265.
- Emmanoulopoulos et al. (2012) D. Emmanoulopoulos, I. E. Papadakis, I. M. McHardy, P. Arévalo, D. E. Calvelo, and P. Uttley, “The ’harder when brighter’ X-ray behaviour of the low-luminosity active galactic nucleus NGC 7213”, MNRAS 424 (2012) 1327–1334, arXiv:1205.3524.
- Maccarone (2003) T. J. Maccarone, “Do X-ray binary spectral state transition luminosities vary?”, A&A 409 (2003) 697–706, astro-ph/0308036.
- Gierliński and Newton (2006) M. Gierliński and J. Newton, “X-ray spectral transitions of black holes from RXTE All-Sky Monitor”, MNRAS 370 (2006) 837–844, astro-ph/0601676.
- Narayan and Yi (1994) R. Narayan and I. Yi, “Advection-dominated accretion: A self-similar solution”, ApJL 428 (1994) L13–L16, astro-ph/9403052.
- Abramowicz et al. (1995) M. A. Abramowicz, X. Chen, S. Kato, J.-P. Lasota, and O. Regev, “Thermal equilibria of accretion disks”, ApJL 438 (1995) L37–L39, astro-ph/9409018.
- Guilbert et al. (1982) P. W. Guilbert, A. C. Fabian, and R. R. Ross, “Time-dependent X-ray spectra of Compton-cooled plasmas”, MNRAS 199 (1982) 763–774.
- Churazov et al. (2001) E. Churazov, M. Gilfanov, and M. Revnivtsev, “Soft state of Cygnus X-1: stable disc and unstable corona”, MNRAS 321 (2001) 759–766, astro-ph/0006227.
- Esin et al. (1997) A. A. Esin, J. E. McClintock, and R. Narayan, “Advection-dominated Accretion and the Spectral States of Black Hole X-Ray Binaries: Application to Nova MUSCAE 1991”, ApJ 489 (1997) 865, astro-ph/9705237.
- Done and Zycki (1999) C. Done and P. T. Zycki, “Relativistic distortions in the X-ray spectrum of CYG X-1”, MNRAS 305 (1999) 457–468, astro-ph/9812261.
- Tomsick et al. (2009) J. A. Tomsick, K. Yamaoka, S. Corbel, P. Kaaret, E. Kalemci, and S. Migliari, “Truncation of the Inner Accretion Disk Around a Black Hole at Low Luminosity”, ApJL 707 (2009) L87–L91, arXiv:0911.2240.
- Miller et al. (2006) J. M. Miller, J. Homan, D. Steeghs, M. Rupen, R. W. Hunstead, R. Wijnands, P. A. Charles, and A. C. Fabian, “A Long, Hard Look at the Low/Hard State in Accreting Black Holes”, ApJ 653 (2006) 525–535, astro-ph/0602633.
- Liu et al. (2007) B. F. Liu, R. E. Taam, E. Meyer-Hofmeister, and F. Meyer, “The Existence of Inner Cool Disks in the Low/Hard State of Accreting Black Holes”, ApJ 671 (2007) 695–705, 0709.0143.
- Reis et al. (2010) R. C. Reis, A. C. Fabian, and J. M. Miller, “Black hole accretion discs in the canonical low-hard state”, MNRAS 402 (2010) 836–854, arXiv:0911.1151.
- Yamada et al. (2013) S. Yamada, K. Makishima, C. Done, S. Torii, H. Noda, and S. Sakurai, “Evidence for a Cool Disk and Inhomogeneous Coronae from Wide-Band Temporal Spectroscopy of Cygnus X-1 with Suzaku”, PASJ 65 (2013) 80, arXiv:1304.1968.
- Gierliński et al. (1999) M. Gierliński, A. A. Zdziarski, J. Poutanen, P. S. Coppi, K. Ebisawa, and W. N. Johnson, “Radiation mechanisms and geometry of Cygnus X-1 in the soft state”, MNRAS 309 (1999) 496–512, astro-ph/9905146.
- Böck et al. (2011) M. Böck, V. Grinberg, K. Pottschmidt, M. Hanke, M. A. Nowak, S. B. Markoff, P. Uttley, J. Rodriguez, G. G. Pooley, S. Suchy, R. E. Rothschild, and J. Wilms, “Spectro-timing analysis of Cygnus X-1 during a fast state transition”, A&A 533 (2011) A8, arXiv:1107.4974.
- Wilms et al. (2006) J. Wilms, M. A. Nowak, K. Pottschmidt, G. G. Pooley, and S. Fritz, “Long term variability of Cygnus X-1. IV. Spectral evolution 1999-2004”, A&A 447 (2006) 245–261, astro-ph/0510193.
- Grinberg et al. (2013) V. Grinberg, N. Hell, K. Pottschmidt, M. Böck, M. A. Nowak, J. Rodriguez, A. Bodaghee, M. Cadolle Bel, G. L. Case, M. Hanke, M. Kühnel, S. B. Markoff, G. G. Pooley, R. E. Rothschild, J. A. Tomsick, C. A. Wilson-Hodge, and J. Wilms, “Long term variability of Cygnus X-1. V. State definitions with all sky monitors”, A&A 554 (2013) A88, arXiv:1303.1198.
- Cui et al. (2002) W. Cui, Y.-X. Feng, and M. Ertmer, “A Peculiar Flaring Episode of Cygnus X-1”, ApJL 564 (2002) L77–L80, astro-ph/0112154.
- Malzac et al. (2006) J. Malzac, P. O. Petrucci, E. Jourdain, M. Cadolle Bel, P. Sizun, G. Pooley, C. Cabanac, S. Chaty, T. Belloni, J. Rodriguez, J. P. Roques, P. Durouchoux, A. Goldwurm, and P. Laurent, “Bimodal spectral variability of <ASTROBJ>Cygnus X-1</ASTROBJ> in an intermediate state”, A&A 448 (2006) 1125–1137, astro-ph/0511725.
- Di Salvo et al. (2001) T. Di Salvo, C. Done, P. T. Życki, L. Burderi, and N. R. Robba, “Probing the Inner Region of Cygnus X-1 in the Low/Hard State through Its X-Ray Broadband Spectrum”, ApJ 547 (2001) 1024–1033, astro-ph/0010062.
- Zdziarski et al. (2004) A. A. Zdziarski, M. Gierliński, J. Mikołajewska, G. Wardziński, D. M. Smith, B. A. Harmon, and S. Kitamoto, “GX 339-4: the distance, state transitions, hysteresis and spectral correlations”, MNRAS 351 (2004) 791–807, arXiv:astro-ph/.
- Hynes et al. (2000) R. I. Hynes, C. W. Mauche, C. A. Haswell, C. R. Shrader, W. Cui, and S. Chaty, “The X-Ray Transient XTE J1118+480: Multiwavelength Observations of a Low-State Minioutburst”, ApJL 539 (2000) L37–L40, astro-ph/0005398.
- McClintock et al. (2001) J. E. McClintock, C. A. Haswell, M. R. Garcia, J. J. Drake, R. I. Hynes, H. L. Marshall, M. P. Muno, S. Chaty, P. M. Garnavich, P. J. Groot, W. H. G. Lewin, C. W. Mauche, J. M. Miller, G. G. Pooley, C. R. Shrader, and S. D. Vrtilek, “Complete and Simultaneous Spectral Observations of the Black Hole X-Ray Nova XTE J1118+480”, ApJ 555 (2001) 477–482, astro-ph/0103051.
- Reid et al. (2011) M. J. Reid, J. E. McClintock, R. Narayan, L. Gou, R. A. Remillard, and J. A. Orosz, “The Trigonometric Parallax of Cygnus X-1”, ApJ 742 (2011) 83, arXiv:1106.3688.
- Orosz et al. (2011) J. A. Orosz, J. E. McClintock, J. P. Aufdenberg, R. A. Remillard, M. J. Reid, R. Narayan, and L. Gou, “The Mass of the Black Hole in Cygnus X-1”, ApJ 742 (2011) 84, arXiv:1106.3689.
- Hynes et al. (2003) R. I. Hynes, D. Steeghs, J. Casares, P. A. Charles, and K. O’Brien, “Dynamical Evidence for a Black Hole in GX 339-4”, ApJL 583 (2003) L95–L98, arXiv:astro-ph/.
- Wagner et al. (2001) R. M. Wagner, C. B. Foltz, T. Shahbaz, J. Casares, P. A. Charles, S. G. Starrfield, and P. Hewett, “The Halo Black Hole X-Ray Transient XTE J1118+480”, ApJ 556 (2001) 42–46, arXiv:astro-ph/.
- Gelino et al. (2006) D. M. Gelino, Ş. Balman, Ü. Kızıloǧlu, A. Yılmaz, E. Kalemci, and J. A. Tomsick, “The Inclination Angle and Mass of the Black Hole in XTE J1118+480”, ApJ 642 (2006) 438–442, arXiv:astro-ph/.
- Khargharia et al. (2013) J. Khargharia, C. S. Froning, E. L. Robinson, and D. M. Gelino, “The Mass of the Black Hole in XTE J1118+480”, AJ 145 (2013) 21, arXiv:1211.2786.
- Fender et al. (2004) R. P. Fender, T. M. Belloni, and E. Gallo, “Towards a unified model for black hole X-ray binary jets”, MNRAS 355 (2004) 1105–1118, astro-ph/0409360.
- Belloni et al. (2005) T. Belloni, J. Homan, P. Casella, M. van der Klis, E. Nespoli, W. H. G. Lewin, J. M. Miller, and M. Méndez, “The evolution of the timing properties of the black-hole transient GX 339-4 during its 2002/2003 outburst”, A&A 440 (2005) 207–222, arXiv:astro-ph/.
- Smith et al. (2002) D. M. Smith, W. A. Heindl, and J. H. Swank, “Two Different Long-Term Behaviors in Black Hole Candidates: Evidence for Two Accretion Flows?”, ApJ 569 (2002) 362–380, astro-ph/0103304.
- Maccarone and Coppi (2003) T. J. Maccarone and P. S. Coppi, “Hysteresis in the light curves of soft X-ray transients”, MNRAS 338 (2003) 189–196, astro-ph/0209116.
- Magdziarz and Zdziarski (1995) P. Magdziarz and A. A. Zdziarski, “Angle-dependent Compton reflection of X-rays and gamma-rays”, MNRAS 273 (1995) 837–848.
- Skipper et al. (2013) C. J. Skipper, I. M. McHardy, and T. J. Maccarone, “Very fast X-ray spectral variability in Cygnus X-1: origin of the hard- and soft-state emission components”, MNRAS 434 (2013) 574–584, arXiv:1306.2475.
- Shidatsu et al. (2011) M. Shidatsu, Y. Ueda, F. Tazaki, T. Yoshikawa, T. Nagayama, T. Nagata, N. Oi, K. Yamaoka, H. Takahashi, A. Kubota, J. Cottam, R. Remillard, and H. Negoro, “X-Ray and Near-Infrared Observations of GX 339-4 in the Low/Hard State with Suzaku and IRSF”, PASJ 63 (2011) 785, arXiv:1105.3586.
- Uttley and McHardy (2001) P. Uttley and I. M. McHardy, “The flux-dependent amplitude of broadband noise variability in X-ray binaries and active galaxies”, MNRAS 323 (2001) L26–L30, astro-ph/0103367.
- Heil et al. (2012) L. M. Heil, S. Vaughan, and P. Uttley, “The ubiquity of the rms-flux relation in black hole X-ray binaries”, MNRAS 422 (2012) 2620–2631, arXiv:1202.5877.
- Arévalo et al. (2008) P. Arévalo, I. M. McHardy, A. Markowitz, I. E. Papadakis, T. J. Turner, L. Miller, and J. Reeves, “Fourier-resolved energy spectra of the Narrow-Line Seyfert 1 Mkn 766”, MNRAS 387 (2008) 279–288, 0803.1668.
- Vaughan et al. (2003) S. Vaughan, R. Edelson, R. S. Warwick, and P. Uttley, “On characterizing the variability properties of X-ray light curves from active galaxies”, MNRAS 345 (2003) 1271–1284, astro-ph/0307420.
- Pottschmidt et al. (2003) K. Pottschmidt, J. Wilms, M. A. Nowak, G. G. Pooley, T. Gleissner, W. A. Heindl, D. M. Smith, R. Remillard, and R. Staubert, “Long term variability of Cygnus X-1. I. X-ray spectral-temporal correlations in the hard state”, A&A 407 (2003) 1039–1058, astro-ph/0202258.
- Gleissner et al. (2004) T. Gleissner, J. Wilms, K. Pottschmidt, P. Uttley, M. A. Nowak, and R. Staubert, “Long term variability of Cyg X-1. II. The rms-flux relation”, A&A 414 (2004) 1091–1104, astro-ph/0311039.
- Belloni et al. (1999) T. Belloni, M. Méndez, M. van der Klis, W. H. G. Lewin, and S. Dieters, “A State Transition of GX 339-4 Observed with the Rossi X-Ray Timing Explorer”, ApJL 519 (1999) L159–L163.
- Muñoz-Darias et al. (2011) T. Muñoz-Darias, S. Motta, and T. M. Belloni, “Fast variability as a tracer of accretion regimes in black hole transients”, MNRAS 410 (2011) 679–684, arXiv:1008.0558.
- Gilfanov et al. (2000) M. Gilfanov, E. Churazov, and M. Revnivtsev, “Frequency-resolved spectroscopy of Cyg X-1: fast variability of the reflected emission in the soft state”, MNRAS 316 (2000) 923–928, astro-ph/0001450.
- Revnivtsev et al. (1999) M. Revnivtsev, M. Gilfanov, and E. Churazov, “The frequency resolved spectroscopy of CYG X-1: fast variability of the Fe K_ line”, A&A 347 (1999) L23–L26, astro-ph/9906198.
- Grinberg et al. (2014) V. Grinberg, K. Pottschmidt, M. Böck, C. Schmid, M. A. Nowak, P. Uttley, J. A. Tomsick, J. Rodriguez, N. Hell, A. Markowitz, A. Bodaghee, M. Cadolle Bel, R. E. Rothschild, and J. Wilms, “Long term variability of Cygnus X-1. VI. Energy-resolved X-ray variability 1999-2011”, A&A 565 (2014) A1, arXiv:1402.4485.
- Makishima et al. (2008) K. Makishima, H. Takahashi, S. Yamada, C. Done, A. Kubota, T. Dotani, K. Ebisawa, T. Itoh, S. Kitamoto, H. Negoro, Y. Ueda, and K. Yamaoka, “Suzaku Results on Cygnus X-1 in the Low/Hard State”, PASJ 60 (2008) 585–, 0801.3315.
- Noda et al. (2014) H. Noda, K. Makishima, S. Yamada, K. Nakazawa, S. Sakurai, and K. Miyake, “Suzaku Studies of the Central Engine in the Typical Type I Seyfert NGC 3227: Detection of Multiple Primary X-Ray Continua with Distinct Properties”, ApJ 794 (2014) 2, arXiv:1406.5131.
- Lyubarskii (1997) Y. E. Lyubarskii, “Flicker noise in accretion discs”, MNRAS 292 (1997) 679.
- Arévalo and Uttley (2006) P. Arévalo and P. Uttley, “Investigating a fluctuating-accretion model for the spectral-timing properties of accreting black hole systems”, MNRAS 367 (2006) 801–814, astro-ph/0512394.
- Laurent et al. (2011) P. Laurent, J. Rodriguez, J. Wilms, M. Cadolle Bel, K. Pottschmidt, and V. Grinberg, “Polarized Gamma-Ray Emission from the Galactic Black Hole Cygnus X-1”, Science 332 (2011) 438, arXiv:1104.4282.