jameel@giki.edu.pk
First-forbidden transitions and stellar -decay rates of Zn and Ge isotopes
Abstract
First-forbidden (FF) charge-changing transitions become relatively important for nuclei as their proton number increases. This is because the strength of allowed Gamow-Teller (GT) transitions decreases with increasing Z. The FF transitions play an important role in reducing the half-lives as against those calculated from taking the GT transitions alone into account. In this paper we calculate allowed GT as well as and transitions for neutron-rich Zn and Ge isotopes. Two different pn-QRPA models were used with a schematic separable interaction to calculate GT and FF transitions. Half-lives calculated after inclusion of FF transitions were in excellent agreement with the experimental data. Our calculations were also compared to previous QRPA calculations and were found to be in better agreement with measured data. Stellar -decay rates were calculated for these nuclei including allowed GT and unique FF transitions for astrophysical applications. 86,88Ge has a sizeable contribution to the total stellar rate from unique FF transitions.
pacs:
21.60.Jz, 23.40.Bw, 23.40.-s, 25.40.Kv, 26.30.Jk, 26.50.+x, 97.10.Cv1 Introduction
The subject of -decay of neutron-rich nuclei and their half lives have gained interest in the past few years. This is partly due to incoming results from the new generation of radioactive ion-beam facilities and partly due to their vital role in solving problems related to the stellar evolution. The eventual abundance of any stable nucleus depends strongly on the -decay half life of its neutron rich forebear. Electron-neutrino captures could not only amplify the effect of -decays in neutron rich environments but the subsequent neutrino induced neutron spallation can also contribute towards changing the -abundance distribution pattern [1]. Stellar weak interaction processes, for densities 1011 g/cm3, are dominated by Gamow-Teller (GT) and, if applicable, also by Fermi transitions. Forbidden transition contributes generously, as one moves away from the line of stability, when the electron chemical potential reaches a value of 30 MeV. In case of neutron-rich nuclei, the first-forbidden (FF) -decay rates may become important due to the enlarged phase space for these transitions for densities [2]. Forbidden transitions contribute significantly to the total half-life for nuclei crossing the closed N and Z shells, specially for N 50 in 78Ni region. At the same time the FF transitions become relatively important for nuclei with large Z. The contribution from the allowed GT transitions gets smaller for such nuclei and bears consequences for the nucleosynthesis calculations [3].
Primarily due to the lack of experimental data, majority of the -decay rates for neutron rich nuclei have been investigated using theoretical models. The proton neutron quasi-particle random phase approximation (pn-QRPA) model has been widely used in studies of nuclear -decay properties. In this microscopic model, construction of a quasi-particle basis is first performed with a pairing interaction, and then the RPA equation is solved with GT residual interaction. The pn-QRPA model was developed by Halbleib and Sorensen [4] by generalizing the usual RPA to describe charge-changing transitions. The hybrid version of RPA model was developed by Möller and his coworkers [5]. They combined the pn-QRPA model with the Gross Theory of the FF decay. For studying deformed nuclei and nuclei with odd nucleons many changes were made to the pn-QRPA model [6, 7, 8, 9, 10]. It was Nabi and Klapdor who used the pn-QRPA model, for the first time, to calculate stellar weak rates [11, 12, 13]. A methodical study of the total -decay half-lives and delayed neutron emission probabilities using the pn-QRPA model, taking into account the GT and FF transitions , can be further examined in [14].
In this paper an attempt is made to calculate the FF -decay rates for neutron-rich even-even zinc (76-82Zn) and germanium isotopes (84-88Ge) using the pn-QRPA model. Motivation of the current work came partly from the work of [2] where the authors expressed their interest to include rank 0 contribution to first forbidden decay rates for a better agreement with the measured data. In [2] the unique first-forbidden (U1F) -decay rates (rank 2) and total -decay half-lives for 72-78Ni were calculated for the first time using the pn-QRPA model in stellar environment. The aim of this paper is to highlight the importance of FF transitions in the calculation of -decay rates of neutron-rich Zn and Ge isotopes. The formalism of allowed GT, FF and U1F transition rates is given in Section 2 of this paper. Section 3 show our calculation of allowed and FF charge-changing transitions for Zn and Ge isotopes. Here we compare our calculated half-lives with experimental and other theoretical calculations. We also present our calculation of stellar -decay rates in this section. We finally conclude our findings in Section 4.
2 Formalism
The theory of allowed and FF -decay transitions is well-established [15, 16, 17, 18]. The allowed -decay is simple to calculate but the FF decay shows a far wider spectrum both in lepton kinematics and in nuclear matrix elements. All our calculations for allowed and FF -decay rates were performed within the framework of the pn-QRPA model. Two different pn-QRPA models were used to calculate allowed and forbidden -decay rates. The first pn-QRPA model considered only spherical nuclei using the Woods-Saxon potential basis and is referred to as pn-QRPA(WS) in this paper. The transition probabilities in this model were calculated within the approximation ( is a dimensionless parameter representing the magnitude of the Coulomb energy and is approximated by ). Calculation of rank 0 FF transitions (0+0-) and U1F transitions (0+2-) was done within the pnQRPA(WS) formalism. Details of this model can be seen from [19]. For the same model, allowed GT transitions were calculated using the Pyatov method (PM) [20] to solve the RPA equation. The second pn-QRPA model employed a deformed Nilsson basis and is referred to as pn-QRPA(N) in this paper. A separable interaction was used both in particle-particle and particle-hole channels which transformed the eigenvalue equation to an algebraic equation of fourth order (for further details of solution see [10]). Deformation of nuclei was taken into account in the pn-QRPA(N) model. Allowed GT and U1F transitions were calculated within the pn-QRPA(N) formalism. The theoretical models used in our calculation make it stand apart from previous calculations (e.g. [21, 22]). The continuum-QRPA framework employed by [21] included a self-consistent mean-field potential (for ground state) and a universal effective interaction (for excited states) for calculation of GT and FF transitions. Both potentials originated from the unique nuclear energy-density functional. On the other hand [22] used a folded-Yukawa single-particle Hamiltonian for calculation of -decay rates. They incorporated pairing, deformed Nilsson basis and a separable interaction akin to our calculation. However they did not consider particle-particle interaction. Nor did they calculate FF decays as done in current work.
The axial-vector coupling constant is renormalized (mainly due to truncations in the nuclear structure calculations but also from the interference of non-nucleonic degrees of freedom). Ref. [23] suggested that in the pn-QRPA calculation brings the theoretical and experimental decay value in close correspondence for = 100, 116 and 128 isobaric chains. It was also commented in this paper that a similar type of quenching is obtained in the interacting shell model and interacting boson model. (See also [24] for accessing value close to in the pn-QRPA calculation). For U1F transitions authors in [25] employed a much tighter quenching factor of 0.5. In order to compare our results with experimental data and previous calculations, we introduced a quenching factor of [26, 27, 28] in both pn-QRPA(WS) and pn-QRPA(N) models as also used in shell model calculations. In future we would like to explore the effect of using different quenching factor for allowed, FF and U1F transitions in pn-QRPA(WS) and pn-QRPA(N) models. The same quenching factor was employed later to calculate stellar -decay rates.
Below we describe briefly the formalism used to calculate GT, FF and U1F transitions using the pnQRPA(WS) model. We later present the formalism for GT and U1F -decay rates using the pnQRPA(N) model.
2.1 Allowed GT, FF and U1F transitions using the pn-QRPA(WS) model
The model Hamiltonian which generates the spin-isospin dependent vibration modes with in odd-odd nuclei in quasi boson approximation is given by
| (1) |
where the single quasi-particle (sqp) Hamiltonian of the system is given by
| (2) |
In above equation is single quasi-particle energy of the nucleons with angular momentum , and and () is the quasi-particle creation (annihilation) operators.
The and are the spin-isospin effective interaction Hamiltonians, which generates and vibration modes in particle-hole and particle-particle channel, respectively. To save space we are not reproducing the detailed formalism. Interested readers are referred to [19].
| (5) |
| (6) |
The transitions probabilities in approximation are given by [29]
| (7) |
where
and the are non-relativistic first forbidden decay multipole operators [29],
| (8) |
All symbols have there usual meanings.
The ft values are given by the following expression:
| (9) |
where
In order to calculate the allowed GT transitions in the pn-QRPA(WS) model we note that the GT operators are given by
| (10) |
The commutation condition between the total Hamiltonian and GT operator can be described as
| (11) |
where , , and are isovector, Coulomb, and spin-orbit interaction potentials, respectively. We considered a system of nucleons in a spherical symmetric average field with pairing forces. The corresponding quasi-particle Hamiltonian is given by Eq. 2 and does not commute with the GT operators. The broken symmetry is then restored using an effective interaction employing the Pyatov method. Details of solution of allowed GT formalism can be seen in [30].
The ft values for the allowed GT transitions were finally calculated using
| (12) |
where the reduced matrix elements of GT transitions are given by
| (13) |
2.2 Allowed GT, U1F transitions and stellar -decay rates using the pn-QRPA(N) model
In the pn-QRPA(N) formalism [10], proton-neutron residual interactions occur as particle-hole (characterized by interaction constant ) and particle-particle (characterized by interaction constant ) interactions. We used a schematic separable interaction (as in the case of pn-QRPA(WS) model). Details of the separable potential may be seen from [2] (and references therein). The advantage of using these separable GT forces is that the QRPA matrix equation reduces to an algebraic equation of fourth order, which is much easier to solve as compared to full diagonalization of the non-Hermitian matrix of large dimensionality [10, 14].
Essentially we first constructed a quasiparticle basis (defined by a Bogoliubov transformation) with a pairing interaction, and then solved the RPA equation with a schematic separable GT residual interaction. The single particle energies were calculated using a deformed Nilsson oscillator potential with a quadratic deformation. The pairing correlation was taken into account in the BCS approximation using constant pairing forces. The BCS calculation was performed in the deformed Nilsson basis for neutrons and protons separately. The formalism for calculation of allowed -decay rates in stellar matter using the pn-QRPA(N) model can be seen in detail from Refs. [12, 13]. Below we describe briefly the necessary formalism to calculate the U1F -decay rates.
The nuclear matrix elements of the separable forces which appear in RPA equation are given by
| (14) |
| (15) |
where
| (16) |
is a single-particle U1F transition amplitude (the symbols have their normal meaning). Note that takes the values , and (for allowed decay rates only takes the values and ), and the proton and neutron states have opposite parities [14]. Interaction constant was taken to be MeV for allowed and MeV fm-2 for U1F transitions, assuming a dependence [14]. The other interaction constant was taken to be zero. These values of and best reproduced the measured half-lives.
Deformation of the nuclei was calculated using
| (17) |
where and are the atomic and mass numbers, respectively and is the electric quadrupole moment taken from [31]. Q-values were taken from the mass compilation of Audi et al. [32].
We are currently working on the calculation of rank 0 FF transition phase space factors at finite temperatures. This would be treated as a future assignment and currently we are able to calculate only the phase space factors for rank 2 U1F transitions under stellar conditions. The U1F stellar -decay rates from the th state of the parent to the th state of the daughter nucleus is given by
| (18) |
where and are the integrated Fermi function and the reduced transition probability for -decay, respectively, for the transition which induces a spin-parity change . In Eq. 18 is the weak coupling constant which takes the value or according to whether the transition is associated with the vector or axial-vector weak-interaction. The phase-space factors are given as integrals over the lepton distribution functions and hence are sensitive functions of the temperature and density in stellar interior. The are related to the U1F weak interaction matrix elements stated earlier.
For the U1F transitions the integral can be obtained as
| (19) |
where is the total kinetic energy of the electron including its rest mass and is the total -decay energy (, where and are mass and excitation energies of the parent nucleus, and and of the daughter nucleus, respectively). are the electron distribution functions.
The Fermi functions, and appearing in Eq. (19) were calculated according to the procedure adopted by [33].
There is a finite probability of occupation of parent excited states in the stellar environment as a result of the high temperature in the interior of massive stars. Weak decay rates then also have a finite contribution from these excited states. The occupation probability of a state is calculated on the assumption of thermal equilibrium,
| (20) |
where is the excitation energy of the parent state. The rate per unit time per nucleus for stellar -decay process is finally given by
| (21) |
The summation over all initial and final states were carried out until satisfactory convergence in the rate calculations was achieved. We note that due to the availability of a huge model space (up to 7 major oscillator shells) convergence was easily achieved in our rate calculations for excitation energies well in excess of 10 MeV (for both parent and daughter states).
3 Results and Comparison
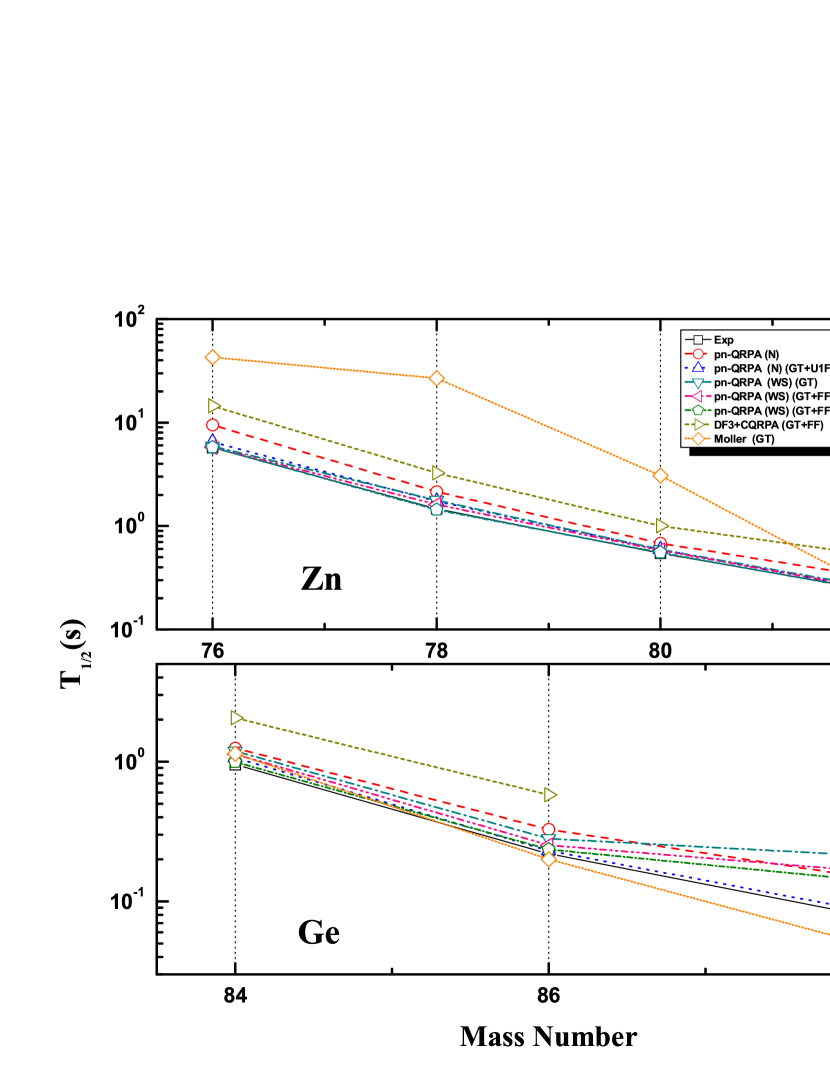
In order to check the improvement in pn-QRPA calculations brought by incorporation of FF contribution, we compare our calculated -decay half-lives with experimental data and other model calculations in Fig. 1. The upper panel shows result for Zn isotopes whereas the lower panel for Ge isotopes. All experimental half-lives were taken from the recent atomic mass evaluation data [32]. We show results of our calculated allowed GT calculations alone and those including the FF contribution. Shown also is the self-consistent density functional + continuum quasiparticle random phase approximation (DF3 + CQRPA) calculation of [21] including the FF contribution. The QRPA calculation by Möller and collaborators [22] including deformation of nucleus and folded-Yukawa single-particle potential is also presented in Fig. 1. It is to be noted that [22] did not calculate FF contribution. It is noted from Fig. 1 that FF contribution brings substantial improvement in our pn-QRPA calculated half-lives. The pn-QRPA(N) calculation including deformation has a sizeable contribution from FF decay. The pn-QRPA(WS) results are in better agreement with measured data for Zn isotopes (upper panel) whereas the pn-QRPA(N) shows overall best agreement with experimental data. For Zn and Ge isotopes, the DF3+CQRPA results are roughly a factor two bigger than measured data. GT calculation of [22] are even bigger for obvious reason. However the agreement is excellent for the case of 82Zn. Similarly in lower panel the agreement is outstanding for the case of 88Ge. It may be concluded that the QRPA calculation of Möller et al. gets in better agreement with measured data as the nucleus becomes more neutron-rich. DF3+CQRPA did not perform calculation for 88Ge. It is noted that pn-QRPA model calculations (with FF contribution) are in excellent agreement with the experimentally determined half-lives of Zn and Ge isotopes. The pn-QRPA calculations are expected to give reliable half-lives for nuclei close to neutron-drip line for which no experimental data is available.
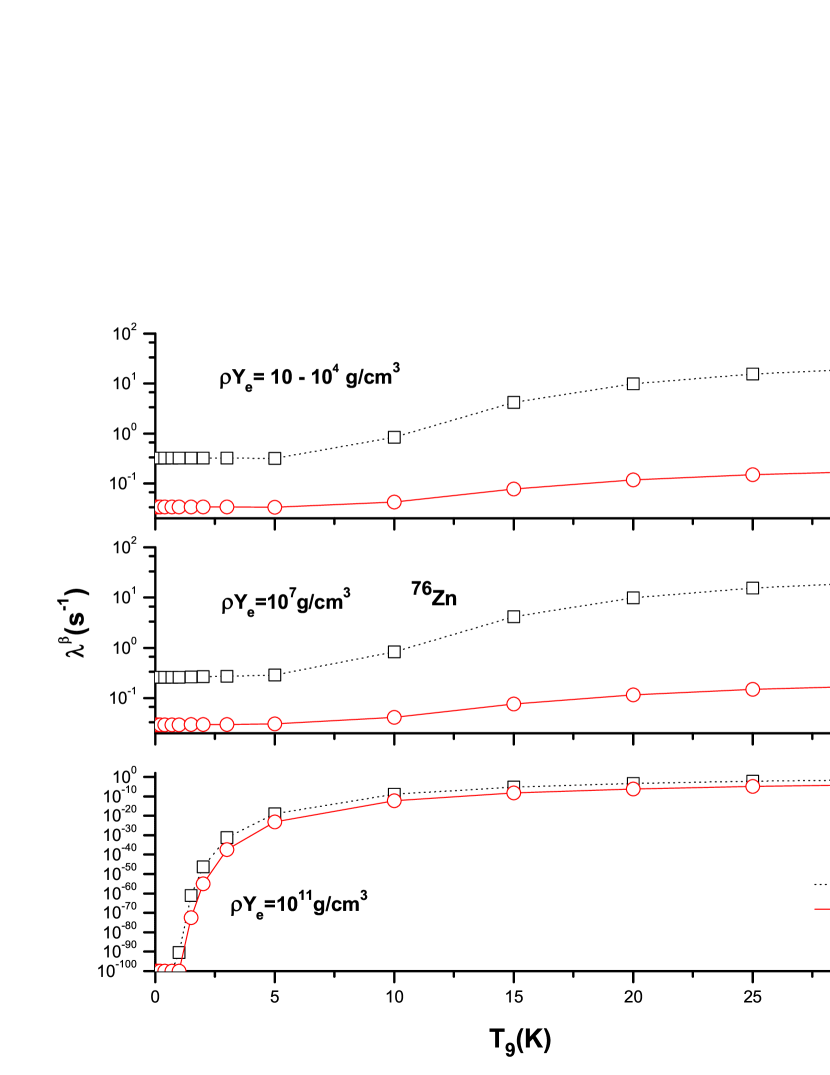
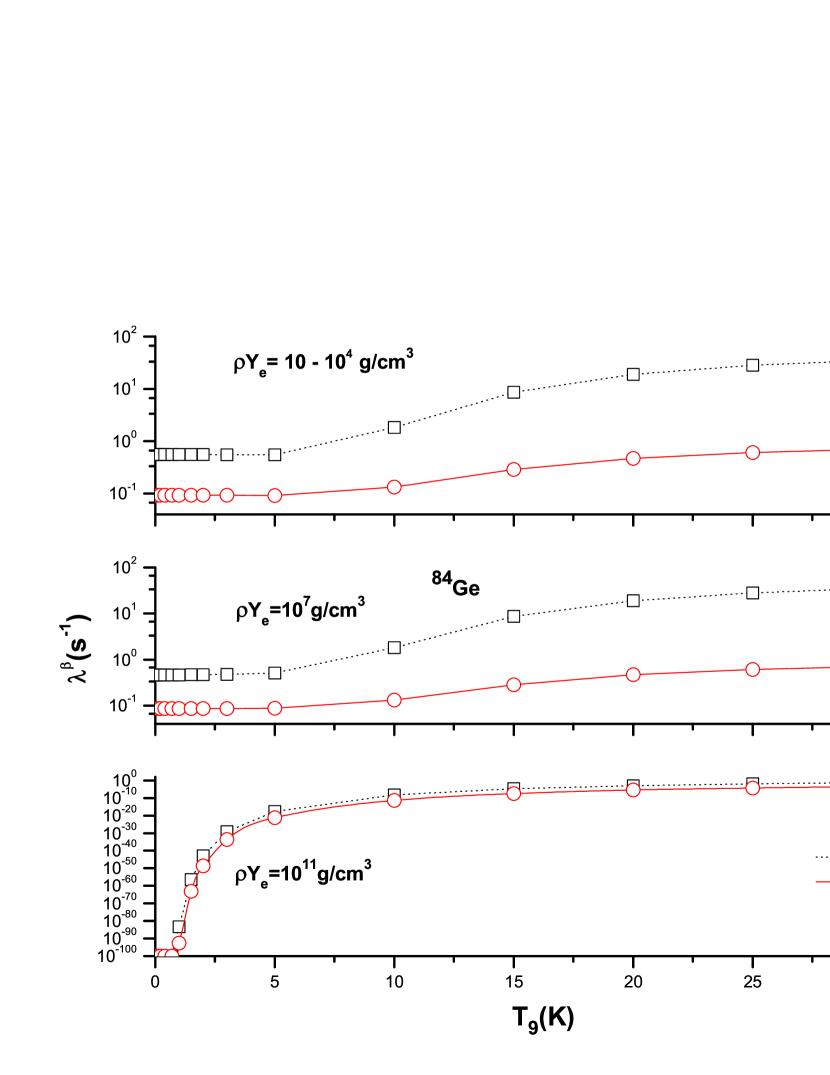
After achieving excellent comparison with the experimental half-lives, we next proceeded to calculate allowed GT and forbidden -decay rates in stellar environment. Allowed and U1F -decay rates were calculated for densities in the range 10 - 1011g/cm3 and temperature range 0.01 T9 30 (T9 gives the stellar temperature in units of 109 K) for Zn and Ge isotopes. Figs. 2 and 3 show three panels depicting pn-QRPA(N) calculated allowed and U1F -decay rates for temperature range 0.01 T9 30 for 76Zn and 84Ge, respectively. The upper panel depicts the situation at low stellar densities ranging from 10 - 104 g/cm3 (the -decay rates remain constant in this density range), the middle panel for intermediate stellar density 107 g/cm3 and the lower panel at a high stellar density of 1011 g/cm3. It is to be noted that for both figures the abscissa is given in logarithmic scales. Fig. 2 depicts stellar -decay rates for 76Zn in units of . It is to be noted that contribution from all excited states are included in the final calculation of all decay rates (refer to Eq. 21). It can be seen from this figure that, for low and intermediate densities, the allowed -decay rates are one order of magnitude bigger at low temperatures and around two orders of magnitude bigger at T9 = 30. The phase space factor of allowed GT is around one order of magnitude bigger than U1F phase space for 76Zn (see Fig. 4). At high densities the allowed -decay rates are several orders of magnitude bigger at low temperatures and around two orders of magnitude bigger at T9 = 30. The reason primarily lies in the calculation of phase spaces at high densities which we discuss shortly. The U1F -decay rates are around a factor six smaller at low temperatures and densities for 84Ge (Fig. 3). At high temperatures allowed rates are a factor 50 bigger. As density increases the allowed -decay rates become several orders of magnitude bigger at low temperatures and more than one order of magnitude bigger at T9 = 30.
We present our calculated stellar -decay rates (GT and U1F contributions) for remaining Zn and Ge isotopes in Tab. 1 and Tab. 2, respectively. In these tables entries represent decay rates smaller than s-1.
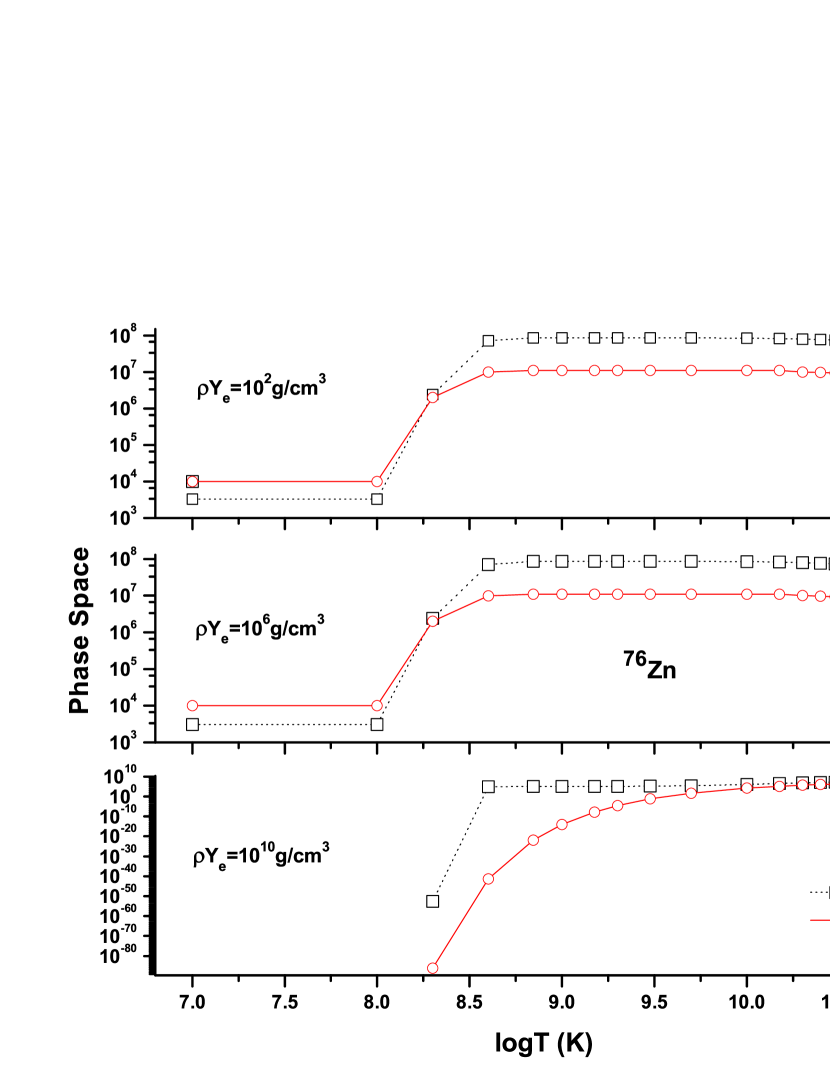
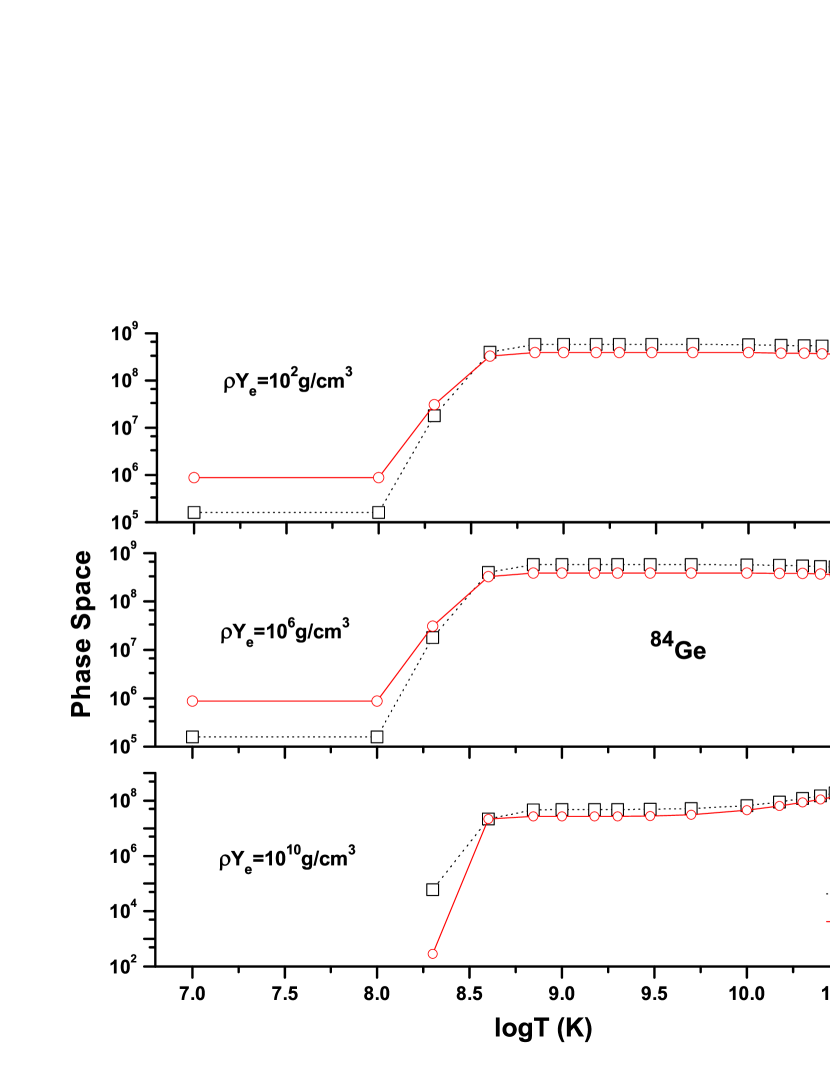
The amplification of phase space under stellar conditions due to U1F transitions results in significant enhancement in the calculated total -decay rates. The phase space integrals for U1F transitions compete well with those of allowed GT and under certain stellar conditions supersede the allowed phase space (at low stellar temperatures). The phase space calculation for allowed and U1F transitions, as a function of stellar temperature and density, for the neutron-rich 76Zn and 84Ge is shown in Figs. 4 and 5, respectively. The phase space is calculated at selected density of 102 g/cm3, 106 g/cm3 and 1010 g/cm3 (corresponding to low, intermediate and high stellar densities, respectively) and stellar temperature range T9 = 0.01 - 30. The phase space factors for GT transitions start increasing at a much faster rate than those of U1F transitions as stellar temperature increases. At T9 = 30, the GT phase space is much bigger. At high stellar densities the phase space gets choked and becomes finite only as stellar temperature soars to T9 = 0.2. Similar trend in phase space calculation is seen for heavier isotopes of Zn and Ge. The phase space factor for U1F transitions gets amplified with increasing neutron number for a particular element. These enlarged U1F phase space contributes effectively to the forbidden -decay rates which we discussed earlier.
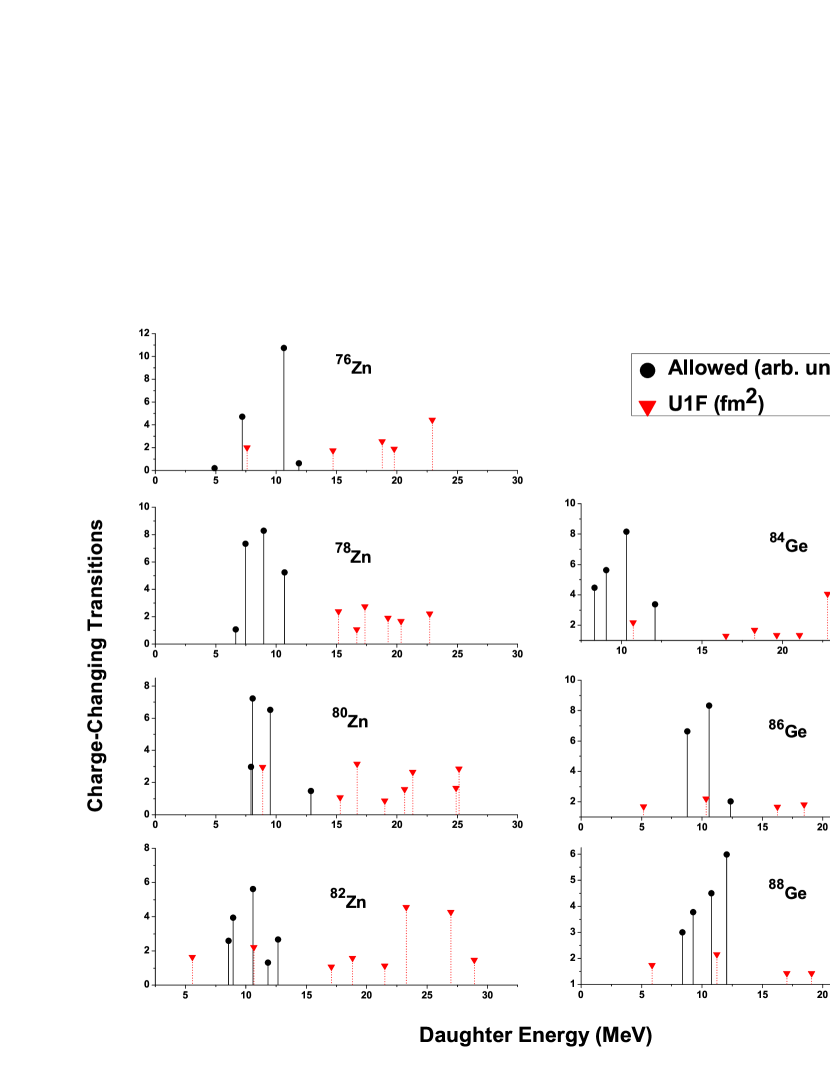
Towards the end of this section we present the calculated charge-changing transition distributions. The calculated GT and U1F transitions using the pn-QRPA(WS) model is shown in Fig. 6 for Zn and Ge isotopes. As mentioned earlier all these charge-changing transitions were quenched by a factor of 0.6. It can be seen form this figure that the pn-QRA(WS) model calculates high-lying transitions, specially for the U1F case. The transitions shown at such high energies do not show much fragmentation which is a drawback of neglecting deformation of nuclei.
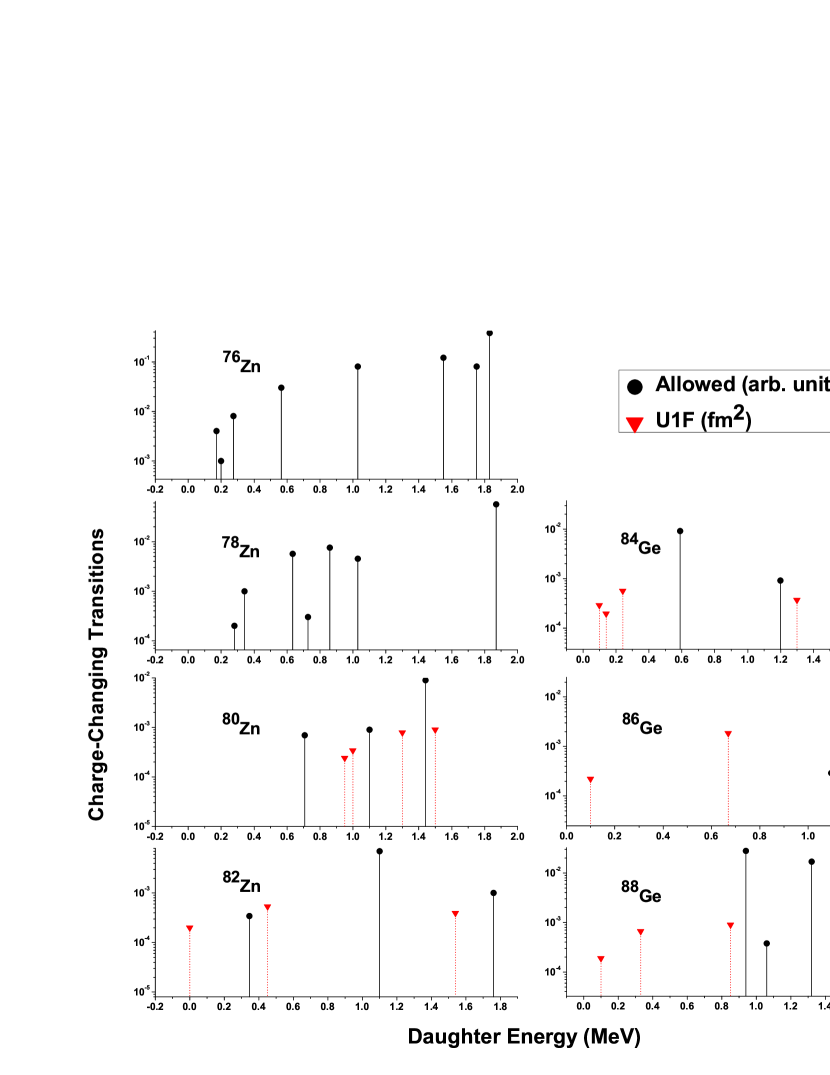
It is a well known fact that taking the deformation of the nucleus into consideration results in the fragmentation of -decay strength distribution in the pn-QRPA formalism [34, 35]. This also leads to shifting considerable strength in low-lying daughter states. This is a big advantage of the pn-QRPA(N) model that it is able to study the effects of deformation in calculation of strength functions. To improve the reliability of calculated transitions in our model, Experimental Unevaluated Nuclear Data List (XUNDL) were incorporated in our calculation wherever possible. Calculated excitation energies were replaced with measured levels when they were within 0.5 MeV of each other. Missing measured states were inserted and inverse transitions (along with their log values), where applicable, were also taken into account. No theoretical levels were replaced with the experimental ones beyond the excitation energy for which experimental compilations had no definite spin and/or parity assignment. This recipe for incorporation of XUNDL data is same as used in earlier pn-QRPA calculations of weak rates [12, 13]. The results of calculated allowed and U1F transition strengths using the pn-QRPA(N) model are shown in Fig. 7 for Zn and Ge isotopes. In this figure the abscissa indicates the excitation energy in daughter nuclei in units of MeV and a quenching factor of 0.6 is taken into account for all charge-changing transitions. In Fig. 7 we only show low-lying strength distribution up to excitation energy of 2 MeV in daughter nucleus. It is to be noted that calculation was performed up to 15 MeV in daughter. Calculated values of charge-changing strength smaller than 10-5 are not shown in Fig. 7. In contrast with the result of pn-QRPA(WS) model, we notice low-lying allowed GT strength in daughter Ga and As isotopes for reason mentioned above. The GT strength is also well fragmented in the case of 76,78Zn. Whereas no U1F transition strengths were calculated in 76,78Zn up to 2 MeV, we do calculate these in the case of 80,82Zn. We do find a U1F transition to ground state of 82Ga albeit of a very small strength. We obtain similar results for Ge isotopes using the pn-QRPA(N) model. One should note the low-lying U1F transitions in daughter arsenic isotopes. The U1F transitions result in reducing the calculated -decay half-lives bringing them in better comparison with the experimental data (discussed earlier).
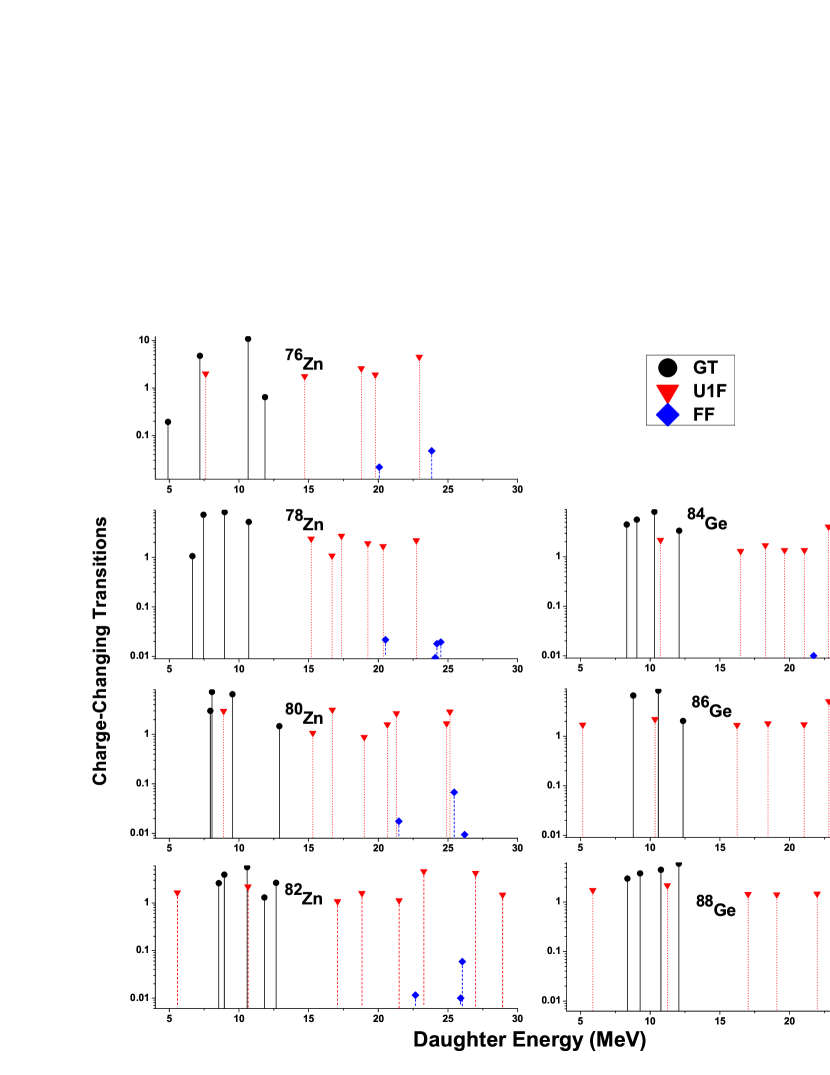
Fig. 8 shows the calculation of GT, FF and U1F transitions using the pn-QRPA(WS) model. As mentioned earlier we are in a process of calculating FF transitions using the pn-QRPA(N) model and this would be taken as a future assignment. It is seen from Fig. 8 that FF transitions are placed at even higher daughter energies. The results support the claim by experiments performed by [36, 37] that the average energy of the giant FF resonance lies at energy in excess of 20 MeV.
4 Conclusions
As the nuclei become heavier, strength of allowed GT transitions gets smaller and with increasing neutron number the contribution of FF transitions to the total half-lives becomes more significant. We used two versions of the pn-QRPA model, one for spherical nuclei and the other incorporating nuclear deformation, for our calculations. The spherical pn-QRPA(WS) was used to calculate allowed GT (using the Pyatov method), FF, U1F transitions and terrestrial -decay rates. The deformed pn-QRPA(N) was used to calculate the allowed and U1F transitions as well as terrestrial and stellar -decay rates.
The half-life calculations were compared with the recent atomic mass evaluation 2012 data and other theoretical calculations. The inclusion of FF transitions improved the overall comparison of calculated terrestrial -decay half-lives in the pn-QRPA(WS) model with the experimental data. Likewise, and more significantly, the UIF contribution improved the comparison of pn-QRPA(N) calculated half-lives. The DF3+CQRPA calculation was around a factor two bigger than experimental data. The allowed GT calculation by Möller and collaborators was up to a factor 18 bigger but were in agreement with measured half-lives as neutron number increased (82Zn and 88Ge).
Whereas the FF transitions to 0- and U1F transitions to 2- daughter states were calculated at rather high excitation energies using the pn-QRPA(WS) model, the 2- states using the pn-QRPA(N) were connected also to low-lying daughter states. Further the spectra was more fragmented which was attributed to the deformation parameter incorporated in the pn-QRPA(N) model.
It was shown that the U1F phase space has a sizeable contribution to the total phase space at stellar temperatures and densities. It was concluded that, for a particular element, the U1F phase space gets amplified with increasing neutron number. Specially for the case of 86,88Ge the calculated U1F phase spaces were several orders of magnitude bigger and resulted in significant reduction of the -decay half-lives in comparison to what would result from taking the contribution from the GT transitions alone into account. For 86,88Ge roughly half the contribution to the total decay rate comes from U1F transitions. This is a significant finding of the current work. It is expected that contribution of FF transition can increase further with increasing neutron number. The microscopic calculation of U1F stellar -decay rates, presented in this work, could lead to a better understanding of the nuclear composition and in the core prior to collapse and collapse phase.
New generation radioactive ion-beam facilities (e.g. FAIR (Germany), FRIB (USA) and FRIB (Japan)) will make assessable measured strength distribution of many more neutron-rich nuclei which in turn would pose new challenges for theoretical models. Our results support the argument that the pn-QRPA model calculates reliable half-lives for exotic nuclei, specially near neutron drip-line. The reduced -decay half-lives bear consequences for the nucleosynthesis problem and the site-independent -process calculations. Our findings might result in speeding-up of the -matter flow relative to calculations based on half-lives calculated only from allowed GT transitions. The effects of shorter half-lives resulted in shifting of the third peak of the abundance of the elements in the -process toward higher mass region [3, 38]. Simulators are urged to check for possible interesting changes in their results by incorporating the reported rates. We are in a process of including rank 1 operators in our FF calculation of terrestrial -decay half-lives in near future for still better results. The allowed and U1F stellar -decay rates on Zn and Ge isotopes were calculated on a fine temperature-density grid, suitable for simulation codes, and may be requested as ASCII files from the corresponding author.
References
References
- [1] McLaughlin G and Fuller G 1997 Astrophys. J. 489 766.
- [2] Nabi J-Un and Stoica S 2013 Astrophysics and Space Science 349 843-855.
- [3] Suzuki T, Honma M, Yoshida T, Mao H, Kajino T and Otsuka T 2011 Prog. Part. Nucl. Phys 66 385-389.
- [4] Halbleib J A and Sorensen R A 1967 Nucl. Phys. A 98 542.
- [5] Möller P, Pfeiffer B and Kratz K L 2003 Phys. Rev. C 67 055802.
- [6] Randrup J 1973 Nucl. Phys. A 207 209.
- [7] Möller P and Randrup J 1990 Nucl. Phys. A 514 1.
- [8] Bender E, Muto K and Klapdor H V 1988 Phys. Lett. B 208 53.
- [9] Muto K, Bender E and Klapdor H V 1989 Z. Phys. A 333 125.
- [10] Muto K, Bender E, Oda T and Klapdor-Kleingrothaus H V 1992 Z. Phys. A 341 407.
- [11] Nabi J-Un and Klapdor-Kleingrothaus H V 1999 Eur. Phys. J. A 5 337-339.
- [12] Nabi J-Un and Klapdor-Kleingrothaus H V 1999 At. Data Nucl. Data Tables 71 149.
- [13] Nabi J-Un, Klapdor-Kleingrothaus H V 2004 At. Data Nucl. Data Tables 88 237.
- [14] Homma H, Bender E, Hirsch M, Muto K, Klapdor-Kleingrothaus H V and Oda T 1996 Phys. Rev. C 54 6.
- [15] Grewe E W et al 2008 Phys. Rev. C 78 044301.
- [16] Schopper H F 1966 Weak Interactions and Nuclear Beta Decay (North-Holland, Amsterdam).
- [17] Wu C S and Moszkowski S A 1966 Beta Decay (Wiley, NewYork).
- [18] Commins E D 1973 Weak Interactions (McGraw-Hill, NewYork).
- [19] Cakmak N, Manisa K, Unlu S and Selam C 2010 Pranama J. Phys. 74 541.
- [20] Pyatov N I and Salamov D I 1977 Nucleonica 22 1-127.
- [21] Borzov I N 2005 Phys. Rev. C 71 065801.
- [22] Möller P et al 1997 At. Data Nucl. Data Tables 66 131.
- [23] Suhonen J and Civitarese O 2013 Phys. Lett. B 725 153.
- [24] Suhonen J and Civitarese O 2014 Nucl. Phys. A 924 1.
- [25] Ejiri H, Soukouti N and Suhonen J 2014 Phys. Lett. B 729 27.
- [26] Vetterli M C, Häusser O, Abegg R, Alford W P, Celler A, Frekers D, Helmer R, Henderson R, Hicks K H, Jackson, K P, Jeppesen R G, Miller C A, Raywood K and Yen S 1989 Phy. Rev. C 40 559-569.
- [27] Cakmak S, Nabi J-Un, Babacan T and Selam C 2014 Astrophys. Space Sci. 352 645-663.
- [28] Cakmak S, Nabi J-Un, Babacan T and Maras I 2014 Adv. Space Sci. 55 440-453 .
- [29] Bohr A and Mottelson B R 1969 Nuclear Structure (Benjamin, W.A. Inc., New York) Vol. 1.
- [30] Cakmak N, Unlu S and Selam C 2012 Phys. Atm. Nuc. 75 8.
- [31] Möller P and Nix J R 1981 At. Data Nucl. Data Tables 26 165.
- [32] Audi G, Wang M, Wapstra A H, Kondev F G, MacCormick M, Xu X and Pfeiffer B 2012 Chin. Phys. C 36 1287; Wang M, Audi G, Wapstra A H, Kondev F G, MacCormick M, Xu X and Pfeiffer B 2012 Chin. Phys. C 36 1603.
- [33] Gove N B and Martin M J 1971 At. Data Nucl. Data Tables 10 205.
- [34] Hirsch M, Staudt A, Muto K and Klapdor-Kleingrothaus H V 1993 At. Data Nucl. Data Tables 53 165.
- [35] Staudt A, Bender E, Muto K and Klapdor-Kleingrothaus H V 1990 At. Data Nucl. Data Tables 44 79.
- [36] Horen D J et al 1980 Phys. Lett. B 95 27.
- [37] Horen D J et al 1981 Phys. Lett. B 99 383.
- [38] Suzuki T, Yoshida T, Kajino T and Otsuka T 2012 Phys. Rev. C 85 015802.
| Nucleus | T9(K) | (s-1)(Allowed) | (s-1)(U1F) | ||||||
|---|---|---|---|---|---|---|---|---|---|
| =103 | =106 | =109 | =1011 | =103 | =106 | =109 | =1011 | ||
| 0.01 | 3.22 | 3.11 | 1.00 | 1.00 | 7.79 | 7.74 | 1.00 | 1.00 | |
| 1 | 3.22 | 3.12 | 8.61 | 3.72 | 7.79 | 7.74 | 6.92 | 1.00 | |
| 78Zn | 5 | 3.22 | 3.15 | 2.65 | 1.22 | 7.79 | 7.74 | 1.18 | 1.30 |
| 10 | 8.47 | 8.47 | 2.45 | 1.49 | 1.11 | 1.11 | 1.30 | 3.80 | |
| 20 | 9.91 | 9.91 | 6.97 | 4.48 | 3.39 | 3.39 | 1.66 | 2.57 | |
| 30 | 2.01 | 2.01 | 1.73 | 3.06 | 4.89 | 4.89 | 3.77 | 2.66 | |
| 0.01 | 1.02 | 9.98 | 3.35 | 1.00 | 1.47 | 1.47 | 1.41 | 1.00 | |
| 1 | 1.02 | 9.99 | 6.38 | 5.51 | 1.47 | 1.47 | 2.62 | 2.69 | |
| 80Zn | 5 | 1.02 | 1.00 | 1.33 | 1.86 | 1.47 | 1.47 | 3.95 | 5.22 |
| 10 | 1.76 | 1.76 | 4.58 | 6.02 | 1.78 | 1.78 | 2.32 | 7.46 | |
| 20 | 1.92 | 1.92 | 1.36 | 1.16 | 7.13 | 7.13 | 3.56 | 5.79 | |
| 30 | 3.96 | 3.96 | 3.43 | 6.99 | 1.17 | 1.17 | 9.08 | 6.65 | |
| 0.01 | 4.58 | 4.53 | 1.67 | 1.00 | 1.21 | 1.21 | 1.26 | 1.00 | |
| 1 | 4.58 | 4.54 | 1.72 | 5.96 | 1.21 | 1.21 | 1.27 | 1.67 | |
| 82Zn | 5 | 4.58 | 4.54 | 3.32 | 7.78 | 1.21 | 1.21 | 1.79 | 1.54 |
| 10 | 7.78 | 7.76 | 2.54 | 9.82 | 1.53 | 1.53 | 4.19 | 2.70 | |
| 20 | 5.77 | 5.77 | 4.17 | 5.28 | 5.52 | 5.52 | 3.29 | 7.76 | |
| 30 | 1.07 | 1.07 | 9.29 | 2.32 | 8.89 | 8.89 | 7.23 | 6.83 | |
| Nucleus | T9(K) | (s-1)(Allowed) | (s-1)(U1F) | ||||||
|---|---|---|---|---|---|---|---|---|---|
| =103 | =106 | =109 | =1011 | =103 | =106 | =109 | =1011 | ||
| 0.01 | 1.62 | 1.60 | 2.21 | 1.00 | 6.84 | 6.84 | 1.92 | 1.00 | |
| 1 | 1.62 | 1.60 | 2.22 | 1.02 | 6.84 | 6.84 | 1.93 | 1.23 | |
| 86Ge | 5 | 1.63 | 1.63 | 2.85 | 5.75 | 6.87 | 6.87 | 2.19 | 1.05 |
| 10 | 4.16 | 4.16 | 1.79 | 2.87 | 1.07 | 1.07 | 4.57 | 6.76 | |
| 20 | 2.49 | 2.49 | 1.79 | 1.61 | 3.92 | 3.92 | 2.65 | 9.51 | |
| 30 | 3.94 | 3.94 | 3.41 | 7.06 | 5.66 | 5.66 | 4.79 | 5.96 | |
| 0.01 | 4.63 | 4.61 | 1.63 | 1.00 | 3.40 | 3.39 | 1.96 | 1.00 | |
| 1 | 4.63 | 4.62 | 1.64 | 3.29 | 3.40 | 3.39 | 1.96 | 2.42 | |
| 88Ge | 5 | 4.68 | 4.68 | 1.79 | 4.15 | 3.42 | 3.41 | 2.03 | 5.01 |
| 10 | 9.25 | 9.25 | 4.78 | 1.86 | 5.35 | 5.35 | 3.44 | 2.75 | |
| 20 | 3.89 | 3.89 | 2.88 | 3.45 | 1.84 | 1.84 | 1.44 | 1.12 | |
| 30 | 5.74 | 5.74 | 5.01 | 1.19 | 2.69 | 2.69 | 2.39 | 4.91 | |