Frequency Dependent Visco-elastic Properties of a Water Nanomeniscus: an AFM Study in Force Feedback Mode
Simon Carpentier1,2, Mario S Rodrigues3, Luca Costa4, Miguel V Vitorino3, Joël Chevrier1,2
1 Univ. Grenoble Alpes, F-38000 Grenoble, France
2 CNRS, Inst NEEL, F-38042 Grenoble, France
3 University of Lisboa, Falculty of Sciences, BioISI-Biosystems & Integrative Sciences Institute, Campo Grande, Lisboa, P-1749-016, Portugal
4 ESRF, The European Synchrotron, 71 Rue des Martyrs, 38000 Grenoble, France
*simon.carpentier@neel.cnrs.fr
Abstract
Recently, using an Atomic Force Microscope and a single cantilever excited at different frequencies it was shown that water nanomeniscus can exhibit a transition in mechanical responses when submitted to stimuli above few tens of kHz. The use of a single cantilever to explore phenomena at frequencies far from the cantilever resonance frequency is not a common and well-established strategy, and because water meniscus are ubiquitous in nature, we have also studied the water meniscus mechanical response, the stiffness (N/m) and the dissipation (kg/s), as a function of frequency by using cantilevers with different resonance frequencies. These results, based on classic dynamical AFM technics, confirm the anomalous mechanical response of water nanomeniscus when stimulated at frequencies high enough.
Introduction
Capillary condensation occurs as soon as a confined geometry is in a presence of a vapor phase thomson18724 ; barcons2012nanoscale ; Szoszkiewicz2005 ; riedo2002kinetics ; mugele2002capillarity . Capillary forces are among the most intense at nanoscale, playing an important role in the interaction between almost all surfaces. The importance of dynamical properties of water bridges becomes evident if one considers interacting surfaces with roughness scales down to few nanometers, since in that case, even at moderate speeds of m/s sliding will generate frequencies above 1 MHz. Between an Atomic Force Microscope (AFM) tip and a surface, this interaction, in a long time range, is attractive and remains at the thermodynamical equilibrium. It is described by the Young-Laplace equation, The nanomeniscus has to adapt its radii of curvature to keep the chemical potentials equal. We have highlighted that a nanomeniscus can appear as a stiff material (0.1GPa) at the nanoscale when excited at high frequency carpentier2015out . This was observed using an AFM mode called Force Feedback Microscopy (FFM) rodrigues2012atomic . We have argued that molecular exchange progressively loses efficiency, when the frequency of the tip oscillation is increased and thus the nanomeniscus is no longer at the thermodynamical equilibrium. The capillary bridge is then led to acquire a constant volume during oscillations at high frequencies. In addition to the constant volume picture, the ability of the bridge to adapt to a new shape looses efficiency resulting in a progressive locking of the contact line resulting in changes of the mean curvature radius of the capillary bridge This appears as a transition between a negative stiffness (N/m) in the long time regime to positive stiffness at high frequency. The estimated characteristic time is s.
Our work published in Ref carpentier2015out was a first approach to this question based on a non-conventional use of AFM. It is important to stress that even though the methodology used before is sound it is not well established among the AFM community. Here we want to show that the key results reported in our previous work, about dynamical properties of water nanobridge, can be, though only partially, obtained using well-known AFM strategies such as Amplitude Modulation AFM (AM-AFM). These classical AFM measurements must, however, be combined with Force Feedback Mode to ensure tip stability. Because we have used a tip oscillation with amplitude smaller or equal to 1nm, a linear analysis of measurements of amplitude and phase can be done to to extract the dynamical properties of the water nanobridge. Compared to our work in Ref carpentier2015out , what we report here is a limited approach as it requires comparison of data from different experiments and obtained using different probes. The results here reported confirm previous measurements and further ascertain the associated conclusions.
We have probed dynamical properties of water nanomeniscus at two different frequencies 79kHz and 350kHz using two different AFM levers. During all these experiments, a force feedback ensures stability of the tip position. This leads to a direct determination of the static force applied by the nanobridge onto the tip, and prevents jump to contact (i.e. there is no movement of the tip when the water nanomeniscus suddenly forms). A small oscillation is added at a frequency near the resonance frequency, which enables us to measure the phase and amplitude as a function of distance. Through a linear transformation of amplitude and phase, the nano-meniscus stiffness and the associated dissipation are obtained. With this method, we obtain a full characterization of the mediated interaction by the water nanobridge at these two frequencies.
Materials and Methods
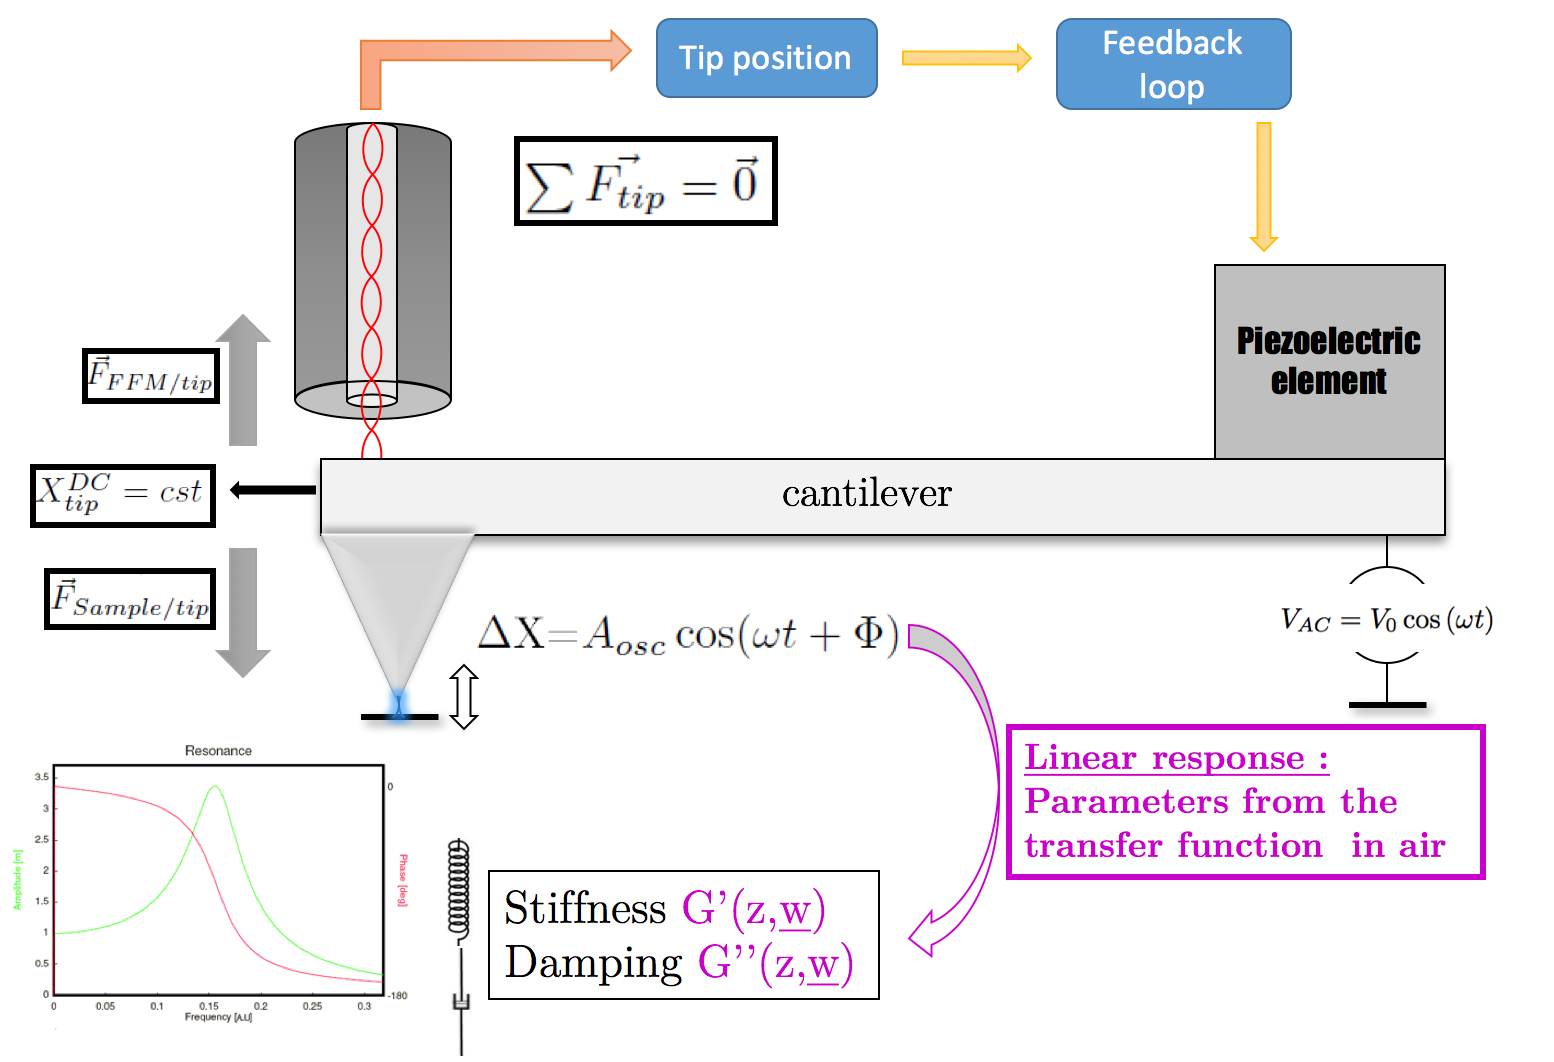
Throughout all presented measurements, the static force applied by the capillary bridge to the tip is canceled in real time by a feedback force. To apply this force in real time, a piezoelement changes the DC position of the clamped end part of the microlever. The displacement needed to maintain the tip position constant multiplied by the stiffness gives access to the static capillary force acting on the tip, for details on experimental setup see Refs rodrigues2014system ; rodrigues2012atomic ; carpentier2015proximity ; vitorino2014force ; costa2013comparison . The tip oscillation is detected by an optical fiber positioned close to the cantilever backside, as depicted in Fig 1.
The sample is a flat piece of silicon wafer with its native oxide. Two different levers were used, both with silicon tips: cantilever 1 (Multi75Al) with a nominal stiffness of 2.7 N/m, a resonance frequency of 79kHz and a quality factor in air of 127 and cantilever 2 (Tap300Al) with a nominal stiffness of 40 N/m, a resonance frequency of 349kHz and a quality factor of 200. Both cantilevers were purchased from BudgetSensors.
The experiment is performed at room conditions. The relative humidity was 40 %. All measurements are done during tip retraction in presence of a water nanobridge until it ruptures. The mean curvature radius of the bridge can be estimated by the distance at which the bridge forms. In these measurements it is typically 10nm.
The capillary bridge stiffness and dissipation can be obtained through the measurement of the resonance frequency and the factor. Since, at each distance, both the amplitude and phase can be measured as a function of frequency, fitting the amplitude and phase curves with an harmonic oscillator model, results in two sets of the pair {, }. Each set is obtained using Eq 1 and Eq 2 respectively.
| (1) |
| (2) |
From each of these sets, it is possible to extract the interaction stiffness and damping . The capillary bridge dynamics is separated from the cantilever dynamics trough Eq 3 and Eq 4.
| (3) |
| (4) |
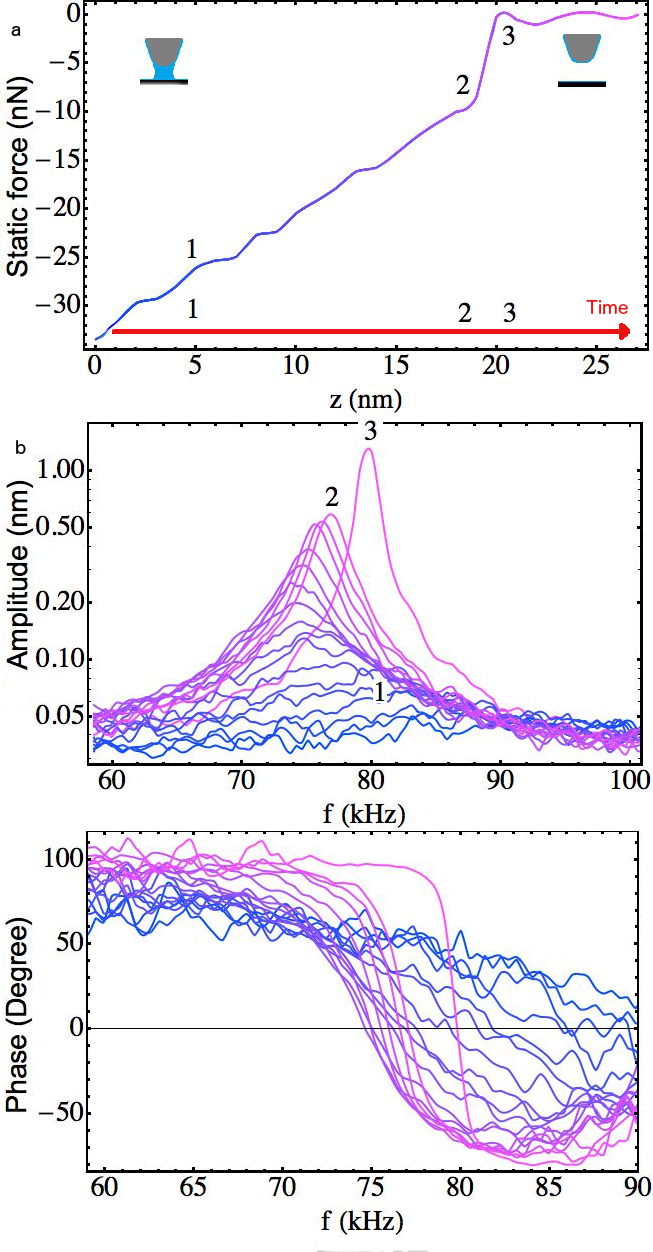
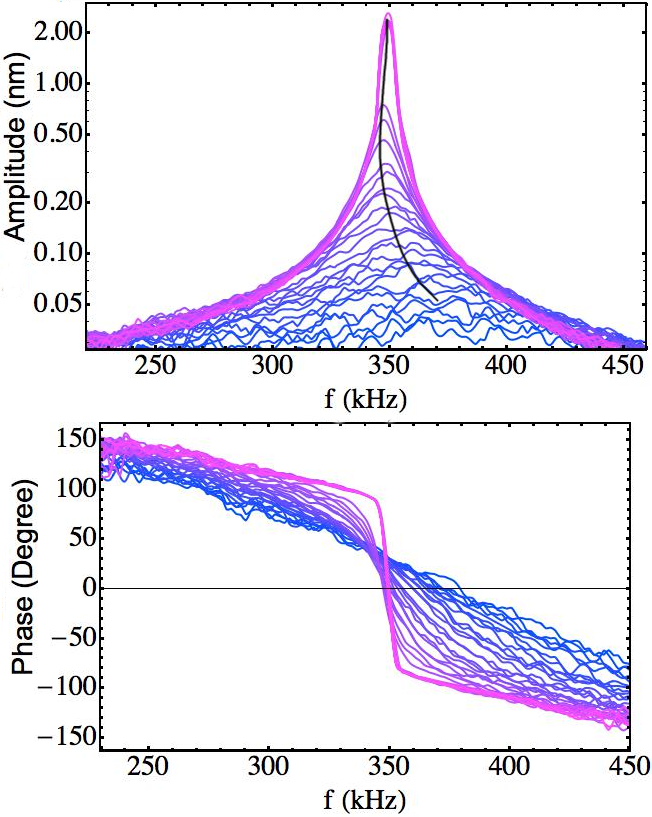
The amplitude and phase are recorded using a lock-in amplifier, for each z-position for cantilever 1 (see Figure.2) and for cantilever 2 (see Figure.3). In this measurement scheme, the system transfer function takes time to record because the excitation frequency must be sweep over a given frequency range, which takes about one minute. On this time scale, it may have a significant thermal drift of up to 2 nm which results in a slightly distorted z-axis. The knowledge of the static force curve (Fig.2a) gives access to the tip-sample distance as the mean tip position is kept constant during all of the experiment.
and can be obtained a third time by setting the frequency constant, and then measuring the changes of phase and amplitude as a function of distance. This is equivalent to a force approach curve in amplitude modulation mode hansma1994tapping ; san2001tip ; erlandsson1998force . In this linear regime, and are separated from lever dynamics by using Eq 5 and Eq 6 (details in Ref rodrigues2014system ):
| (5) |
| (6) |
Where is the normalized amplitude of oscillation, it is equal to 1 far from the sample and is the phase. These two quantities are recorded at the same frequency during the whole experiment, in this case this is the free resonance frequency . Parameters and are obtained using the lever properties in the experimental environment (see more details in Ref.rodrigues2014system ):
| (7) |
| (8) |
Using the transfer function of the system in air far from the sample, we extract the resonance frequency and the quality factor . The effective mass of the system is deduced from the knowledge of the resonance frequency and the stiffness , which is determined by the thermal fluctuation methodbutt1995calculation . The damping coefficient is obtained through the quality factor . The knowledge of these three quantities, , and , is the only needed.
Results and Discussion
Fig 2b presents the amplitude and phase response when the tip is stopped during retract in presence of a capillary bridge. We can associate each spectrum to the static interaction, from blue to pink (see corresponding numbering in the legend of Fig 2). The amplitude and phase of the Fig.2b, which are the response of the system lever plus capillary bridge at 79kHz, clearly show that the resonant frequency is shifting towards lower frequencies meaning that an attractive force gradient is exerted on the tip. The resonance peak broadening and the flattening of the phase are representative of an increasing dissipation.
The results in Fig.2b contrast with those of the Fig 3 obtained using a higher frequency lever, with first eigenmode at 350kHz. For this second lever, we observe that the resonance frequency is shifting towards higher frequencies. This is the signature of repulsive force gradient.
As explained in methods, the interaction stiffness and the dissipation have been determined three times, one from the amplitude curve (green Eqs 1, 3 and 4), a second time from the phase curve (red Eqs 2, 3 and 4) and a third time from the amplitude and phase changes at a fixed frequency (purple, Eqs 5 trough 8), presented in Figs 4 and 5. A first observation, is that the three methods give the same results.
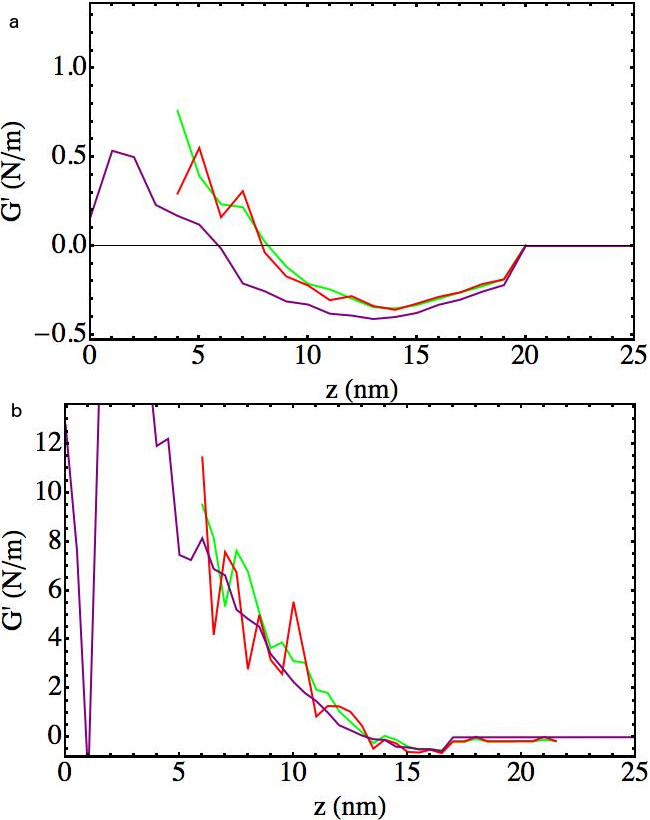
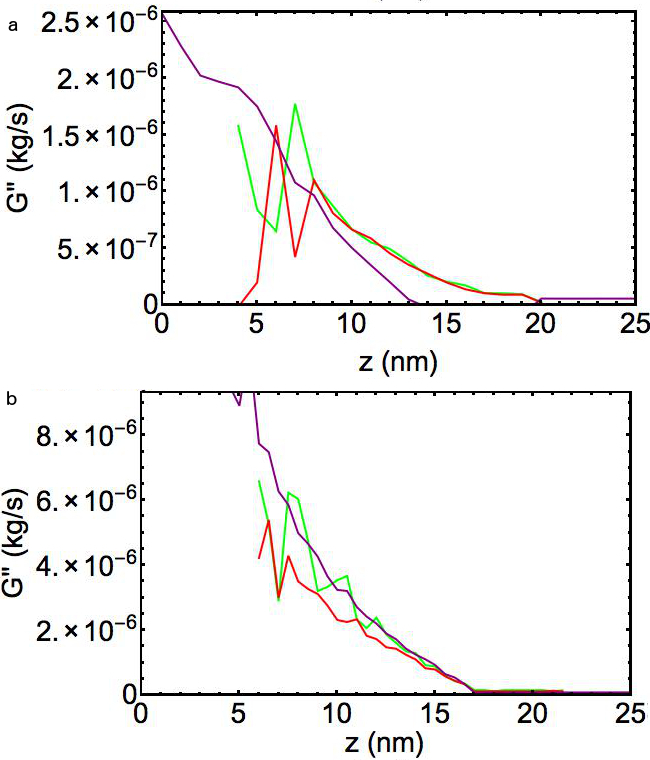
Fig.4a shows that the stiffness is negative about -0.5 N/m when the frequency is about 79kHz. Fig.4b presents the stiffness measured with the second lever at 350kHz using the three methods. It shows a strong repulsive interaction, up to 10N/m. The dissipation for 350kHz and 79kHz is presented respectively in Fig.5a and b. It exhibits similar values for the two frequencies.
In contrast with the measurement in our previous paper using a single lever, here the experimental conditions cannot be the same when using different levers. We however show in this paper that the two viscoelastic regimes found in our previous article carpentier2015out , where another method is used, are corroborated using detection methods based on resonance shift detection as classically done in AFM.
For low frequency, the nanomeniscus is attractive whereas at high frequency, the nanomeniscus force gradient is repulsive. Direct contact between the tip and the sample can not be an explanation of this strong repulsive stiffness. As we simultaneously measure the static force and the dynamic response of the interaction (see Fig.2a), we precisely know for each spectrum the tip-sample distance and the static force acting on the tip. This strong effect is only due to the capillary bridge behavior. At lower frequencies the bridge remains closer to equilibrium at constant pressure whereas at higher frequencies the contact line is locked and the volume of the meniscus remains constant instead valsamis2013vertical .
Fig.5b, which presents the dissipation when the system is submitted to a repulsive interaction at 350kHz, enforces this conclusion by showing a similar dissipation than the one in our previous article, about 10-6kg/s. In Fig.4a for the lever with the first eigenmode frequency at 79kHz, the interaction stiffness is again found negative using the three methods. However, the measured stiffness is higher than the calculated gradient from the static force, about -1N/m. This could be explained by the distorted z-axis due to the thermal drift or by the fact that the molecule exchange process has already decreased. Fig.5a presents the dissipation for the lever at 79kHz. It is about 10-6kg/s, which corresponds to the same order of magnitude for the dissipation presented in our previous paper when the contact line is partially locked at high frequency carpentier2015out and in Fig.5b. Using results from our previous paper it appears to us that the nanobridge behavior at 79kHz is no longer in thermodynamical equilibrium.
Conclusion
In conclusion, using classical AFM modes, i.e. frequency shift and amplitude and phase changes at constant frequency of excitation, we have again found a transition in the visco-elastic properties of a water nanobridge between thermodynamical equilibrium and out of equilibrium from attractive to repulsive behavior respectively. In this out of equilibrium regime, we interpret the present results using a constant volume nanobridge (no molecular exchange between vapor and nanobridge) and a fixed contact line carpentier2015out .
This study has been made possible using low spring constant cantilever and the FFM scheme: a feedback force applied to the tip in real time avoids the “jump to contact” due to the nucleation of the bridge. The results obtained are fully consistent with the ones presented before. The key advantage of the method used in our previous paper is that it allows to work at any frequency which enables us to use a single lever when changing the excitation frequency from low to high frequencies. Here, working only at lever resonance and in close proximity to the resonance frequency, we have not been able to reach thermodynamical equilibrium as shown in the previous paper.
Acknowledgments
Mario S. Rodrigues and Miguel V. Vitorino acknowledge financial support from Fundação para a Ciência e Tecnologia, grants SFRH/BPD/69201/2010 and PD/BD/105975/2014 respectively. We would like to acknowledge Jean-Francois Motte who gave precious help and advices on this experiment.
References
- (1) William Thomson. 4. on the equilibrium of vapour at a curved surface of liquid. Proceedings of the Royal Society of Edinburgh, 7:63–68, 1872.
- (2) Victor Barcons, Albert Verdaguer, Josep Font, Matteo Chiesa, and Sergio Santos. Nanoscale capillary interactions in dynamic atomic force microscopy. The Journal of Physical Chemistry C, 116(14):7757–7766, 2012.
- (3) Robert Szoszkiewicz and Elisa Riedo. Nucleation Time of Nanoscale Water Bridges. Physical Review Letters, 95(13):135502, September 2005.
- (4) Elisa Riedo, Francis Lévy, and Harald Brune. Kinetics of capillary condensation in nanoscopic sliding friction. Physical review letters, 88(18):185505, 2002.
- (5) F Mugele, T Becker, R Nikopoulos, M Kohonen, and S Herminghaus. Capillarity at the nanoscale: an afm view. Journal of adhesion science and technology, 16(7):951–964, 2002.
- (6) Simon Carpentier, Mario S Rodrigues, Luca Costa, Miguel V Vitorino, Elisabeth Charlaix, and Joel Chevrier. Out of equilibrium gigapa young modulus of water nanobridge probed by force feedback microscopy. Applied Physics Letters, 107:204101, 2015.
- (7) Mario S Rodrigues, Luca Costa, Joël Chevrier, and Fabio Comin. Why do atomic force microscopy force curves still exhibit jump to contact? Applied Physics Letters, 101(20):203105, 2012.
- (8) Mario S Rodrigues, Luca Costa, Joël Chevrier, and Fabio Comin. System analysis of force feedback microscopy. Journal of Applied Physics, 115(5):054309, 2014.
- (9) Simon Carpentier, Mario S Rodrigues, Elisabeth Charlaix, and Joel Chevrier. Proximity effect on hydrodynamic interaction between a sphere and a plane measured by force feedback microscopy at different frequencies. Applied Physics Letters, 107:044101, 2015.
- (10) Miguel V Vitorino, Simon , Luca Costa, and Mario S Rodrigues. Force feedback microscopy based on an optical beam deflection scheme. Applied Physics Letters, 105(1):013106, 2014.
- (11) Luca Costa, Mario S Rodrigues, Simon Carpentier, Pieter Jan van Zwol, Joël Chevrier, and Fabio Comin. Comparison between atomic force microscopy and force feedback microscopy static force curves. arXiv preprint arXiv:1306.2775, 2013.
- (12) Anil Gannepalli, Abu Sebastian, Jason Cleveland, and Murti Salapaka. Thermally driven non-contact atomic force microscopy. Applied Physics Letters, 87(11):111901, 2005.
- (13) Franz J Giessibl and Hartmut Bielefeldt. Physical interpretation of frequency-modulation atomic force microscopy. Physical Review B, 61(15):9968, 2000.
- (14) John E Sader and Suzanne P Jarvis. Coupling of conservative and dissipative forces in frequency-modulation atomic force microscopy. Physical Review B, 74(19):195424, 2006.
- (15) 4PK Hansma, JP Cleveland, M Radmacher, DA Walters, PE Hillner, M Bezanilla, M Fritz, D Vie, HG Hansma, CB Prater, et al. Tapping mode atomic force microscopy in liquids. Applied Physics Letters, 64(13):1738–1740, 1994.
- (16) Alvaro San Paulo and Ricardo García. Tip-surface forces, amplitude, and energy dissipation in amplitude-modulation (tapping mode) force microscopy. Physical Review B, 64(19):193411, 2001.
- (17) R Erlandsson and L Olsson. Force interaction in low-amplitude ac-mode atomic force microscopy:. cantilever simulations and comparison with data from si (111) 7 7. Applied Physics A: Materials Science & Processing, 66:S879–S883, 1998.
- (18) H-J Butt and Manfred Jaschke. Calculation of thermal noise in atomic force microscopy. Nanotechnology, 6(1):1, 1995.
- (19) Valsamis, J-B and Mastrangeli, Massimo and Lambert, Pierre. Vertical excitation of axisymmetric liquid bridges European Journal of Mechanics-B/Fluids, 38:47–57, 2013