The Matryoshka Disk: Keck/NIRC2 Discovery of a Solar System-Scale, Radially Segregated Residual Protoplanetary Disk Around HD 141569A
Abstract
Using Keck/NIRC2 (3.78 ) data, we report the direct imaging discovery of a scattered light-resolved, solar system-scale residual protoplanetary disk around the young A-type star HD 141569A, interior to and concentric with the two ring-like structures at wider separations. The disk is resolved down to 025 and appears as an arc-like rim with attached hook-like features. It is located at an angular separation intermediate between that of warm CO gas identified from spatially-resolved mid-infrared spectroscopy and diffuse dust emission recently discovered with the Hubble Space Telescope. The inner disk has a radius of 39 AU, a position angle consistent with north-up, an inclination of 56o, and has a center offset from the star. Forward-modeling of the disk favors a thick torus-like emission sharply truncated at separations beyond the torus’ photocenter and heavily depleted at smaller separations. In particular, the best-fit density power law for the dust suggests that the inner disk dust and gas (as probed by CO) are radially segregated, a feature consistent with the dust trapping mechanism inferred from observations of “canonical” transitional disks. However, the inner disk component may instead be explained by radiation pressure-induced migration in optically-thin conditions, in contrast to the two stellar companion/planet-influenced ring-like structures at wider separations. HD 141569A’s circumstellar environment — with three nested, gapped, concentric dust populations — is an excellent laboratory for understanding the relationship between planet formation and the evolution of both dust grains and disk architecture.
Subject headings:
planetary systems, stars: early-type, stars: individual: HD 141569A1. Introduction
Gas-rich, optically thick and luminous protoplanetary disks surrounding young stars typically dissipate in 5–10 by a combination of viscous draining, photoevaporative clearing and/or giant planet formation (Williams and Cieza, 2011). At older ages, optically-thin gas-poor debris disks whose dust is sustained by planetesimal collisions comprise most of the disk population (Kenyon and Bromley, 2008; Wyatt, 2008). Directly imaging systems covering the protoplanetary-to-debris disk transition reveals a diverse set of disks architectures, probes disk dispersal mechanisms, and identifies evidence for infant jovian planets (e.g. Grady et al., 2013; Kraus and Ireland, 2012; Currie et al., 2015b).
The circumstellar environment around the nearby ( = 116 van Leeuwen, 2007) A-type star HD 141569A is a particularly good laboratory for studying the last moments of this transition phase. The system’s nominal age (5 3 ; Weinberger et al., 2000; Aarnio et al., 2008) is comparable to the characteristic protoplanetary disk evolution timescale (Cloutier et al., 2014). While HD 141569 A retains a significant reservoir of gas ( 0.2–0.5 ; Zuckerman et al., 1995; Thi et al., 2014), its infrared emission is optically thin and its fractional luminosity is little higher than that of luminous debris disk-bearing stars like HR 4796A. Near-infrared (IR) to optical scattered-light imaging reveals two nested, bright rings of dust at 250 and 400 exhibiting pericenter offsets and spiral structure driven by the primary’s M dwarf companions and perhaps unseen newly-formed planets (Weinberger et al., 1999; Mouillet et al., 2001; Clampin et al., 2003; Wyatt, 2005; Janson et al., 2013; Biller et al., 2015; Mazoyer et al., 2016; Konishi et al., 2016).
Additionally, HD 141569A includes warm circumstellar material: CO gas emission cleared out to 11 AU and marginally resolved warm thermal dust emission (10–20 ) potentially depleted interior to 30 AU (Fisher et al., 2000; Marsh et al., 2002; Goto et al., 2006). Recently, Konishi et al. (2016) discovered an additional diffuse optical scattered-light component at 40–100 . Deeper high-contrast scattered-light imaging may clarify how HD 141569A’s circumstellar environment is being cleared of residual protoplanetary material at smaller, solar system-like scales.
In this Letter, we present the discovery of a bright, solar system-scale residual protoplanetary disk around HD 141569A using Keck/NIRC2 high-contrast imaging 111We note an independent detection of this inner disk from D. Mawet (Mawet et al. 2016, in prep.). The scattered light-detected dust disk lies interior to the diffuse emission recently discovered by Konishi et al. (2016) but is peaked at radii exterior to the CO gas resolved by Goto et al. (2006). The dust disk is likely heavily evacuated at the CO gas’s inner radius, revealing evidence for dust/gas segregation.
2. Observations and Data Reduction
We imaged HD 141569A on 8 June 2015 with the NIRC2 camera on the Keck II telescope on Maunakea in the filter ( = 3.778 ) using the narrow camera (9.952 mas/pixel; Yelda et al., 2010) and the ”large hex” pupil plane mask in angular differential imaging mode (Marois et al., 2006), and in a 3-point dither pattern (Program N134N2). Our science frames consisted of 74 50-second exposures ( = 0.25 , 200 coadds) for a total integration time of 3700 , covering a field rotation of 45.9o. Conditions were photometric with slightly above-average quality seeing (04–05 in the optical). We obtained shorter, unsaturated images bracketing our science sequence for flux calibration.
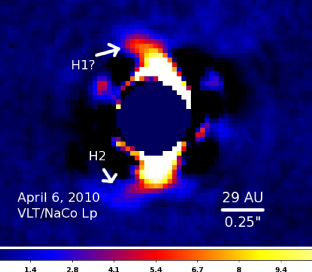
Additionally, we retrieved archival VLT/NaCo imaging of HD 141569A taken on 6 April 2010. The data were taken in a four-point dither pattern achieving 70.4o of field rotation. Each of the 292 exposures consists of 150 coadded frames of 0.2 each for a total integration time of 8760 . The ESO archival nightly log implies somewhat poorer optical seeing conditions than our Keck data (065–10).
2.1. Image Processing
For basic processing, we utilized the pipeline developed for and followed steps outlined in Currie et al. (2011, 2014a), sky-subtracting a given frame using the nearest (in time) available sky frames and correcting each image for bad pixels. For the NIRC2 data, we applied a linearity correction. We improved PSF stability of the NaCo data by realigning each coadd within the cube, removing frames with core-to-halo brightness ratios R lower than max(R) 3-, and collapsing the cube using a robust mean with a 3- outlier rejection (see Currie et al., 2014a). As in Currie et al. (2011), we registered each image to a common center using a cross-correlation approach.
We performed PSF subtraction using the A-LOCI pipeline (Currie et al., 2014c), an extension and modification of the original locally-optimized combination of images algorithm (Lafrenière et al., 2007). We use a moving pixel mask (Currie et al., 2012) to reduce and normalize throughput, as well as a singular value decomposition (SVD) cutoff (Marois et al., 2010; Currie et al., 2014c), and speckle filtering/frame selection to reduce errors propagating through the matrix inversion and prevent the solutions from being overdetermined. We adopted conservative settings proven successful for detecting bright off-axis signal with only weak algorithm self-subtraction (Currie et al., 2015a, b)– i.e. a large rotation gap equal to the PSF core width ( = 1), a high SVD cutoff ( = 10-3), and a large optimization area from which we determine the LOCI coefficients ( = 1000 PSF footprints).
3. Detection of the HD 141569A Residual Inner Disk
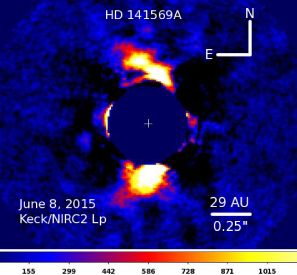
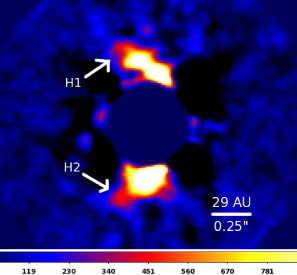
Figure 1 shows the reduced, combined Keck/NIRC2 image with a nominal image stretch (top-left), a higher dynamic range (top-right), and box-car smoothed to better reveal low intensity extended emission (lower-left) along with the VLT/NaCo image (lower-right). The Keck image identifies a bright torus-shaped emission, largely on the west side, between 025 and 055: a feature recovered by the NaCo data. Our data do not recover the nested debris disk-like rings nor the extended halo (Konishi et al., 2016)222The high sky background likely precludes detecting the low surface brightness outer two rings. We do not detect the inner disk in existing conventional AO near-IR data because of their low Strehl ratios.. However, the newly-identified inner disk appears to have a similar north-south orientation and inclination.
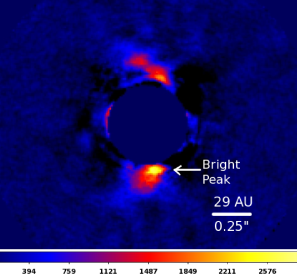
The data reveal a bright peak at a separation of 028 (32 AU) on the south side (top-right panel) that appears point-source-like with a brightness (subtracted from the surrounding disk) comparable to that expected for a 5 old, 5–6 planet (Baraffe et al., 2003). However, dust scattering properties may also explain this peak (see §4). “Hook-like” features extend from both disk ansae, and are especially visible on the south side in the smoothed image, somewhat similar to the thermal IR-bright arm in HD 100546’s disk (Currie et al., 2014c).
To conservatively define the signal-to-noise ratio per resolution element (SNRE), we replace each pixel with the sum of values enclosed by a FWHM-wide aperture, estimate the radial noise profile of this summed image and divide the summed image by the noise profile. This procedure yields SNRE 4–6 along the visible trace of the disk in the NIRC2 image between 027 and 055 and slightly lower SNRE at these separations in the NaCo image.
From inspection, the disk signal and its self-subtraction footprints, not residual speckles, dominate the pixels at 027–055, thereby biasing the estimate of the noise profile and yielding an underestimated disk SNRE (see also Currie et al., 2015b; Thalmann et al., 2014). Masking a rectangular “evaluation region” with dimensions 054 by 108 centered on the star and defining the radial noise profile from pixels outside this region, we derive a disk SNRE in the Keck image to 8–10 at most separations. The “hook-like” (spiral?) features are likewise statistically significant (SNRE 3–5). We nominally adopt the former (hereafter “conservative” SNRE) estimate in our disk geometry analysis (§4.1) and use the latter (hereafter “optimistic” SNRE) as our starting point for our disk scattered light forward-modeling (§4.2), although these choices does not consequentially affect our results.
4. Analysis
To derive the HD 141569A inner disk geometry, we follow the same approach used for analyzing HD 115600’s disk (Currie et al., 2015a). First, we derive the disk’s basic geometry from ellipse fitting. Second, we use forward-modeling to fine-tune these properties and calculate second-order properties of the disk (e.g. scattering function), assuming that we are seeing optically-thin, scattered light emission. We focus our analysis on the higher-quality Keck/NIRC2 data.
4.1. Geometry
From the IDL mpfitellipse package we first define a trace of the disk, where the pixels are weighted by their conservative SNRE. Second, we constructed a grid of ellipse parameters around the best-fit set determined by mpfitellipse, calculating a value using the “maximum merit” procedure (Thalmann et al., 2011). We repeat this step using different ranges in radii and different cutoffs in SNRE for the disk trace (e.g. SNR 3, 5; = 025–05, 025–055) to define best-estimated values and associated uncertainties.
The disk geometry generally agrees well with the most precise estimates for the outer disks’ geometry (Mazoyer et al., 2016; Konishi et al., 2016). We derive a best-fit position angle of PA = -1.2∘ 2.4∘. While we derive an inclination of = 56∘ 4∘ considering the mean value of all estimates, a large subset of solutions center around 60o. The disk semimajor/minor axes are 0340 0020 ( 39.1 AU 2.2 AU) and 0189 0010 (21.9 0.2 AU), respectively. The projected disk center is offset from the star is x,y = -0044 0016 (6.1 1.3 AU), 0014 0010 (1.6 1.1 AU).
4.2. Disk Forward Modeling
To infer additional disk properties, we generate a grid of synthetic scattered light images using GRaTeR (Augereau et al., 1999) and forward-model these synthetic disks through A-LOCI to compare the processed model disk image with the real disk image (Esposito et al., 2014).
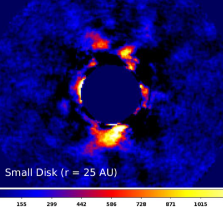
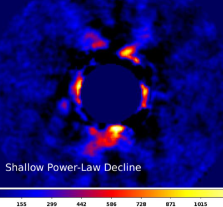
Table 1 summarizes the model parameter space. For simplicity, we adopt the position angle determined from our ellipse modeling (-1.2∘). We consider a nominal inclination of 56o and an inclination of 60o favored by a subset of our ellipse-fitting results. We tuned our parameter search to focus on addressing specific questions about the HD 141569A morphology. First, to assess whether the disk (made visible by small, scattering dust grains) coincides with the gas distribution or is radially segregated, we consider photocenters of 36.9, 39.1, and 41.3 AU (consistent with our ellipse modeling) and a photocenter at 25 AU: roughly the separation corresponding to the half-maximum of the CO gas (Goto et al., 2006). Second, we assess whether the emission originates from a sharp debris ring with a steep drop in density away from the disk photocenter (, =10, -10), the visible edge of a continuous distribution that (when annealed by processing) only “appears” to be truncated ( = 1), or a dust torus (not a sharp ring) with an intermediate power law decay at separations interior to the photocenter ( = 2.5–5) (see Augereau et al. 1999 for definitions). We consider power law decays exterior to the disk photocenter of = to , varying, Henyey-Greenstein scattering parameters (0–0.2), the disk offsets from the star in both x and y, and disk scale heights ( = 3–5 AU).
To identify the best-fitting disk models, we closely follow the methods from Thalmann et al. (2014). Briefly, we bin down the Keck image, the model image, and the noise profile to the Keck/NIRC2 spatial resolution to compare the data and model at effectively independent data points and compute from the residuals of the binned image over the angular separation where the disk detection is significant and negligibly contaminated by residual speckles ( 027–055). As noted in §3, determining a radial noise profile (and thus a robust SNRE for the disk) is extremely difficult due to biasing from the disk and self-subtraction footprints, impeding our ability to quantify a robust estimate of the absolute goodness of fit for the models. Thus, we iteratively rescale the radial noise profile from the “optimistic” SNR map such that the best-fitting model has = 1 and focus simply on the family of best-fitting models: i.e. those fulfilling + (Thalmann et al., 2013), which for our case implies 1.124.
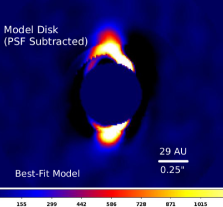
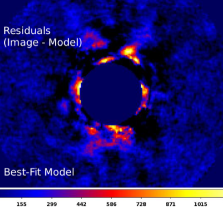
The best-fit model accurately reproduces the disk morphology (Figure 2) and, when subtracted from the Keck image, nulls its signal, including the point source-like peak, but leaves the hook-like features largely intact (SNRE 3.5–4.5 in the residual image). The integrated signal of the best-fit model is 20 mJy. Its surface brightness along the major axis (i.e. the model shown in the top-left panel prior to signal loss from PSF subtraction) ranges from 7.5 mag arcsec-2 at the photocenter (39 AU) to 10 mag arcsec-2 at the widest separations where it is detected robustly ( 055).
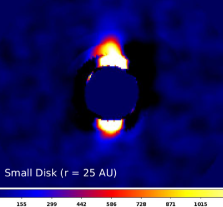
We can decisively rule out some model phase space and identify key trends. First, models with a photocenter of = 25 AU (or, by extension, at smaller separations) are inconsistent with the data, yielding especially high residuals on the south side (Figure 2, middle panels). Models with = -2.5 are ruled out: the disk requires a sharp density cutoff exterior to the photocenter. The dust is also likely (near-)neutral scattering.
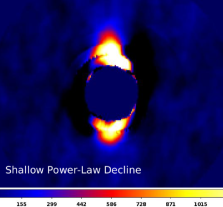
While our analysis does not formally preclude models with weak depletion interior to the photocenter ( = 1), even the best-fit of these models (right panels) is marginally acceptable, yielding clearly higher residuals. The distribution for = 2.5 – 5 is systematically skewed towards smaller values, indicating a better fit: models with these power laws dominate the family of best-fitting solutions. Thus, our disk modeling favors a torus of neutral scattering dust at 36–41 with sharp truncation at larger disk radii and significant depletion at smaller radii. This material largely lies outside the CO gas concentrated at 11–25 .
4.3. Limits on Planets
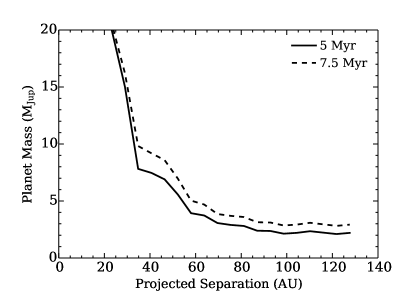
To place limits on the presence of unseen planets that may be perturbing the inner disk, we reprocess the data using aggressive A-LOCI settings (e.g. = 0.5). We determine the throughput loss-corrected radial noise profile (Lafrenière et al., 2007; Marois et al., 2008). The Baraffe et al. (2003) hot-start evolutionary models allowed us to map between brightness and planet mass.
While previous analysis suggests that HD 141569 A is 5 3 Myr old, we reinvestigated its age, comparing the HR diagram positions of the primary to Dotter et al. (2008) models. HD 141569 A appears too low in luminosity to be consistent with a 5 Myr age. It’s placement on an HR diagram implies an age between 6 Myr and the zero-age main sequence (starting at 10 Myr). For our planet mass limits, we consider the nominal age and an older, revised age of 7.5 Myr333Conversely, the placement of the M star companions on the HR diagram imply a younger age. The discrepancies of pre-main sequence tracks at high vs. low masses is beyond the scope of this paper..
At = 025–05 (29–45 AU), the azimuthally-averaged sensitivity limit is roughly 7.5–10 (Figure 3), shallow since the disk’s bright signal substantially drives up the residual noise estimate. Exterior to the inner disk, our sensitivity curve excludes planets with masses of 2–3.5 (3–4 ) at projected separations of 60–120 AU assuming an age of 5 (7.5) . If the planet luminosity evolution is better described by a cold start model, our mass limits are significantly poorer.
5. Discussion
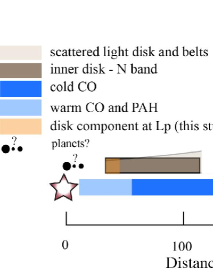
Figure 4 depicts an updated schematic of the complex HD 141569A circumstellar environment. The system now includes three scattered light-resolved, concentric rings/torii of material spanning between 25 and 500 , a halo of small dust emission located between the innermost and middle ring, and significant localized structure in the middle and outermost rings plus multiple (candidate) spirals/hooks in all three rings indicative of perturbations by stellar/substellar companions (this work, Konishi et al., 2016; Mazoyer et al., 2016). Interspersed between these dust components are multiple gas reservoirs (Goto et al., 2006; Thi et al., 2014).
Furthermore, the inner disk dust and gas are likely not well mixed: dust is concentrated in a torus with a larger radius than the CO gas and is likely heavily depleted at smaller separations, implying that its dust cavity is larger than the gas cavity. Recent analysis of ALMA data by van der Marel et al. (2015, 2016) likewise provides strong evidence for radial segregation of warm dust and gas in transitional disks, with dust cavities up to 3 times larger and an order of magnitude more depleted than gas cavities. However, the disks they analyzed are generally massive, optically thick in the mid-infrared, and vigorously accreting. HD 141569 A has weak/negligible accretion, is optically thin in the mid-infrared (Marsh et al., 2002), and low mass.
While the heavily depleted dust cavities in canonical transitional disks are consistent with the planet trapping scenario (Pinilla et al., 2012; van der Marel et al., 2013, 2016), HD 141569 A’s radially-segregated disk may be shaped by other mechanisms. For instance, the dimensionless Stokes parameter in the Epstein drag regime, appropriate for small grains, St (c.f. Weidenschilling, 1977; Birnstiel et al., 2010), is 1 for 1–100 -sized grains in typical, optically thick protoplanetary disk conditions: such dust is well mixed with the gas. However, as the gas density drops, smaller grains (more easily probed by scattered light observations) decouple from the gas. If the 4-20 dust particles, accessible by our observations, are indeed (marginally) decoupled from the gas (St 0.1-1), the gas surface density should be of the order 0.004 g cm-2, assuming porous grains (1.25 g cm-3). This is consistent with the gas number density found by Thi et al. (2014) (10-21 cm-2). Under the influence of radiation pressure, dust grains of these sizes in optically-thin disks can be pushed outwards and form ring/torus-like structures (Takeuchi and Artymowicz, 2001).
The morphology of the newly-discovered inner disk as probed by larger grains could be more striking. Since longer wavelength observations better probe large grains, the disk’s presence could be recovered and its structure clarified by high spatial resolution mm interferometry. Its measured submillimeter dust continuum emission ( 8.2 ; Flaherty et al., 2016) is easily within detectability with ALMA; mid-IR interferometry with VLTI/Matisse may also resolve its emission at high resolution.
References
- Aarnio et al. (2008) Aarnio, A., Weinberger, A. J., Stassun, K., et al., 2008, AJ, 136, 2483
- Augereau et al. (1999) Augereau, J. C., Lagrange, A.-M., Mouillet, D., et al. 1999, A&A, 348, 557
- Baraffe et al. (2003) Baraffe, I., Chabrier, G., Barman, T. S., et al., 2003, A&A, 402, 701
- Biller et al. (2015) Biller, B., Liu, M. C., Rice, K., et al., 2015, MNRAS, 450, 4446
- Birnstiel et al. (2010) Birnstiel, T., Dullemond, C., Brauer, F., 2001, A&A, 513, 79
- Clampin et al. (2003) Clampin, M., Krist, J. E., Ardila, D. R., et al., 2003, AJ, 126, 385
- Cloutier et al. (2014) Cloutier, R., Currie, T., Rieke, G. H., et al., 2014, ApJ, 796, 127
- Currie et al. (2011) Currie, T., Burrows, A., Itoh, Y., et al., 2011, ApJ, 729, 128
- Currie et al. (2012) Currie, T., Debes, J., Rodigas, T., et al., 2012, ApJ, 760, L32
- Currie et al. (2014a) Currie, T., Daemgen, S., Debes, J., et al., 2014a, ApJ, 780, L30
- Currie et al. (2014b) Currie, T., Burrows, A., Girard, J., et al., 2014b, ApJ, 795, 133
- Currie et al. (2014c) Currie, T., Muto, T., Kudo, T., et al., 2014c, ApJ, 796, L30
- Currie et al. (2015a) Currie, T., Lisse, C. M., Kuchner, M. J., et al., 2015a, ApJ, 807, L7
- Currie et al. (2015b) Currie, T., Cloutier, R., Brittain, S., et al., 2015b, ApJ, 814, L27
- Dotter et al. (2008) Dotter, A., Chaboyer, B., Jevremovic, D., et al., 2008, ApJS, 178, 89
- Esposito et al. (2014) Esposito, T., Fitzgerald, M., Graham, J., Kalas, P., 2014, ApJ, 780, 25
- Fisher et al. (2000) Fisher, R. S., Telesco, C. M., Pina, R. K., et al., 2000, ApJ, 523, L141
- Goto et al. (2006) Goto, M., Usuda, T., Dullemond, C. P., et al., 2006, ApJ, 652, 758
- Grady et al. (2013) Grady, C. A., Muto, T., Hashimoto, J., et al., 2013, ApJ, 762, 48
- Janson et al. (2013) Janson, M., Brandt, T. D., Moro-Martin, A., et al., 2013, ApJ, 773, 73
-
Flaherty et al. (2016)
Flaherty, K., Hughes, A. M., Andrews, S., et al., 2016, ApJ, in press
- Kenyon and Bromley (2008) Kenyon, S., Bromley, B., 2008, ApJS, 179, 451
- Konishi et al. (2016) Konishi, M., Grady, C., Schneider, G., et al., 2016, ApJL submitted
- Kraus and Ireland (2012) Kraus, A., Ireland, M., 2012, ApJ, 745, 5
- Lafrenière et al. (2007) Lafreniére, D., Marois, C., Duyon, R., et al., 2007, ApJ, 660, 770
- Marois et al. (2006) Marois, C., Lafreniére, D., Duyon, R., al., 2006, ApJ, 641, 556
- Marois et al. (2008) Marois, C., Macintosh, B., Barman, T., et al., 2008, Science, 322, 1348
- Marois et al. (2010) Marois, C., Macintosh, B., Veran, J.-P., 2010, SPIE, 7736, 1
- Marsh et al. (2002) Marsh, K. A., Silverstone, M. D., Becklin, E. E., et al., 2002, ApJ, 573, 425
- Mazoyer et al. (2016) Mazoyer, J., Boccaletti, A., Choquet, E., et al., 2016, ApJ in press, arxiv: 1601.00505
- Mouillet et al. (2001) Mouillet, D., Lagrange, A.-M., Augereau, J.-C., Menard, F., 2001, A&A, 372, L61
- Péricaud et al. (2014) Péricaud, J., Di Falco, E., Dutrey, A., et al., 2014, Proceedings of the conference Thirty years of beta Pic and debris disks studies. Held at Institut d’Astrophysique de Paris - France, on September 8 - 12, 2014. Edited by Anne-Marie Lagrange & Anthony Boccaletti
- Pinilla et al. (2012) Pinilla, P., Benisty, M., Birnstiel, T., 2012, A&A, 545, 81
- Takeuchi and Artymowicz (2001) Takeuchi, T., Artymowicz, P. 2001, ApJ, 557, 990
- Thalmann et al. (2011) Thalmann, C., Janson, M., Buenzli, E., et al., 2011, ApJ, 743, L6
- Thalmann et al. (2013) Thalmann, C., Janson, M., Buenzli, E., et al., 2013, ApJ, 763, L29
- Thalmann et al. (2014) Thalmann, C., Mulders, G., Hodapp, K., et al., 2014, A&A, 566, 51
- Thi et al. (2014) Thi, W.-F., Pinte, C., Pantin, E., et al., 2014, A&A, 561, 50
- van der Marel et al. (2013) van der Marel, N., van Dishoeck, E. F., Bruderer, S., et al., 2013, Science, 340, 1199
- van der Marel et al. (2015) van der Marel, N., van Dishoeck, E. F., Bruderer, S., et al., 2015, A&A, 579, 106
- van der Marel et al. (2016) van der Marel, N., van Dishoeck, E. F., Bruderer, S., et al., 2016, A&A, 585, 58
- van Leeuwen (2007) van Leeuwen, F., 2007, A&A, 474, 653
- Weidenschilling (1977) Weidenschilling, S. W., 1977, MNRAS, 180, 57
- Weinberger et al. (1999) Weinberger, A. J., Becklin, E. E., Schneider, G., et al. 1999, ApJ, 525, L53
- Weinberger et al. (2000) Weinberger, A. J., Rich, R. M., Becklin, E. E., et al., 2000, ApJ, 544, 937
- Williams and Cieza (2011) Williams, J. P., Cieza, L., 2011, ARA&A, 49, 67
- Wyatt (2005) Wyatt, M. C., 2005, A&A, 440, 937
- Wyatt (2008) Wyatt, M. C., 2008, ARA&A, 46, 339
- Yelda et al. (2010) Yelda, S., et al., 2010, ApJ, 725, 331
- Zuckerman et al. (1995) Zuckerman, B., Forveille, T., Kastner, J. H., 1995, Nature, 373, 494
| Parameter | Model Range | Best-Fit Model | Well-Fitting Models |
|---|---|---|---|
| fixed values | |||
| -1.2o | ” | ” | |
| varied values | |||
| 56–60o | 56o | 56–60o | |
| (AU) | 25, 36.9, 39.1, 41.3 | 39.1 | 36.9–41.3 |
| (AU) | 4.3, 6.1, 7.9 | 7.9 | 4.3–7.9 |
| (AU) | 0.5, 1.6, 2.7 | 0.5 | 0.5–1.6 |
| 1, 2.5, 5, 10 | 5 | 1–10 | |
| , , | – | ||
| 0, 0.1, 0.2 | 0 | 0–0.1 | |
| (AU) | 3, 5 | 5 | 3–5 |
Note. — Range of best fit and well-fitting model parameters as determined by our criterion (see §4).