Present address: ]Department of Polymer Science, The University of Akron, Akron Ohio Present Address: ]Div. of Experimental High-Energy Physics, Lund University, Lund, Sweden Present Address]Radiation Monitoring Devices, Cambridge, MA, USA Present address: ]Risø National Laboratory, Denmark Present address: ]Division of Science Education, Chonbuk National University, Jeonju, 561-756, Korea ]Spokesperson Present address]Institute of Modern Physics, Chinese Academy of Sciences, Lanzhou, China Present address: ]Huazhong Normal University,Wuhan, China
Rapidity and centrality dependence of particle production for identified hadrons in Cu+Cu collisions at GeV
Abstract
The BRAHMS collaboration has measured transverse momentum spectra of pions, kaons, protons and antiprotons at rapidities 0 and 3 for Cu+Cu collisions at GeV. As the collisions become more central the collective radial flow increases while the temperature of kinetic freeze-out decreases. The temperature is lower and the radial flow weaker at forward rapidity. Pion and kaon yields with transverse momenta between 1.5 and 2.5 GeV/ are suppressed for central collisions relative to scaled collisions. This suppression, which increases as the collisions become more central is consistent with jet quenching models and is also present with comparable magnitude at forward rapidity. At such rapidities initial state effects may also be present and persistence of the meson suppression to high rapidity may reflect a combination of jet quenching and nuclear shadowing. The ratio of protons to mesons increases as the collisions become more central and is largest at forward rapidities.
pacs:
25.75.GzI Introduction
Collisions of ions at the Relativistic Heavy Ion Collider (RHIC) with masses as heavy as Au and center of mass energies of 200 GeV per nucleon to produce extended systems that have been characterized as being partonic, strongly coupled and exhibiting hydrodynamic flow behavior with a viscosity per degree of freedom near the theoretical lower limit Kovtun:2004de . This medium is known as the strongly coupled Quark Gluon Plasma or sQGP Arsene:2004fa ; Adcox:2004mh ; Back:2004je ; Adams:2005dq .
The matter created in these heavy ion collisions exists for a very short period of time as it expands and cools down with the subsequent hadronization of all partons, some of which are eventually detected by the experiments as jets or leading hadrons. The medium can be explored by comparing spectra of hard probes from heavy-ion collisions (where the partons have to traverse an extended medium) to those of a smaller system, such as collisions, at the same energy per nucleon. Jet and leading hadron measurements are believed to probe the early stages of the dense medium while soft hadronic observables deliver information on the initial state and hydrodynamic evolution of the system.
The systematic study of such observables as a function of the number of participants in the collisions Npart, has been very important in understanding the matter created in Au+Au collisions at GeV. However for peripheral Au+Au collisions with the uncertainties on are of the order of 20% Adler:2003cb ; Adare:2013esx leaving room for different scenarios for the dependence of particle production on the system size.
In order to extend the medium size dependence of physical observables down to small systems such as d+Au and , the Cu+Cu system, with , was selected since it provides a good overlap with peripheral Au+Au collisions in terms of the number of participants. The relative uncertainty in the fractional cross-section of Cu+Cu collisions is smaller compared to that in Au+Au collisions for the same number of participants. Assuming a uniform mass distribution, the overlap region in central Cu+Cu collisions is spherical while that in Au+Au collisions for the same number of participants has an almond shape, making it possible to explore geometry effects on the experimental observables. The core/corona model of K. Werner Werner:2007bf and Beccattini and Manninen Becattini:2008ya provides a mechanism for testing these effects since the ratio of core to corona depends upon the shape of the overlap region.
Most available data of identified hadrons are from near mid-rapidity. The BRAHMS data offers a unique opportunity to study hadron production at both mid and forward rapidity and compare properties to further enhance our knowledge of the matter formed and different chemical conditions. In this paper, we present transverse-momentum spectra, yields, mean transverse momenta , nuclear modification factors () and ratios for identified charged hadrons () obtained with the BRAHMS spectrometers in Cu+Cu collisions at = 200 GeV. The measurements were done at two rapidities and as a function of collision centrality. Blast wave fits to the transverse momentum spectra are used to extract the mean transverse velocity and kinetic temperature at the kinetic freeze-out point. The results are compared to those obtained in and Au+Au collisions at the same energy, rapidity and centrality (number of participants) where available.
II The BRAHMS Experiment
The BRAHMS Experiment consists of two small acceptance magnetic spectrometers, the Mid-Rapidity Spectrometer (MRS) and the Forward Spectrometer (FS), for tracking, momentum determination, and particle identification together with a system of global detectors made up of Beam-Beam Counters (BBC), Zero Degree Calorimeters (ZDCs) and a Multiplicity Array (MA) Adamczyk:2003sq ; Adler:2000bd . The global detectors are used for triggering, centrality determination, and separating nuclear from electromagnetic events. The MRS uses two time projection chambers (TPCs), TPM1 and TPM2, with a magnet between them and time of flight (TOF) walls for particle identification (PID). The Forward Spectrometer (FS) has two TPCs (T1 and T2) and three Drift Chambers (DCs) with magnets located between the detectors. In the FS, PID is achieved by using a TOF wall behind T2 and a second TOF wall and a Ring Imaging Cherenkov (RICH) detector both placed after the third DC. The TPCs and DCs each provide several three dimensional space points which together with the momentum information provided by the deflection in magnets allow for particle tracking. The MRS is capable of rotating between and with respect to the beam pipe covering the rapidity interval from to . The FS rotates between and and covers the rapidity interval from to . For the data presented in this paper, the MRS was set at and the FS was set at . These settings correspond to and , respectively.
The primary collision vertex position is determined to an accuracy of 1 cm based on the relative time-of-flight of fast () particles hitting the beam-beam counter arrays (BBC). The BBCs consist of Cherenkov detectors mounted on photomultiplier tubes and are located 220 cm from the nominal vertex position on either side of the interaction region. The BBCs also provide the start time for the time of flight (TOF) measurements.
II.1 Event Selection
The centrality of the collisions is characterized by using a multiplicity array (MA), which consists of an inner layer of Si strip detectors and an outer layer of scintillator tiles each arranged as hexagonal barrels coaxial with the beam pipe. By measuring the energy loss of charged particles that traverse the two arrays, the strip detectors and the tiles provide two semi-independent measurements from which the pseudo-rapidity dependence of the charged particle density can be deduced. A realistic GEANT3 simulation of the detector response is used in this determination to map energy deposits to the corresponding number of primary particles Brun:1994aa . Reaction centrality is based on the distribution of charged particle multiplicities within the nominal pseudo-rapidity range covered by the MA, .
For a given event the centrality was taken to be defined as the fraction of observed events with a greater integral of charged particle multiplicity than that event. With this definition, centrality–correspond to collisions with the greatest overlap of the two nuclei. Events generated by HIJING were passed through a GEANT3 simulation of the experiment and used to estimate the number of peripheral events missed because they do not leave sufficient energy in the MA for detection. The procedure applied for determining centrality and the associated numbers of participants, , and binary nucleon-nucleon collisions, , in the Cu+Cu system is the same as described in detail for the Au+Au analysis Bearden:2001qq . The values extracted from this procedure are displayed in Table 1.
| Cent. | ||
|---|---|---|
| 0-10% | 166 2 | |
| 10-30% | 61 2.6 | 85 5 |
| 30-50% | 29 4.3 | 30 6 |
| 50-70% | 12 3.2 | 9.6 3.2 |
For this analysis, the events were divided into four centrality classes (). Events within cm of the nominal vertex were selected. Since the spectrometer acceptance depends upon the location of the vertex for a given event, spectral analysis is carried out in vertex bins of 5 cm and the results are statistically averaged to obtain the final spectra.
II.2 Track Selection
Straight line track segments are determined by tracking detectors, which are outside the magnetic field regions. These track segment are joined inside the analyzing magnet by taking an effective edge approximation. Matching track segments before and after the analyzing magnets allows for the determination of the track’s momentum using the vertical magnetic field, the length traversed in the magnetic field region and the orientation of the incoming and outgoing tracks.
Once the momentum is known, the reconstructed tracks are projected toward the beam axis and checked for consistency with the collision vertex determined by the BBCs. A cut is applied about the mean of the distribution of differences between the projected track vertex and the BBC vertex along the beam direction. An elliptical cut of is applied to the two-dimensional distributions of track intersections with the primary vertex plane. This plane is defined as the plane normal to the beam axis that contains the collision vertex. The rapidity cuts were at mid-rapidity and at forward rapidity.
II.3 Particle Identification
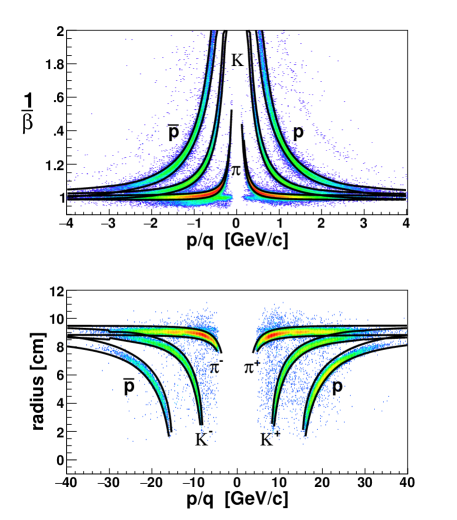
In this analysis, the MRS time of flight and the FS RICH detectors are used for PID at and , respectively. The time of flight measurement with TOFW and knowledge of the flight path length allows to be determined. This together with the momentum of a detected particle provides for particle identification using the relation
| (1) |
Particles of different masses fall on separate curves if is plotted versus momentum. The TOFW provides separation up to a momentum of 2 GeV/ and separation up to 3 GeV/. Figure 1 (top) shows the distribution of for the MRS where for positive particles and for negative particles. For this analysis, tracks were required to have measured values within of the nominal values given by Eq.(1) for each particle species. The curves show the cuts around the nominal trajectories for the different particle species.
For the FS, the emission angle of the light radiated in the RICH detector along the particle path is given by
| (2) |
where is the index of refraction of the gas inside the RICH volume. A spherical mirror of focal length was used to focus the light cones onto rings of radii
| (3) |
Once the radii of the Cherenkov rings are measured, the masses of the particles are deduced from the formula
| (4) |
The RICH can identify pions starting at 2.5 GeV/, kaons starting around 8 GeV/, and protons (anti-protons) from 15 GeV/. The separation extends up to 20 GeV/ and protons (anti-protons) can be identified up to 35 GeV/. Figure 1 (bottom) shows the distribution of radius for the RICH detector. At , the tracks were required to have a RICH radius within of the nominal radius for a given species as determined from Eq. (4), with a correction to the yield applied for purity in the overlap regions.
II.4 Corrections
The data presented are corrected for the geometrical acceptance of the spectrometers, tracking efficiency, particle mis-identification and the effects of particle decays based on the GEANT3 simulations. These simulations are also used to correct the experimental results for effects such as interactions with the beam pipe, absorption, and multiple scattering within the gas volumes of the tracking detectors.
To account for the acceptance, particles are generated with a uniform momentum distribution over a range of angles and broad enough for the spectrometer aperture to lie within the range. The acceptance factor for a given pseudo-rapidity and range is then the fraction of accepted particles to those thrown scaled by . This is done for each vertex bin and for the different spectrometer angle and magnetic field settings. The acceptance correction is applied to the individual spectra from different spectrometer settings before they are averaged.
The tracking efficiency is calculated using a reference track method where good tracks from one set of detectors are taken as input to a detector whose efficiency is sought. For the MRS, for example, tracks from the first time projection chamber (TPC) and the Time of Flight wall are used as input to determine the efficiency for the second TPC, and vice-versa. The ratio of the number of tracks matching the reference tracks to the total number of input reference tracks is taken as the tracking efficiency. The product of the efficiencies calculated for the two MRS TPCs in this way is then taken to be the overall tracking efficiency for the MRS and is . For the FS, the overall tracking efficiency is , determined as the product of the individual efficiencies for all tracking stations. The systematic uncertainty on the final spectra associated with the determination of the tracking efficiency is . The tracking efficiency is applied to the final MRS spectra. For the FS the efficiency correction was applied on a track by track basis.
The corrections for multiple scattering and hadronic absorption were computed by simulating single particle events with GEANT3 (including the relevant physical processes in the detector material) and processing the results through the standard BRAHMS analysis code. The simulations included multiple scattering and hadronic interaction processes. These GEANT corrections are applied on a track by track basis for both the MRS and FS.
To take into account particle mis-identification, a PID correction has been applied to the pion and kaon spectra. At higher momenta the well defined 3 bands start to overlap. The contamination of the pions and kaons was evaluated by fitting the distributions in m2, or ring radius for narrow bins and determining the contamination fractions and their systematic uncertainties. The invariant yields have been corrected due to this effect. Typical correction factors are given in Table 2.
In the momentum range covered, the (anti)protons are well separated from the mesons and no PID correction is applied to their spectra.
| y=0 | y=3 | |||
|---|---|---|---|---|
| 1.5 GeV/ | 2.25 GeV/ | 24 GeV/ | 30 GeV/ | |
| Pion | ||||
| Kaon | ||||
Feed down from -decay corrections are not applied to the proton (anti-proton) spectra. This is primarily because the spectra of ’s have not been measured at the higher rapidities. Later, when discussing integrated yields () of protons at mid-rapidity those have been corrected to first order since the yields were measured by other experiments Abelev:2006cs ; Agakishiev:2011ar , and detailed simulations indicate that about 90% of the decay protons from s pass our cuts for primary particles.
III Results and discussion
III.1 Particle spectra
Measurement of transverse momenta spectra is the crucial first step in obtaining the various observables used to characterize the properties of the partonic medium created in heavy ion collisions. Figure 2 shows the invariant spectra for the charged hadrons and , versus transverse kinetic energy, for different collision centralities at and . The spectra of particles and antiparticles have very similar shapes. Comparing pions, kaons and protons, a steady hardening of the spectra with particle mass is observed. Both of these effects are suggestive of hydrodynamics. The lines in Fig. 2 are fits of the hydrodynamical inspired blast wave model Tomasik:1999cq to the six and spectra at a given rapidity and centrality. These fits will be discussed in detail later. The magnitude of the spectra depend strongly on centrality for all particles and for both rapidities. For kaons and protons the shapes of the spectra harden as one moves from peripheral to central collisions. The spectra for all particle species are softer at forward rapidity but, again, one observes a strong centrality dependence.
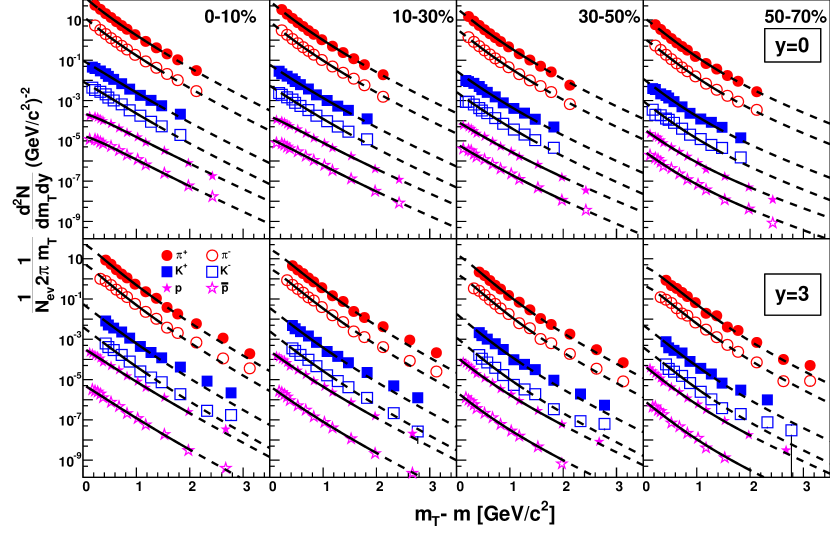
A systematic study of the spectra was performed by fitting them to a variety of functions. For pions the Levy function Wilk:Levy ; STAR:Levy ; Adare:2010fe provided the best fit to the data while kaons and protons were best fit by the Boltzmann function (). For the Boltzmann function, the fit parameter can be thought of as the effective temperature of the system. The resulting fitting parameters, the per number of degrees of freedom, and NDF, are listed in Tables 4, 5, and 6 for pions, kaons, and protons, respectively. The integrated yields , and mean transverse momenta, , are obtained by extrapolating the fit functions outside the measurement region. The fraction of the particle yield within the BRAHMS acceptance varies from depending upon the spectrometer setting and particle specie. Results from other functions were used to estimate the contribution to systematic errors on and from the extrapolation beyond the acceptance of the experiment.
A model dependent analysis of the transverse momentum spectra as a function of rapidity and centrality allows the extraction of the thermodynamic and collective properties of the system at kinetic freeze-out. At mid-rapidity the hydro-inspired blast wave model Tomasik:1999cq predicts a spectrum with
| (5) |
where , , , and is the velocity profile as a function of radial distance, . In this model Tkin represents the kinetic temperature of the system, the velocity of the surface of the expanding medium and controls how the velocity of the expanding matter depends upon radial distance. For this study was taken to be the nuclear radius. In Eq. (5), is the radial density profile. In this analysis is assumed to have a Gaussian form for where . For The modified Bessel function comes from integration from to over pseudo-rapidity assuming boost invariance. At forward rapidity, the assumption of boost invariance is not valid and should be replaced by an integral over over a finite range of so that
| (6) |
where
| (7) |
and is the rapidity variable. The limits of the integration in Eq. (7) were and . At these limits the integrand in Eq. (7) is very small compared to its central value at . The results of the fit are stable with respect to small changes in these limits.
For both the mid-rapidity and forward-rapidity data, we performed a simultaneous fit of the pion, kaon and (anti)proton spectra with 3 parameters: and . The normalization parameters are adjusted such that the integral yield of the data in the fitting range is reproduced. Feed down from resonances was not considered since the data do not extend below 0.4 GeV/ where such effects are likely to be significant. The fit ranges for pions, kaons and protons are restricted to GeV/ , GeV/, and GeV/, respectively, since hard processes are expected to become significant above these momenta.
The fits are shown as lines in Fig. 2. The solid lines indicate the transverse mass range for the fits and the dotted lines are extrapolations of the functions beyond the fit range. The systematic errors on the parameters were estimated by changing the fit ranges used for the fits, using different density profiles, and different maximum radii, and for the forward data changing the limits of the integration. The blast wave fit parameters are tabulated in Table 3. The and from the blast wave fit are in reasonable agreement with fits to the individual kaon and proton spectra listed in Tables 5 and 6.
Figure 3 shows the (anti-)correlation between the kinetic temperature, Tkin, and the average transverse velocity , for the four centrality classes at both rapidities. As collisions become more central (going from left to right in Fig. 3), Tkin decreases as increases. This is expected since a larger system should stay together for a longer time. As the system cools random thermal motion of the partons is converted to bulk radial flow, lowering the temperature and increasing the average velocity.
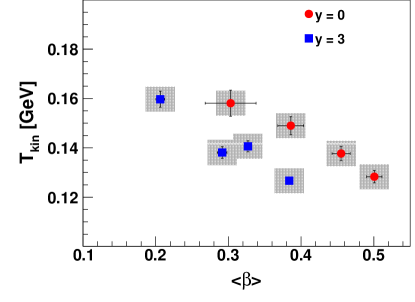
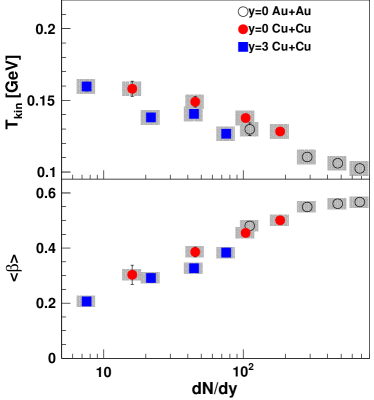
At the slope of the Tkin versus curve is similar to that at , but for a given the temperatures are about 20 MeV lower. This effect does not just result from having lower particle densities at . Figure 4 shows the dependence of the kinetic freeze-out temperature and the mean radial flow velocity for Cu+Cu and Au+Au collisions as a function of the total ( and ) of each centrality class at a given rapidity. For a given both Tkin and are smaller at reflecting the lower energy (and hence lower ) that is available to the matter at forward rapidity. At mid-rapidity the dependence of Tkin and on is similar in Cu+Cu and Au+Au reactions, with slightly higher values of Tkin and slightly lower values of in Cu+Cu compared to Au+Au reactions. At mid-rapidity the STAR collaboration has made blast wave fits to , proton and antiproton spectra Aggarwal:2010pj . The reported values for Tkin are slightly lower but consistent within errors to the corresponding BRAHMS results. The ranges for the data and fits were also slightly different.
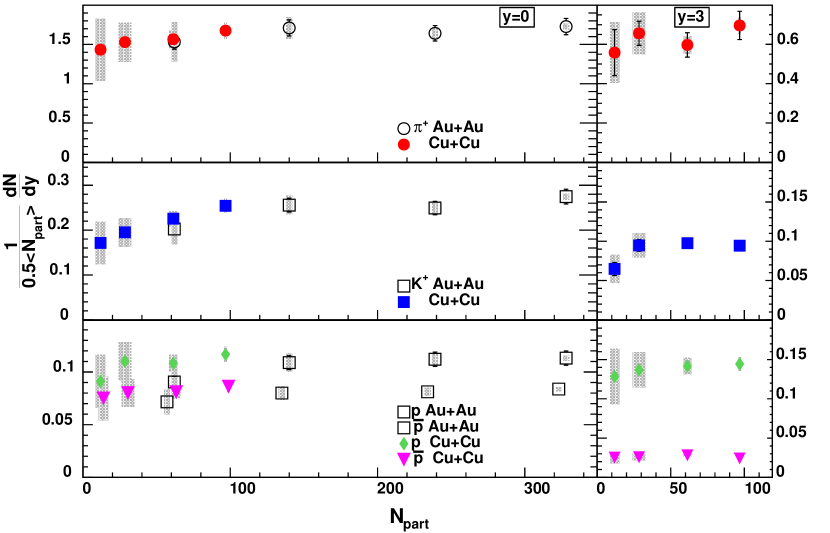

In Fig. 5 the values per participant pair are shown for central (left) and forward (right) rapidity for Cu+Cu and Au+Au (mid-rapidity only) collisions Arsene:2005mr . For clarity, only the positive pions and kaons are shown, but the trends are very similar for the corresponding negative particles. At both central and forward rapidity the kaon yields per participant pair are somewhat smaller for lower values of Npart. For Npart between 60 and 100 the values for extracted from Cu+Cu collisions are similar to the ones extracted from Au+Au, while for the scaled values are slightly higher. A similar effect has been seen by STAR where the and yields at a given Npart are somewhat higher for Cu+Cu than for Au+Au Aggarwal:2010pj ; Agakishiev:2011ar .
Beccattini and Manninen have proposed that an increase of the scaled values as observed for the kaon yields might reflect the effect of two sources, a chemically equilibrated and dense “core” and a “corona” of independent nucleon-nucleon collisions Becattini:2008ya . As the centrality of the system decreases the ratio of core to corona changes causing a change in the kaon yield per participant pair.
Figure 6 shows the average transverse momenta for pions, kaons and (anti)protons versus Npart for Cu+Cu collisions at and and for Au+Au collisions at Arsene:2005mr . A general observation is that depends strongly on particle mass, reflecting the larger boost given to the heavier particles by radial flow (as expected from the blast wave model). While the pion values at are similar to those at , the kaons and (anti)protons exhibit smaller values at forward rapidity. This drop in for the heavier particles reflects the lower radial flow and freeze-out temperatures at forward rapidity shown in Figs. 3 and 4.
At mid-rapidity there is a small increase in the pion as the collisions become more central. The increase of the values for more central collisions is more pronounced for the kaons and the (anti)protons. The pions and kaons show no -dependence on centrality at forward rapidity while the (anti)proton appears to increase as the collisions become more central. The Cu+Cu data points join smoothly with those from Au+Au collisions (a similar result was observed by STAR for the in the two colliding systems Aggarwal:2010mt .) This suggests that the values are insensitive to the difference in shape of the Cu+Cu and Au+Au overlap regions for the same number of participants.
III.2 Nuclear Modification Factors
The discovery of high hadron suppression at central rapidity in GeV Au+Au collisions at RHIC has been one of the most exciting results in heavy ion physics Adcox:2001jp ; Adler:2002xw ; Arsene:2003yk ; Back:2003qr . These first measurements have since been extended to higher energies and a broad range of colliding systems, both light and heavy, and also refined to include identified hadrons, heavy quarks and fully reconstructed jets Adler:2003qi ; Adams:2003kv ; Adare:2006nq ; Aad:2010bu ; Chatrchyan:2011sx ; Aad:2012vca ; Chatrchyan:2012gw . No such effects have been seen at in d-Au collisions at RHIC Adler:2003ii ; Adams:2003im ; Arsene:2003yk ; Back:2003qr confirming that the observed suppression found at mid-rapidity in central heavy-ion collisions is indeed a final-state effect and is specifically a consequence of the energy loss of partons. At forward rapidity, the colliding systems d+Au and Au+Au at both exhibit high suppression similar to each other and to the mid-rapidity Au+Au results Arsene:2004ux ; Arsene:2004ux .
The nuclear effects on particle production are studied in terms of the nuclear modification factor defined as
| (8) |
which is the ratio of the particle yield in heavy ion collisions to the yield in collisions scaled by the average number of binary nucleon-nucleon collisions for a given centrality class. If AA collisions were just a superposition of elementary collisions between nucleons, then should be 1.0 in the region dominated by hard processes.
Partonic energy loss in a hot QGP will typically lead to an value well below unity. Initial-state effects, such as shadowing of the nuclear parton distribution functions may also influence the values and are believed to contribute to the suppression observed at forward rapidity in = 200 GeV d+Au and Au+Au collisions at RHIC Arsene:2004ux ; Arsene:2006ts . The particle species dependences of at low to intermediate may be influenced by various medium effects such as collective radial flow (leading to a mass ordering of the of identified hadrons) and/or parton recombination effects (typically leading to meson-baryon differences).
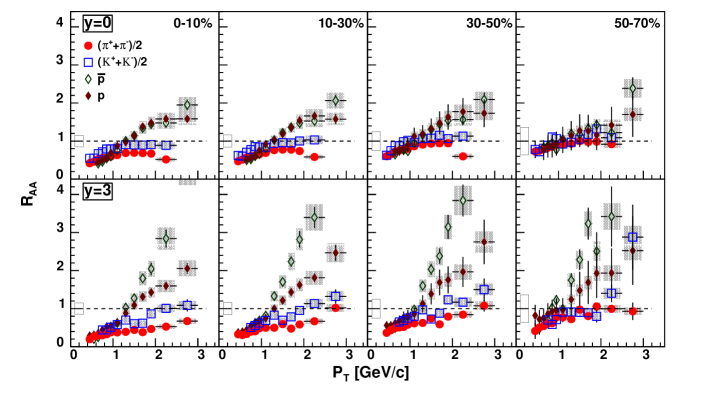
Figure 7 shows the nuclear modification factor for pions, kaons, and (anti)protons, respectively, in Cu+Cu collisions. The pion and kaon values are averages of the positive and negative particles. A general trend immediately seen is the clear mass ordering of the values for the various particle species, most pronounced in the more central collisions and compatible with radial flow and/or recombination effects influencing the modification pattern.
For GeV/ the pions are suppressed at both rapidities for central and mid-central events. The level of suppression is strongest for more central collisions which achieve the highest densities and largest volumes. This is consistent with the fact that the multiplicity density decreases as one goes to more peripheral collisions; there is less matter to interact with and more partons make it out of the collision region before losing much of their energy. Interestingly the suppression is stronger at forward rapidities where one would expect parton energy loss to be less. This is consistent with the pattern seen for mesons in Au+Au collisions Arsene:2006ts .
Kaons with GeV/c do not show significant suppression at but they are suppressed at . The suppression of the kaons is less pronounced than that of the pions but shows a similar dependence on centrality. The difference in the pion and kaon suppression patterns may reveal information about their respective fragmentation functions Djordjevic:2013qba . At mid-rapidity, the values for pions and kaons vary little with over the range GeV/. At forward rapidity there is an increase of the kaon and pion values with similar for all centralities but somewhat less pronounced for the for most peripheral sample.
For both protons and antiprotons rises steadily with crossing 1.0 at GeV/ for all centralities and both rapidities. The enhancement for GeV/ is strongest in peripheral collisions and at forward rapidity. At central rapidity the enhancement is similar for protons and antiprotons but at the antiprotons show a greater enhancement than the protons, partially due to the isospin-related difference in reference spectra for protons and antiprotons at forward rapidity in collisions PhysRevLett.98.252001 .
Note that the STAR collaboration has measured for pions and at mid-rapidity and GeV/ in Cu+Cu collisions at GeV/ Abelev:2009ab . The STAR results are consistent with our highest data points but fall steadily before leveling off at GeV/.
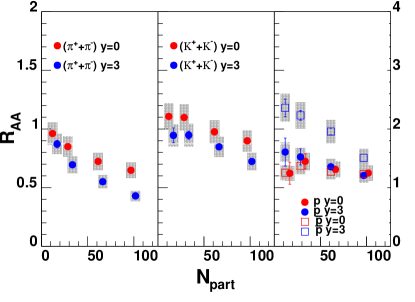
To improve the statistical precision of the results the Cu+Cu and spectra were summed over the region 1.3–2.5 GeV/ and the and spectra averaged before taking the ratio shown in Eq. 8. The resulting values as a function of are shown in Fig. 8. For pions and kaons the values are smaller at than at , for protons they are similar at the two rapidities, while for antiprotons the values are larger at than at . For pions and kaons drops with at both and , while this trend is less clear for the baryons. For both protons and anti-protons is above 1.0 for all values of Npart and at both rapidities, with anti-protons at standing out as most enhanced and with falling with Npart .
The fact that the mesons are more strongly suppressed for more central collisions is expected from from models of parton energy loss or jet quenching. In such models it is expected that the energy loss should be less at forward rapidities because of the decreasing particle density. However this effect my be compensated in the ratio by a relative softening of the Cu+Cu spectra at forward rapidities. PHENIX has suggested that a similar effect may explain why at high is almost the same at and 200 GeV PhysRevLett.109.152301 . It is also possible that at forward rapidity initial state effects such as nuclear shadowing are reducing particle production, Arsene:2004ux ; Arsene:2006ts .
III.3 Particle Ratios
Figure 9 shows antiparticle to particle ratios of integrated yields measured in Cu+Cu and Au+Au collisions at GeV as a function of Npart, for and . These ratios of integrated yields do not exhibit a centrality dependence at mid-rapidity. There is very little difference between the Cu+Cu and Au+Au results. At there is a slight drop of the ratio with Npart.
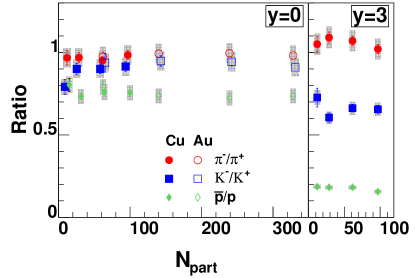
Figure 10 shows the kaon to pion ratios (upper two panels) and proton to meson ratios (lower two panels) as functions of , centrality and rapidity. At mid-rapidity, the ratios show a linear increase at low but increase less rapidly for GeV/, with the ratio showing only a slight excess over the corresponding values. At , both ratios show a slightly stronger centrality dependence than at , and the ratios are significantly enhanced over the corresponding results.
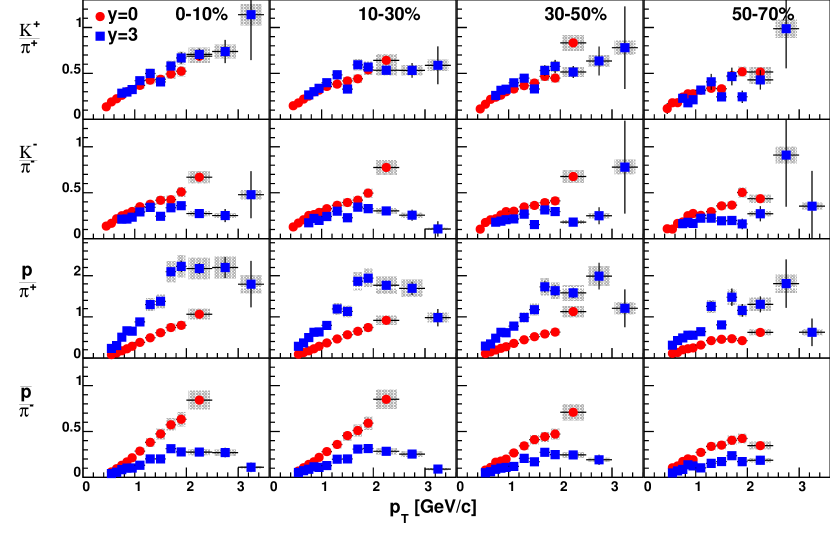
Both the and ratios increase with at both rapidities with saturation taking place at 1.6 GeV/ for . The baryon-meson ratios also show a moderate centrality dependence at the two rapidities. Both ratios at this -range exceed the maximum value of 0.2 observed in elementary collisions at = 91.2 GeV for both quark and gluon jets Abreu:1998vq ; Abreu:2000nw . Various mechanisms such as quark coalescence, radial flow or baryon transport dynamics may boost the baryon-meson ratios at intermediate above the expected fragmentation value Guo:2000nz ; Hirano:2003yp ; Hirano:2003pw ; Heinz:2001xi ; Hwa:2004ng ; Greco:2003mm ; Greco:2004yc ; Fries:2003kq ; PhysRevC.65.041902 ; Vitev:2002wh ; ToporPop:2002gf . At mid-rapidity, the dependence of the BRAHMS ratio in central Au+Au collisions at = 200 GeV Staszel:2005aw has been reasonably described by recombination Hwa:2004ng . Hydrodynamic models also qualitatively reproduced the trend Hirano:2003yp ; Hirano:2003pw ; Heinz:2001xi . Although it is clear that the system size and the chemical properties of the medium are important parameters, the detailed behavior of hadron production in the forward rapidity region remains a challenge to microscopic models, as also seen in ref. Arsene:2009jg .
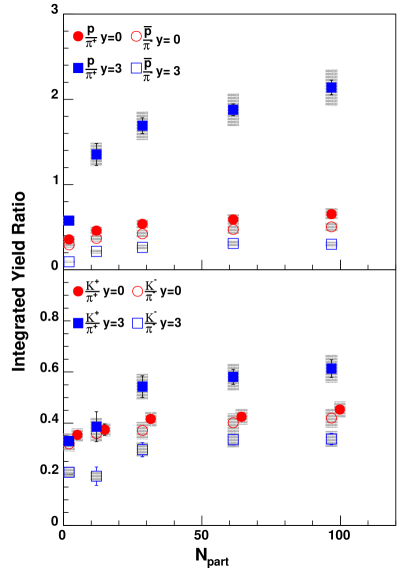
The Npart dependence of the and ratios is displayed in Fig. 11. Here the individual spectra have been integrated over the range GeV/ for and over GeV/ for . We also show the ratios obtained from the BRAHMS data PhysRevLett.98.252001 ; pp200 . The values fit smoothly with the trend of the lower values for Cu+Cu. The ratios increase slightly with Npart, with the strongest centrality dependence seen for peripheral collisions at . The ratios are significantly larger than the ratios at , but the two ratios are similar at . This may be attributed to the larger baryon density at which increases the probability of associated production for .
The top panel of Fig. 11 shows the integrated and ratios versus Npart. The ratios seem to exhibit a monotonic increase with Npart at both rapidities. Again the pp ratios fit the trend of the lower Npart results but this dependence is stronger at . At mid-rapidity the ratios are smaller than unity with values slightly larger than the corresponding values. At forward rapidity, the ratio is generally greater than unity and is larger than the corresponding ratio by almost a factor of 6. This has also been observed in Au+Au collisions at the same center of mass energy per nucleon Arsene:2009nr . While the beam protons may be contributing to the ratio, the reason for such large differences between the positive and negative baryon to meson ratios is not yet well understood. The increase of the baryon to meson ratios with centrality is consistent with trends exhibited by the values, where mesons become more suppressed for central events while baryons show only a weak if any centrality dependence.
IV Summary and Conclusions
The and spectra from Cu+Cu collisions at GeV are well described by blast wave fits at both central and forward rapidities. As Npart increases the kinetic temperature Tkin drops and the mean velocity rises. For a given , Tkin is about 15-20 MeV smaller at than at . The particle yields per participant pair increase with Npart. For a given Npart the kaon values are slightly larger in Cu+Cu collisions than in Au+Au collisions.
Both pions and kaons from Cu+Cu collisions are suppressed relative to scaled collisions. The suppression is strongest for central collisions as expected from models of parton energy loss or jet quenching. The suppression is slightly stronger at forward rapidity than at central rapidity suggesting that the effect of the hot and dense medium extends to at least at RHIC energies. This is despite the fact that the rapidity densities in the forward region are about half of those at mid rapidity. The PHENIX collaboration has observed that increasing parton energy loss with increasing beam energy can be compensated by hardening of the spectra, in such a way that remains unchanged PhysRevLett.109.152301 . A similar effect may be present when going to forward rapidities, so that the approximately constant can be a result of reduced energy loss combined with steeper spectra for mesons. It is also possible that initial state effects such as nuclear shadowing are effecting particle production at forward rapidities, Arsene:2004ux ; Arsene:2006ts .
In contrast to the pions and kaons, protons with GeV/ are enhanced relative to scaled collisions. The baryon enhancement seen in depends strongly on and rapidity but only weakly on centrality The enhancement is similar for protons and antiprotons at , but is stronger for antiprotons at forward rapidity. This is mainly because the reference spectrum for antiprotons at is much steeper than the corresponding proton spectrum PhysRevLett.98.252001 .
The and ratios are almost independent of and centrality but they do depend upon rapidity, presumably because of the higher net-baryon density in the forward region. The and ratios increase with Npart for up to 1.6-2 GeV/ at both rapidities. The four ratios at are seen to saturate for GeV/. At , the kaon-pion and proton-pion ratios exhibit a slightly different centrality dependence in the lowest region.
At both rapidities the and ratios in the intermediate region, i.e. 2.0 GeV/ GeV/ are rather large for central collisions. This may be explained by either quark coalescence Guo:2000nz ; Greco:2003mm ; Fries:2003kq ; Hwa:2004ng ; Greco:2004yc , radial flowHirano:2003yp ; Hirano:2003pw ; Heinz:2001xi , or baryon transport dynamics based on topological gluon field configurations PhysRevC.65.041902 ; Vitev:2002wh ; ToporPop:2002gf . A similar baryon enhancement has been observed for Pb+Pb collisions at = 2.76 TeV Abelev:2014laa . These data are also consistent with recombination Fries:2003kq and hydrodynamical models Bozek:2012qs .
Understanding the underlying mechanisms responsible for hadron production over the broad range of transverse momentum and rapidity accessible at RHIC and providing a consistent description of all the various aspects of the hadron spectra in heavy ion collisions remains a major challenge. The current data will help constrain theoretical attempts to reach such a synthesis.
V Acknowledgements
This work was supported by the office of Nuclear Physics of the U.S. Department of energy, the Discovery Center of the Danish Natural Science Research Council, the Research Council of Norway, the Polish State Committee for Scientific Research (KBN), and the Romanian Ministry of Research.
| Cent. | (MeV/) | T (MeV) | |||||||
| y=0 | 81.1 3.1 5.9 | 42.1 | 0.52 | 454 2 21 | 0.2/ 9 | 12.8 | 172 | ||
| 48.0 2.1 3.5 | 24.3 | 0.51 | 445 4 21 | 0.9/ 9 | 11.6 | 164 | |||
| 21.8 0.5 1.6 | 10.8 | 0.50 | 438 2 21 | 0.2/ 9 | 11.2 | 159 | |||
| 8.5 0.40 0.62 | 4.0 | 0.47 | 418 5 20 | 2.4/ 9 | 10.2 | 147 | |||
| y=3 | 33.7 3.5 2.4 | 11.2 | 0.33 | 401 8 19 | 12.2/ 9 | 17.0 | 159 | ||
| 18.3 1.9 1.3 | 6.6 | 0.36 | 424 9 20 | 16.2/ 9 | 19.3 | 173 | |||
| 9.3 0.88 0.67 | 3.1 | 0.33 | 403 7 19 | 7.3/ 9 | 16.1 | 158 | |||
| 3.3 0.70 0.24 | 1.2 | 0.35 | 418 14 20 | 23.0/ 9 | 17.9 | 168 | |||
| y=0 | 78.0 3.3 4.9 | 41.1 | 0.53 | 460 4 22 | 0.9/ 9 | 13.3 | 176 | ||
| 44.7 1.9 2.8 | 23.2 | 0.52 | 455 5 21 | 2.1/ 9 | 12.3 | 170 | |||
| 20.5 0.9 1.3 | 10.2 | 0.50 | 441 3 21 | 0.5/ 9 | 10.6 | 158 | |||
| 8.0 0.36 0.51 | 3.8 | 0.47 | 421 4 20 | 0.7/ 9 | 10.2 | 148 | |||
| y=3 | 32.4 3.1 2.3 | 11.2 | 0.35 | 411 8 19 | 14.5/ 9 | 17.5 | 164 | ||
| 20.8 1.8 1.5 | 7.4 | 0.36 | 419 8 20 | 13.9/ 9 | 21.0 | 173 | |||
| 11.1 1.4 0.8 | 3.5 | 0.32 | 392 9 18 | 16.8/ 9 | 15.5 | 152 | |||
| 3.6 0.40 0.26 | 1.3 | 0.36 | 424 8 20 | 5.2/ 9 | 20.5 | 174 | |||
| Cent. | (MeV/) | T (MeV) | ||||||
| y=0 | 12.3 0.32 0.89 | 7.6 | 0.62 | 674 10 22 | 1.6/7 | 277 | ||
| 6.9 0.01 0.50 | 4.2 | 0.61 | 663 7 21 | 0.9/7 | 271 | |||
| 2.8 0.02 0.20 | 1.7 | 0.62 | 667 14 21 | 3.9/7 | 273 | |||
| 1.0 0.05 0.12 | 0.6 | 0.59 | 625 14 20 | 3.4/7 | 251 | |||
| y=3 | 4.6 0.29 0.33 | 1.3 | 0.27 | 611 14 20 | 4.1/4 | 244 | ||
| 3.0 0.20 0.22 | 0.78 | 0.26 | 594 19 19 | 5.8/4 | 235 | |||
| 1.4 0.11 0.10 | 0.34 | 0.25 | 577 20 18 | 5.7/4 | 226 | |||
| 0.39 0.05 0.03 | 0.10 | 0.26 | 600 27 19 | 5.4/4 | 238 | |||
| y=0 | 11.2 0.23 0.71 | 7.2 | 0.64 | 682 9 22 | 2.0/ 8 | 282 | ||
| 6.1 0.15 0.38 | 3.9 | 0.64 | 683 12 22 | 4.3/8 | 282 | |||
| 2.5 0.08 0.16 | 1.6 | 0.63 | 677 26 22 | 11.4/8 | 279 | |||
| 0.7 0.02 0.10 | 0.5 | 0.64 | 685 28 22 | 10.8/8 | 283 | |||
| y=3 | 3.9 0.02 0.28 | 0.96 | 0.25 | 569 12 18 | 5.4/5 | 222 | ||
| 2.2 0.12 0.16 | 0.57 | 0.26 | 580 10 19 | 4.4/5 | 227 | |||
| 1.0 0.05 0.07 | 0.24 | 0.23 | 551 12 18 | 4.8/5 | 213 | |||
| 0.34 0.02 0.03 | 0.08 | 0.25 | 572 12 18 | 1.5/5 | 223 | |||
| Cent. | (MeV/) | T (MeV) | ||||||
| y=0 | 8.1 0.03 0.51 | 5.7 | 0.70 | 896 18 29 | 9.1/ 9 | 332 | ||
| 4.7 0.10 0.29 | 3.2 | 0.69 | 874 9 28 | 1.9/ 9 | 320 | |||
| 2.1 0.05 0.13 | 1.4 | 0.67 | 831 14 27 | 6.4/ 9 | 296 | |||
| 0.7 0.03 0.05 | 0.46 | 0.64 | 784 25 25 | 12.3/ 9 | 271 | |||
| y=3 | 7.0 0.03 0.44 | 5.1 | 0.74 | 775 13 25 | 10.3/ 10 | 266 | ||
| 4.3 0.11 0.27 | 3.2 | 0.73 | 761 16 24 | 12.4/ 10 | 259 | |||
| 2.0 0.07 0.12 | 1.4 | 0.71 | 737 38 24 | 23.2/ 10 | 247 | |||
| 0.76 0.04 0.05 | 0.54 | 0.70 | 712 57 23 | 30.7/ 10 | 234 | |||
| y=0 | 6.0 0.17 0.38 | 4.3 | 0.70 | 906 38 29 | 15.9/ 9 | 338 | ||
| 3.5 0.11 0.22 | 2.4 | 0.69 | 880 12 28 | 3.9/ 9 | 323 | |||
| 1.5 0.04 0.10 | 1.0 | 0.68 | 839 16 27 | 7.7/ 9 | 300 | |||
| 0.6 0.02 0.04 | 0.38 | 0.64 | 781 22 25 | 10.9/ 9 | 269 | |||
| y=3 | 1.2 0.04 0.07 | 0.73 | 0.62 | 750 20 24 | 11.7/ 9 | 254 | ||
| 0.86 0.04 0.05 | 0.53 | 0.61 | 731 31 23 | 17.1/ 9 | 244 | |||
| 0.37 0.01 0.02 | 0.22 | 0.60 | 719 27 23 | 14.2/ 9 | 238 | |||
| 0.15 0.01 0.01 | 0.09 | 0.57 | 685 42 22 | 18.2/ 9 | 221 | |||
References
- (1) P. Kovtun, D. T. Son, and A. O. Starinets, Phys.Rev.Lett. 94, 111601 (2005), arXiv:hep-th/0405231 [hep-th]
- (2) I. Arsene et al. (BRAHMS), Nucl.Phys. A757, 1 (2005), arXiv:nucl-ex/0410020 [nucl-ex]
- (3) K. Adcox et al. (PHENIX), Nucl.Phys. A757, 184 (2005), arXiv:nucl-ex/0410003 [nucl-ex]
- (4) B. Back, M. Baker, M. Ballintijn, D. Barton, B. Becker, et al. (PHOBOS), Nucl.Phys. A757, 28 (2005), arXiv:nucl-ex/0410022 [nucl-ex]
- (5) J. Adams et al. (STAR), Nucl.Phys. A757, 102 (2005), arXiv:nucl-ex/0501009 [nucl-ex]
- (6) S. Adler et al. (PHENIX), Phys.Rev. C69, 034909 (2004), arXiv:nucl-ex/0307022 [nucl-ex]
- (7) A. Adare et al. (PHENIX), Phys.Rev. C88, 024906 (2013), arXiv:1304.3410 [nucl-ex]
- (8) K. Werner, Phys.Rev.Lett. 98, 152301 (2007), arXiv:0704.1270 [nucl-th]
- (9) F. Becattini and J. Manninen, Phys.Lett. B673, 19 (2009), arXiv:0811.3766 [nucl-th]
- (10) M. Adamczyk et al. (BRAHMS), Nucl.Instrum.Meth. A499, 437 (2003)
- (11) C. Adler, A. Denisov, E. Garcia, M. J. Murray, H. Strobele, et al., Nucl.Instrum.Meth. A470, 488 (2001), arXiv:nucl-ex/0008005 [nucl-ex]
- (12) R. Brun, F. Carminati, and S. Giani(1994)
- (13) I. Bearden et al. (BRAHMS), Phys.Rev.Lett. 88, 202301 (2002), arXiv:nucl-ex/0112001 [nucl-ex]
- (14) B. I. Abelev et al. (STAR), Phys. Rev. C75, 064901 (2007), arXiv:nucl-ex/0607033 [nucl-ex]
- (15) G. Agakishiev et al. (STAR), Phys.Rev.Lett. 108, 072301 (2012), arXiv:1107.2955 [nucl-ex]
- (16) B. Tomasik, U. A. Wiedemann, and U. W. Heinz, Heavy Ion Phys. 17, 105 (2003), arXiv:nucl-th/9907096 [nucl-th]
- (17) G. Wilk and Z. Wlodarczyk, Phys. Rev. Lett 84, 2770 (2000)
- (18) J. Adams et al. (STAR), Phys. Rev. C 71, 064902 (2005)
- (19) A. Adare et al. (PHENIX), Phys.Rev. D83, 052004 (2011), arXiv:1005.3674 [hep-ex]
- (20) M. M. Aggarwal et al. (STAR), Phys. Rev. C83, 034910 (2011), arXiv:1008.3133 [nucl-ex]
- (21) I. Arsene et al. (BRAHMS), Phys.Rev. C72, 014908 (2005), arXiv:nucl-ex/0503010 [nucl-ex]
- (22) F. Videbaek (BRAHMS), Nucl. Phys. A830, 43C (2009), arXiv:0907.4742 [nucl-ex]
- (23) M. Aggarwal et al. (STAR), Phys.Rev. C84, 034909 (2011), arXiv:1006.1961 [nucl-ex]
- (24) K. Adcox et al. (PHENIX), Phys.Rev.Lett. 88, 022301 (2002), arXiv:nucl-ex/0109003 [nucl-ex]
- (25) C. Adler et al. (STAR), Phys.Rev.Lett. 89, 202301 (2002), arXiv:nucl-ex/0206011 [nucl-ex]
- (26) I. Arsene et al. (BRAHMS), Phys.Rev.Lett. 91, 072305 (2003), arXiv:nucl-ex/0307003 [nucl-ex]
- (27) B. Back et al. (PHOBOS), Phys.Lett. B578, 297 (2004), arXiv:nucl-ex/0302015 [nucl-ex]
- (28) S. Adler et al. (PHENIX), Phys.Rev.Lett. 91, 072301 (2003), arXiv:nucl-ex/0304022 [nucl-ex]
- (29) J. Adams et al. (STAR), Phys.Rev.Lett. 91, 172302 (2003), arXiv:nucl-ex/0305015 [nucl-ex]
- (30) A. Adare et al. (PHENIX), Phys.Rev.Lett. 98, 172301 (2007), arXiv:nucl-ex/0611018 [nucl-ex]
- (31) G. Aad et al. (ATLAS), Phys.Rev.Lett. 105, 252303 (2010), arXiv:1011.6182 [hep-ex]
- (32) S. Chatrchyan et al. (CMS), Phys.Rev. C84, 024906 (2011), arXiv:1102.1957 [nucl-ex]
- (33) G. Aad et al. (ATLAS), Phys.Lett. B719, 220 (2013), arXiv:1208.1967 [hep-ex]
- (34) S. Chatrchyan et al. (CMS), JHEP 1210, 087 (2012), arXiv:1205.5872 [nucl-ex]
- (35) S. Adler et al. (PHENIX), Phys.Rev.Lett. 91, 072303 (2003), arXiv:nucl-ex/0306021 [nucl-ex]
- (36) J. Adams et al. (STAR), Phys.Rev.Lett. 91, 072304 (2003), arXiv:nucl-ex/0306024 [nucl-ex]
- (37) I. Arsene et al. (BRAHMS), Phys.Rev.Lett. 93, 242303 (2004), arXiv:nucl-ex/0403005 [nucl-ex]
- (38) I. Arsene et al. (BRAHMS), Phys.Lett. B650, 219 (2007), arXiv:nucl-ex/0610021 [nucl-ex]
- (39) M. Djordjevic and M. Djordjevic, J.Phys. G41, 055104 (2014), arXiv:1307.4714 [nucl-th]
- (40) I. Arsene et al. (BRAHMS), Phys. Rev. Lett. 98, 252001 (Jun 2007), http://link.aps.org/doi/10.1103/PhysRevLett.98.252001
- (41) B. Abelev et al. (STAR), Phys.Rev. C81, 054907 (2010), arXiv:0911.3130 [nucl-ex]
- (42) A. Adare et al. (PHENIX Collaboration), Phys. Rev. Lett. 109, 152301 (Oct 2012), http://link.aps.org/doi/10.1103/PhysRevLett.109.152301
- (43) P. Abreu et al. (DELPHI), Eur.Phys.J. C5, 585 (1998)
- (44) P. Abreu et al. (DELPHI), Eur.Phys.J. C17, 207 (2000), arXiv:hep-ex/0106063 [hep-ex]
- (45) X.-f. Guo and X.-N. Wang, Phys.Rev.Lett. 85, 3591 (2000), arXiv:hep-ph/0005044 [hep-ph]
- (46) T. Hirano and Y. Nara, Phys.Rev. C68, 064902 (2003), arXiv:nucl-th/0307087 [nucl-th]
- (47) T. Hirano and Y. Nara, Phys.Rev. C69, 034908 (2004), arXiv:nucl-th/0307015 [nucl-th]
- (48) U. W. Heinz and P. F. Kolb, Nucl.Phys. A702, 269 (2002), arXiv:hep-ph/0111075 [hep-ph]
- (49) R. C. Hwa and C. Yang, Phys.Rev. C70, 024905 (2004), arXiv:nucl-th/0401001 [nucl-th]
- (50) V. Greco, C. Ko, and P. Levai, Phys.Rev. C68, 034904 (2003), arXiv:nucl-th/0305024 [nucl-th]
- (51) V. Greco, C. Ko, and I. Vitev, Phys.Rev. C71, 041901 (2005), arXiv:nucl-th/0412043 [nucl-th]
- (52) R. Fries, B. Muller, C. Nonaka, and S. Bass, Phys.Rev. C68, 044902 (2003), arXiv:nucl-th/0306027 [nucl-th]
- (53) I. Vitev and M. Gyulassy, Phys. Rev. C 65, 041902 (Apr 2002), http://link.aps.org/doi/10.1103/PhysRevC.65.041902
- (54) I. Vitev and M. Gyulassy, Nucl.Phys. A715, 779 (2003), arXiv:hep-ph/0208108 [hep-ph]
- (55) V. Topor Pop, M. Gyulassy, J. Barrette, C. Gale, S. Vance, et al., Phys.Rev. C68, 054902 (2003), arXiv:nucl-th/0209089 [nucl-th]
- (56) P. Staszel (BRAHMS), Nucl.Phys. A774, 77 (2006), arXiv:nucl-ex/0510061 [nucl-ex]
- (57) I. Arsene et al. (BRAHMS), Phys.Lett. B687, 36 (2010), arXiv:0911.2586 [nucl-ex]
- (58) I. C. Arsene et al., “Production of Identified Charged Hadrons vs. Transverse Momentum and Rapidity in Collisions at = 62.4 and 200 GeV,” To be published
- (59) I. Arsene et al. (BRAHMS), Phys.Lett. B684, 22 (2010), arXiv:0910.3328 [nucl-ex]
- (60) B. B. Abelev et al. (ALICE), Phys. Lett. B736, 196 (2014), arXiv:1401.1250 [nucl-ex]
- (61) P. Bozek and I. Wyskiel-Piekarska, Phys. Rev. C85, 064915 (2012), arXiv:1203.6513 [nucl-th]