Dynamic stratification in drying films of colloidal mixtures
Abstract
In simulations and experiments, we study the drying of films containing mixtures of large and small colloidal particles in water. During drying, the mixture stratifies into a layer of the larger particles at the bottom with a layer of the smaller particles on top. We developed a model to show that a gradient in osmotic pressure, which develops dynamically during drying, is responsible for the segregation mechanism behind stratification.
pacs:
64.75.Xc,68.03.FgSolid thin films on surfaces are often made by spreading a thin liquid film containing solid colloidal particles onto the surface, and allowing the liquid to evaporate Routh (2013). As we have known since the time of Robert Brown Brown (1828), colloidal particles undergo Brownian motion; they diffuse. As a film dries, the water surface falls, pushing the colloidal particles ahead of it. There is then competition between the particles’ Brownian motion and the movement of the surface. The Brownian motion tends to distribute the colloidal particles uniformly in the drying film, while the motion of the surface drives the system out of equilibrium. It is known that this competition determines the distribution of particles on the length-scale of the height of the film Keddie and Routh (2010); Routh and Zimmerman (2004); Trueman et al. (2012). Here we demonstrate a novel self-organization mechanism in colloidal mixtures, which occurs during solvent evaporation. This mechanism separates large and small particles, to form a film stratified by size.
To understand this mechanism, we start by considering the simple case of a film containing only one species of colloidal particle with a diffusion constant . The timescale for diffusion across the height of the film is . During evaporation of the continuous solvent, the top surface moves down with a velocity ; the evaporation timescale is . The competition between these two timescales is quantified by the film formation Péclet number Pe Keddie and Routh (2010); Routh (2013). The drying film is near equilibrium if Pe, i.e., when the timescale for diffusion is smaller than that for evaporation. In this case, evaporation only weakly perturbs the vertical concentration profile, and the profile remains almost uniform at all times. In the other limit, where Pe, diffusion cannot keep up with the moving interface, and particles accumulate near the descending interface at the top of the film Gorce et al. (2002); Ekanayake et al. (2009); Routh and Zimmerman (2004); Keddie and Routh (2010); Routh (2013); Cardinal et al. (2010); Reyes et al. (2007); Cheng and Grest (2013). This description applies to one species of colloidal particle.
However, in paints and inks Keddie and Routh (2010), and often in nanofabrication Rabani et al. (2003); Zhang et al. (2010), there are mixtures of different sizes (and types) of particles. Earlier work has focused on the regime where the film formation Péclet number of the large particles is greater than one, while that of the smaller particles is less than one, and hence large particles form the top layer Luo et al. (2008); Atmuri et al. (2012); Trueman et al. (2012); Nikiforow et al. (2010). There stratification is caused by the different rates at which small and large particles accumulate at the falling interface.
In this letter, we show that in the regime where both film Péclet numbers are much larger than one, there is a generic tendency for the small particles to segregate in a layer on top of the larger particles. This novel stratification mechanism is driven by a gradient of osmotic pressure and is found in both computer simulations and experiment on drying films containing mixtures of small and large colloidal particles. This is a previously unknown example of self-organization in a non-equilibrium process.
Moreover, this type of stratification is highly desirable because it allows the independent control of the properties of the top and the bottom of a coating or self-organized nanostructure. The mechanism differs both from equilibrium phase separation and the out-of-equilibrium Brazil-nut effect Schröter et al. (2006).
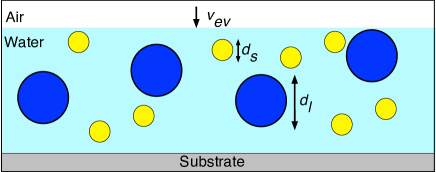
Simulation: Figure 1 illustrates the system under consideration; a two-component colloidal suspension of large and small particles. The films are typically of the order of 1000 particle diameters in height and macroscopic in the other two directions. At the top is the water/air interface and the substrate is at the bottom.
We carried out simulations on a binary mixture of spherical particles with diameters and ; the size ratio . The interaction between particles is that of screened charged particles, which is modeled by a short range repulsive Yukawa interaction. In contrast to the simulation of Liao et al. (2000), our model assumes stable particles over the time scale of the evaporation. The motion of the colloidal particles is simulated by Langevin dynamics Plimpton (1995), which includes Brownian diffusion but neglects hydrodynamic flow. The simulation box has dimensions . To model a part of a large-area film that is far from any edges, we apply periodic boundary conditions in the - and -directions. Evaporation occurs along the vertical, direction. We model the air/water interface by a harmonic potential for the particles, and evaporation is modeled by the potential’s minimum moving downward at a constant velocity , where is the Brownian time, and is the Stokes-Einstein diffusion coefficient of the small particles. This gives a Péclet number for the small particles of 75; that for large particles is times larger. At the bottom we model the static substrate by the purely repulsive part of the Lennard-Jones interaction.
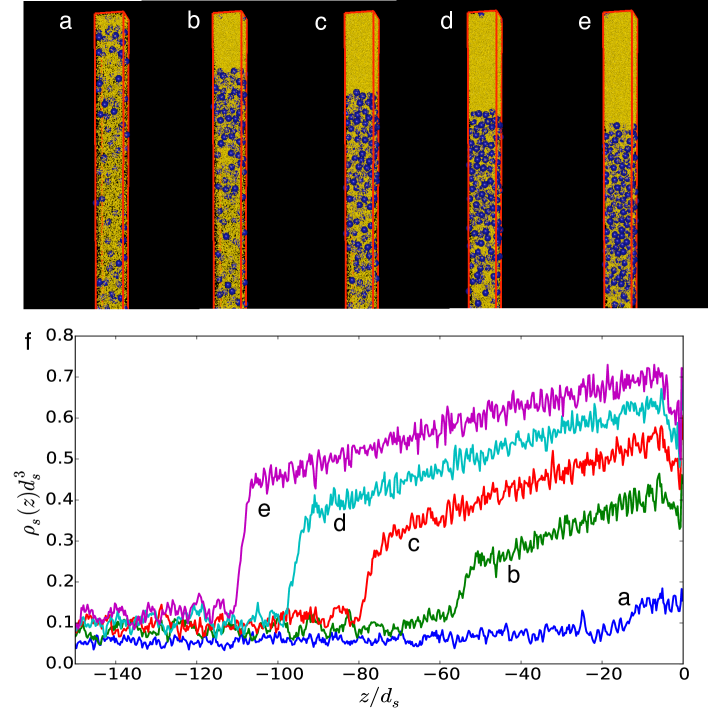
In all cases we start with small and large particles, such that the total initial volume fraction of the mixture . However, we varied the ratio . The system is equilibrated with a static top surface, and after equilibration for a time 100 , the downward movement of the model air/water interface begins. As the interface moves downward at a constant velocity , both small and large particles tend to accumulate below this moving interface. As the interface moves down, an accumulation region forms and grows with time. This is a region where the density is higher and there is a density gradient. A few large and small particles become trapped at the interface because of the effects of surface tension, while particles just below the surface diffuse normally. Inside the accumulation region where there is a density gradient, the large particles move away from the top region, creating a well-defined layer composed of only small particles 111See Fig. 5 in Appendix. The width of the layer depleted of large particles grows in time, as is shown in Fig. 5 of the Appendix. The layer continues to grow as long as the small particles can continuously filter through the large particles. This growth is hindered at higher volume fractions due to the slowing of the dynamics and the jamming of the small particles. The time for the segregation is larger than the time for evaporation for very high initial volume fractions.
The simulations are run until the accumulation front reaches the bottom substrate. The film height is initially and at the end of the simulation it is 222See Appendix for simulation details. We do not examine the later stages of film formation.
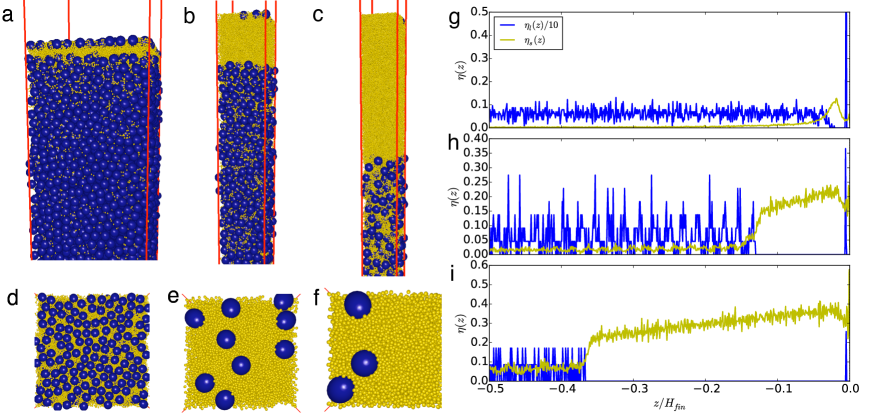
In Fig. 2(a)-(f) we show snapshots of the top portion of the simulation box, taken when the accumulation front has reached the bottom. We see in Fig. 2(c) that the small particles have formed a thick layer at the top that has excluded the larger particles. These larger particles have been pushed down into a separate layer, with smaller particles in the interstitial spaces between the larger particles. The thickness of the layer of small particles at the top of the film is lower when the number of small particles is reduced, as we can see in Fig. 2(a) and (b), but the layer is still present.
Note that equilibrium mixtures of large and small hard spheres with a size ratio of 7:1 are completely miscible in the fluid phase Dijkstra et al. (1999). At high volume fraction there is a broad region of coexistence between a crystal of the large particles and a fluid composed of mainly the small particles. But in our simulations stratification pre-empts crystallization, and this stratificiation is inherently non-equilibrium in nature; it is not due to an underlying equilibrium phase separation.
The stratification effect is general and occurs at different size ratios (Fig. 6) and for a range of initial volume fractions. With high volume fractions, we find a smaller width of the layer of small particles due to jamming effects of the small particle (Fig. 7).
Experiments: Such a striking segregation has not been reported before, therefore we carried out an experimental investigation to confirm the findings. Aqueous blends of colloidally stable acrylic copolymer particles ( = 7) at total volume fraction and varying number ratios were deposited on glass substrates with an initial wet thickness of approximately H = 700 m. We dried the samples at room temperature, leading to Pe14 and 100, for the small and large particles, respectively. After film formation, the final films were characterized by means of atomic force microscopy (AFM) and scanning confocal microscopy. In order to visualize the population distribution of large (385 nm) particles within the sample, they were labelled with a red fluorescent dye (Rhodamine B); the small (55 nm) particles were unlabelled 333See Appendix for details of experiments and particle synthesis.
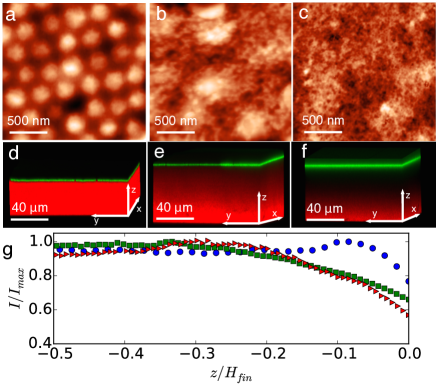
Stratification is clearly seen in Fig. 3, although the layers are less distinct than in our simulations. Compare Fig. 2(g)-(i) to Fig. 3(g). In our experiments, we see stratification for the two mixtures with larger numbers of small particles, and 500 in the confocal images in Fig. 3(e) and (f), respectively. The distribution is uniform with =10.
The surface coverage with small particles seen in the AFM images of Fig. 3(b) and (c) is also consistent with stratification. The AFM images show small particles at the top surface for the number ratios and 500, but not for . Thus for mixtures of particles of size ratio 7:1, we see stratification both in our computer simulations and experiments at sufficiently high number ratios.
Model: In order to understand the segregation of the large and small particles into layers, we develop a physical model. In the evaporating film, density and hence pressure gradients build up (See Fig. 5). These gradients create forces that push particles of all sizes down the gradients, and away from the surface. Segregation results if these forces push the larger particles at faster speeds than the smaller ones. The speed of a particle of diameter depends on the balance between the force on the particle, and the drag .
For simplicity, we will consider the case where a majority species of diameter dominates the osmotic pressure, , but there is a trace amount of a species of a different diameter, .
In the presence of a pressure gradient , the difference in pressure between the top and bottom of a particle of diameter is . So the net downward force on the particle .
The friction coefficient of a particle of diameter is Van den Broeck et al. (1981); Russel et al. (1992). Here is the Stokes friction coefficient, with the viscosity of water. is the sedimentation coefficient, defined as the ratio of the sedimentation velocity at volume fraction to that in its dilute limit.
At any point, the majority species will be pushed away from the interface at speed . Segregation of the tracer particles is determined by their velocity relative to that of the dominant species
| (1) |
At low densities , therefore the downward velocity of tracer particles relative to that of the majority species varies as , i.e., it increases quadratically with the diameter of the tracer particles. Species larger than the majority species move down faster than the majority species, and segregation occurs with the larger particles at the bottom. On the other hand, species smaller than the majority species move down slower than the majority species, resulting in smaller particles accumulating at the top. The functional form of has been the focus of many studies in theory, simulations and experiments Hayakawa and Ichiki (1995); Russel et al. (1992); Bowen et al. (2000) and does not depend on Péclet number Padding and Louis (2004). For Brownian particles, the diameter dependence at high density is , which leads to a segregation velocity that scales as , i.e., it would still lead to stratification. However, at high volume fraction the dynamics of the system slows considerably and the time scale for the segregation mechanism could become larger than the time for solvent evaporation Peppin and Elliott (2006).
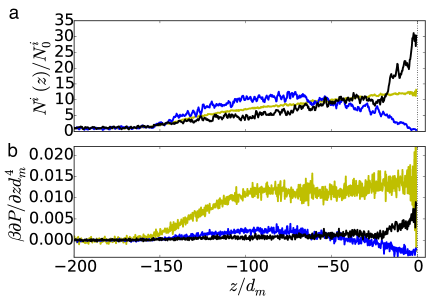
Test of the model: Our simple theoretical model makes a striking prediction: larger particles move down relative to the majority species, while smaller ones move up. This can be independently verified by simulating mixtures with a majority species plus both smaller and larger particles. Therefore, we simulated a ternary mixture of particles: a majority species with diameter , and two minority components with size ratios =0.8 and =1.2. The initial average volume fractions are , , and the evaporation velocity is .
The results for the ternary mixture are shown in Fig. 4. In Fig. 4(a) we see that the moving surface has created gradients in the density and hence in the pressure of the majority species (shown in yellow/light gray), of width . The gradient of the osmotic pressure is plotted in Fig. 4(b). The dominant force is due to the osmotic pressure gradient of the majority species.
The larger species are on average farther from the top surface than the majority species. Note the maximum in their density (shown in blue/dark gray) around below the surface. By contrast, the smaller particles (shown in black) are accumulating near the top surface. As predicted, at our large film formation Péclet numbers, mixtures of particles of different sizes are unstable with respect to stratification into layers, with the smallest particles at the top, and the largest at the bottom.
In our simulations we neglected any effect due to hydrodynamic flow of the solvent. Modeling flow for our systems of many thousands of particles is not computationally feasible. Flow is present in the experiments of course. When the volume fraction of the drying suspension is changing, there will be relative motion of the particles and water, which will generate forces on the particles acting toward the surface. On one hand, these forces will push larger particles toward the surface and counteract the segregation of small particles. On the other hand, the majority species will be pushed toward the surface and create larger osmotic pressure gradients that will enhance segregation. We cannot calculate these forces, but we note that the effect we describe here is very robust in the simulations. Furthermore, we see the effect in experiments where there is hydrodynamic flow of water. Hence, we believe that stratification does occur in the presence of forces due to hydrodynamic flow.
Discussion and Conclusion: In both computer simulations and experiments on drying colloidal mixtures, we found stratification. The smaller particles excluded the larger particles and formed a layer at the top of the drying film. This is a purely out-of-equilibrium effect; it is driven by the moving interface. The moving interface causes a density, and hence a pressure, gradient in the drying film, and this pressure gradient pushes larger particles away from the moving interface faster than it pushes smaller particles. We developed a physical model for this process, and the model correctly predicted the behavior of both small and large particles.
Diverse technologies, including inkjet printing Tekin et al. (2008), coatings on pharmaceutical tablets Obara and McGinity (1995); Lecomte et al. (2004), agricultural treatments on crops Faers and Pontzen (2008); Taylor (2011); Hampton et al. (2012), synthetic latex paints, adhesives Keddie and Routh (2010), and cosmetics (such as sun screen Wissing and Müller (2001)), rely on films derived from mixtures of colloidal particles. Our discovered mechanism will be useful whenever the properties of the top and the bottom of a coating need to be controlled independently via a one-step deposition process.
Appendix A Evolution of density profiles
The evolution of the stratified structure during evaporation and of the related density profiles is shown in Fig. 5.
Appendix B Stratification at different size ratios and initial volume fractions
Snapshots of the final configuration obtained in simulations of binary mixtures with size ratio =2, and 14 are shown in Figure 6. The formation of a top layer depleted of large particles is clearly visible in both cases.
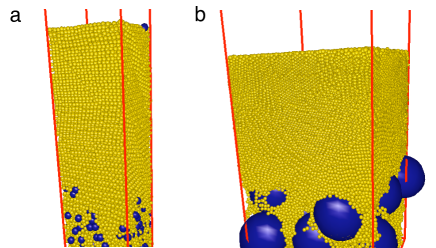
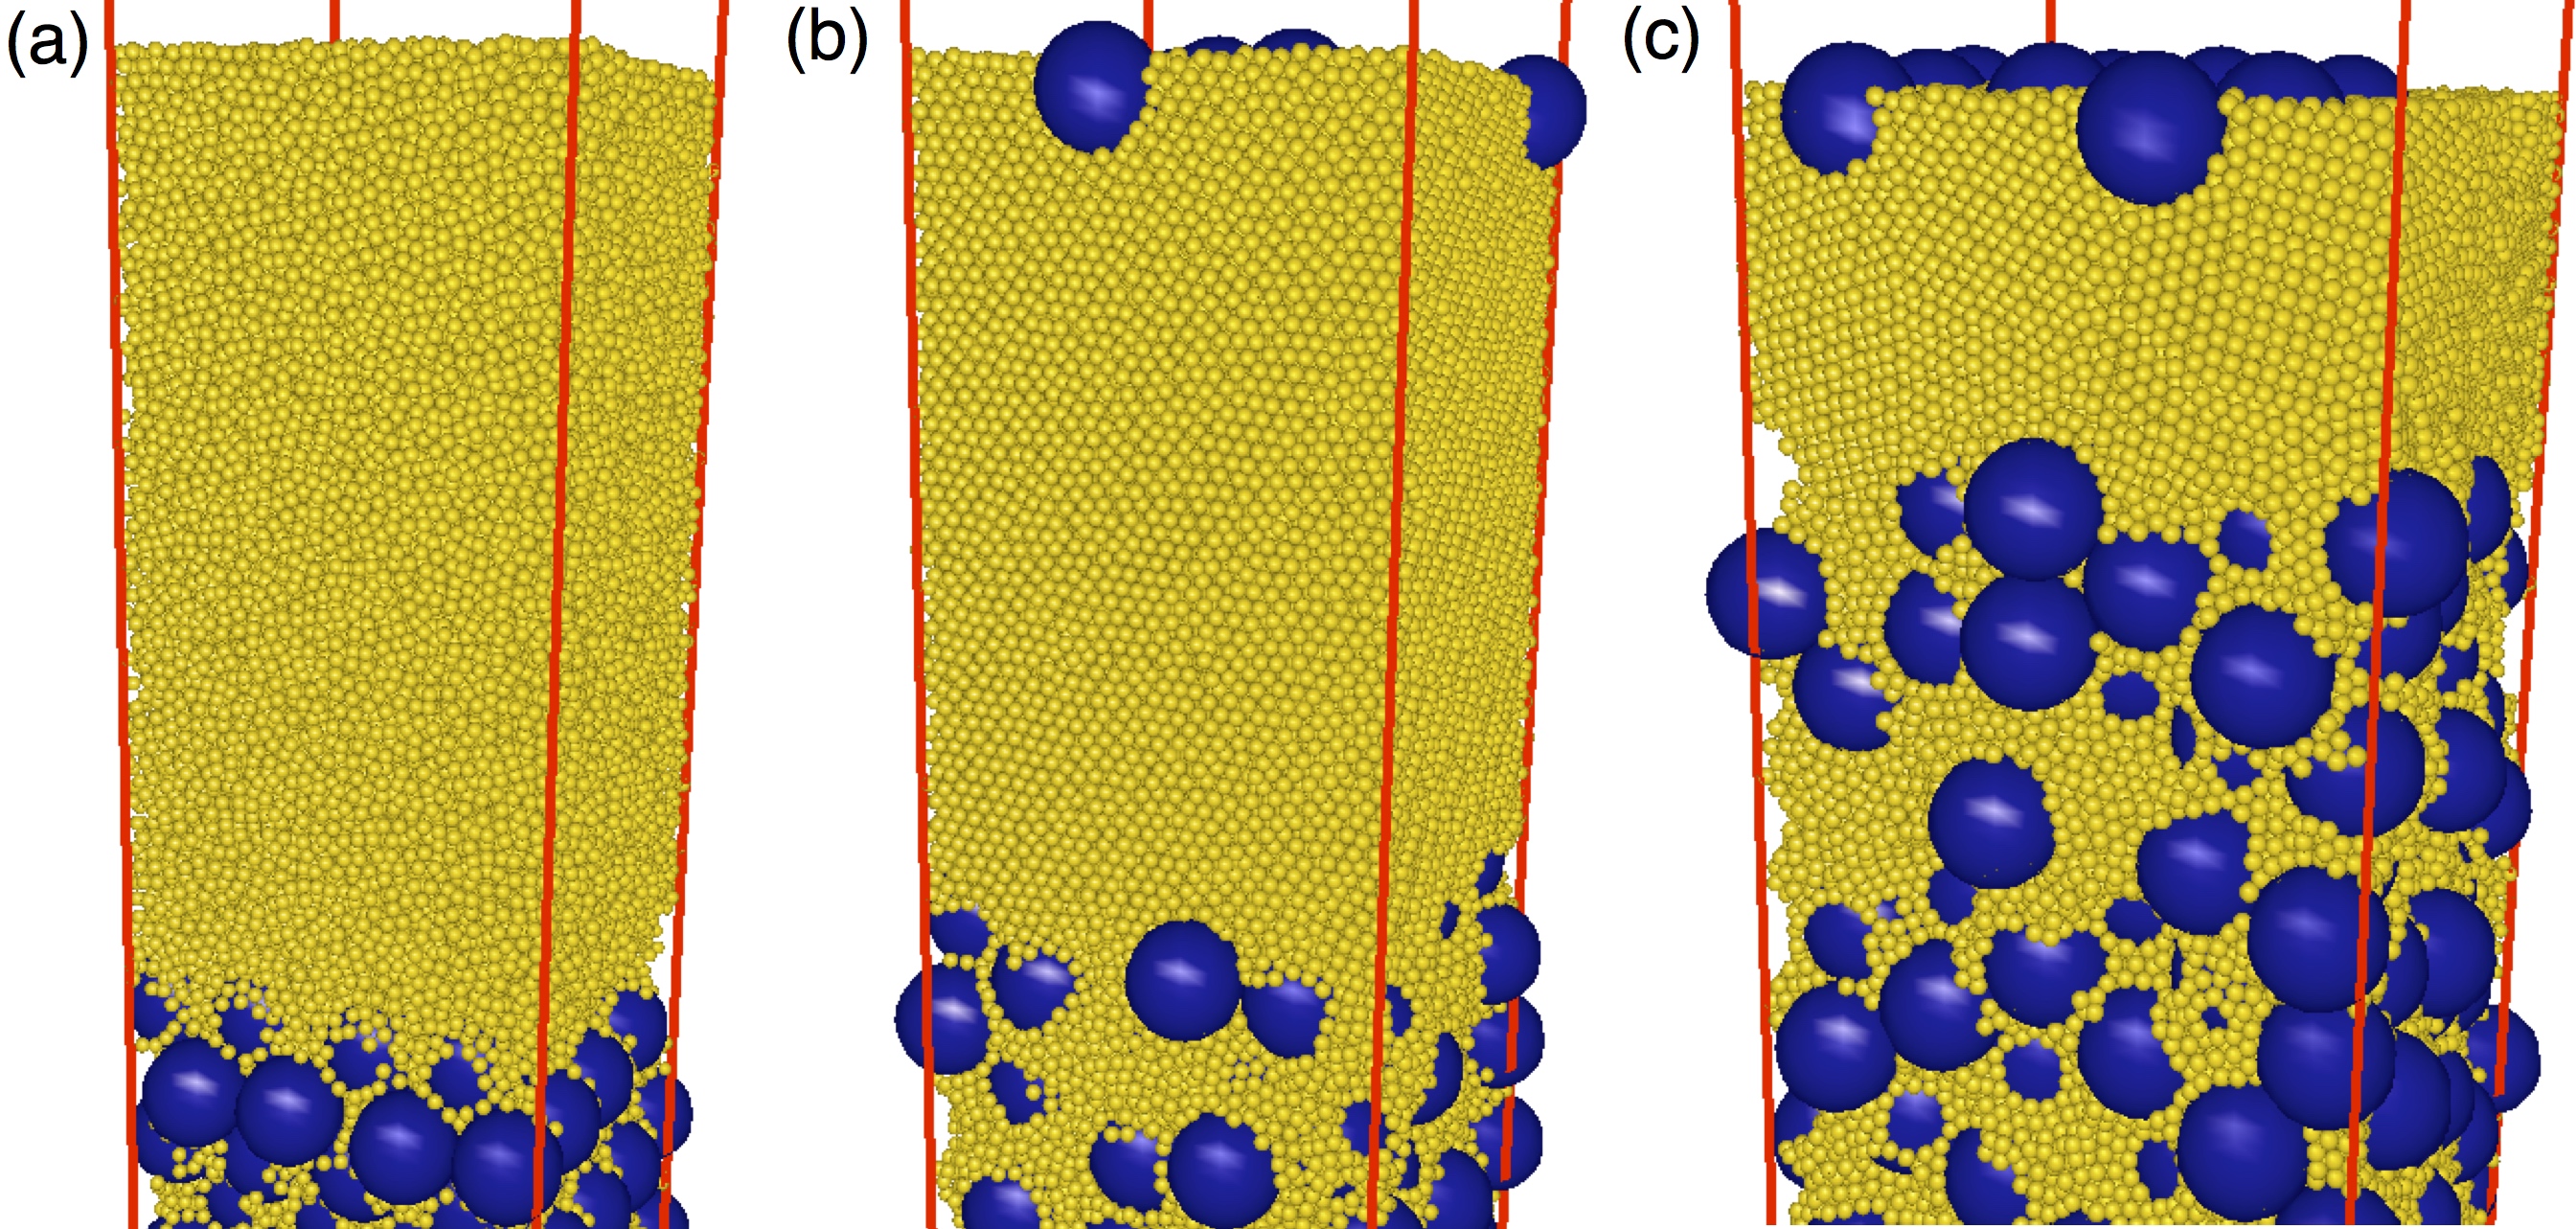
In Fig. 7 we show snapshots of the top regions of the final configurations for initial volume fractions =0.1 (a) =0.2 (b), and =0.4 (c), obtained with an evaporation velocity . The layer with only small particles is visible in the final film layer regardless of the initial volume fraction, but as the initial particle density increase, the segregation mechanism becomes less efficient.
Appendix C Details of the Simulation Method
We run computer simulations of mixtures of spherical particles in a simulation box with dimensions . Periodic boundary conditions are used in the - and -direction, while in the -direction the box is delimited at the bottom by a hard substrate, and at the top by a soft wall, which models an air-water interface. We do not explicitly simulate the solvent water molecules but describe the motion of the colloidal particles using Langevin dynamics, which includes Brownian diffusion effects and neglects hydrodynamic flow. The equation of motion for a particle with diameter , mass at position is
| (2) |
where is the friction coefficient and is the viscosity of the solvent. The term is a random force sampled from a Gaussian distribution with width , where is the Boltzmann constant and the temperature. The Langevin dynamics was carried out using the LAMMPS package Plimpton (1995) with a time step dt = 0.001 = 0.0025 , where is the Brownian time of the small particles, and is the standard Lennard-Jones unit of time in LAMMPS. We also used a friction parameter and a temperature of 40, both in standard Lennard-Jones LAMMPS units.
The interaction energy models screened charged particles, i.e., the interparticle potential energy between particles and , either small or large, of diameters and is a short range Yukawa interaction
| (3) |
where is the centre-to-centre particle distance, is the contact energy, and determines the steepness of the potential. These two parameters influence the overall softness of the potential. In this simulation, we choose and =20. The distance and the cut-off is .
The binary mixture is modeled by small particles with diameter and mass and large particles with diameter and mass . Because of the soft interaction between particles, it is possible to define an effective diameter of the spheres using the Barker-Henderson relation Barker and Henderson (1976)
| (4) |
which gives the distance where the repulsive interaction is of the order of 1 . For our parameters, the effective diameters are and , for large and small particles, respectively. The effective size ratio therefore is =6.04. The model neglects deformability and coalescence of the particles, which can occur when film forming particles are used in experiments.
The interaction between particle with diameter and the hard substrate at the bottom is modeled by
| (5) |
where determines the strength of the repulsive interaction and is the distance of a particle from the substrate.
We model the solvent evaporation process by a moving soft wall, which pushes the particles toward the bottom substrate at constant velocity . The position of the soft-wall (interface) as a function of time is defined by . The interaction between the soft wall and a particle with diameter is described by a harmonic potential, which models the Pickering effect due to the change in interfacial free energy when particles are trapped at a interface Pieranski (1980)
| (6) |
where is the particle coordinate, and determines the contact angle . We have chosen , for large and small particles, respectively. The strength of the air-water interface attraction was chosen to be proportional to the area of the particle, i.e., . Effects like the capillary attraction between the particles trapped at the interface or effective dipolar interactions are neglected in this model.
Appendix D Details of the Experiment
We investigated the room temperature drying of latex particle mixtures experimentally. The initial colloidal dispersions were prepared by blending two acrylic copolymer latices with different mean particle sizes. Both types of particles were mutually repulsive and were colloidally-stable in water initially and when mixed together.
The large particles were made of a copolymer of methyl methacrylate and -butyl acrylate in a weight ratio of 40/60. The initial solids content is 20 wt%. They were synthesized by radical emulsion polymerization using Synperonic NP30 and sodium dodecylsulfate surfactants (99/1 wt% ratio) at a total concentration of 3 g L-1. Sodium persulfate (0.5 wt% relative to monomers) was used as the initiator.
The z-average diameter was determined by dynamic light scattering (DLS) (NanoZS from Malvern Instruments) to =385 nm. These particles were labelled with fluorescent Rhodamine B (0.2 wt% based on monomers). Analysis of the supernatant after centrifugation found that there was no Rhodamine B in the aqueous phase. The particles were stabilized by initiator fragments and a combination of non-ionic and anionic surfactants (with a weight ratio of 99/1).
The small particles are composed of amphiphilic block copolymers obtained by polymerization-induced self-assembly (PISA) Charleux et al. (2012). Controlled radical polymerization (namely, reversible addition-fragmentation chain transfer (RAFT) polymerization) of methacrylic acid (MAA) was performed to obtain firstly a PMAA macroRAFT agent (about 4000 g mol-1) Chaduc et al. (2012a), which was then chain-extended with a mixture of n-butyl acrylate (BA) and styrene (S) (55/45 wt%) to form self-stabilized particles Chaduc et al. (2012b). A z-average diameter =55 nm with a dispersity of 0.064 were measured by DLS. Electrostatic stabilization was provided by anionic sulfate groups contained in the initiator. The pH of the colloidal mixture was measured to be 3.5. At this pH, which is below the value of PMAA’s pKa of 5.5, the PMAA chains at the particle surface are only weakly ionized and are collapsed Wang et al. (2015). Hence, the PMAA is expected to offer neither significant steric stabilization nor charge stabilization.
After blending the calculated amounts of these two dispersions to achieve the desired number ratio, we added deionized water in order to match the initial solids content used in the simulations. The final solids content was always in the range of 9-13 wt.% for all dispersions. Films of these blends were cast on glass substrates ( mm2), previously cleaned with acetone and a UV ozone treatment (Bioforce Nanosciences, model UV.TC.EU.003).
Height and phase images of the top surface of the films were acquired by atomic force microscopy (AFM), using an NT-MDT Ntegra Prima microscope with intermittent contact. Images were analyzed using NOVA software.
A Zeiss LSM510 confocal microscope (on an Axiovert 200M microscope) was used to obtain stacks of plane images at different depths within the sample. A drop of large (750 nm diameter, purchased from Fluoresbrite) green fluorescent particles was cast on top of the dried films. They provided a marker for the top surface position. The green and red fluorochromes were excited using an argon laser (488 nm) and a HeNe laser (543 nm), respectively.Two-dimensional images m2) were acquired every 0.5 m when moving from the substrate at the bottom toward the top of the dry film. Results were analysed using the image processing package Fiji (a version of Image J). The position of the fluorescent green marker particles in the images was used to define the top surface. A second-order polynomial equation was fit to the intensity of the red channel as a function of depth from the surface and then used to define a baseline, to correct for the depth-dependence of the detected intensity. The corrected intensity was normalized by dividing by the maximum intensity in the profile, and the vertical position was normalized by dividing by the film thickness.
Acknowledgements.
We acknowledge funding from the European Union Seventh Framework Programme BARRIER-PLUS project (FP7-SME-2012-2, no. 304758).References
- Routh (2013) A. F. Routh, Rep. Prog. Phys. 76, 1 (2013).
- Brown (1828) R. Brown, Phil. Mag. 4, 161 (1828).
- Keddie and Routh (2010) J. L. Keddie and A. F. Routh, Fundamentals of Latex Film Formation, Processes and Properties (Springer, 2010).
- Routh and Zimmerman (2004) A. F. Routh and W. B. Zimmerman, Chem. Eng. Sci. 59, 2961 (2004).
- Trueman et al. (2012) R. E. Trueman, E. L. Domingues, S. N. Emmett, M. W. Murray, and A. F. Routh, J. Colloid Interface Sci. 377, 207 (2012).
- Gorce et al. (2002) J.-P. Gorce, D. Bovey, P. J. McDonald, P. Palasz, D. Taylor, and J. L. Keddie, Eur. Phys. J. E 8, 421 (2002).
- Ekanayake et al. (2009) P. Ekanayake, P. J. McDonald, and J. L. Keddie, Eur. Phys. J. ST 166, 21 (2009).
- Cardinal et al. (2010) C. M. Cardinal, Y. D. Jung, K. H. Ahn, and L. F. Francis, AIChE J. 56, 2769 (2010).
- Reyes et al. (2007) Y. Reyes, J. Campos-Terán, F. Vázquez, and Y. Duda, Model. Simul. Mater. Sci. Eng. 15, 355 (2007).
- Cheng and Grest (2013) S. Cheng and G. S. Grest, J. Chem. Phys. 138, 064701 (2013).
- Rabani et al. (2003) E. Rabani, D. R. Reichman, P. L. Geissler, and L. E. Brus, Nature 426, 271 (2003).
- Zhang et al. (2010) J. Zhang, Y. Li, X. Zhang, and B. Yang, Adv. Mater. 22, 4249 (2010).
- Luo et al. (2008) H. Luo, C. M. Cardinal, L. E. Scriven, and L. F. Francis, Langmuir 24, 5552 (2008).
- Atmuri et al. (2012) A. K. Atmuri, S. R. Bhatia, and A. F. Routh, Langmuir 28, 2652 (2012).
- Nikiforow et al. (2010) I. Nikiforow, J. Adams, A. M. König, A. Langhoff, K. Pohl, A. Turshatov, and D. Johannsmann, Langmuir 26, 13162 (2010).
- Schröter et al. (2006) M. Schröter, S. Ulrich, J. Kreft, J. Swift, and H. Swinney, Phys. Rev. E 74, 011307 (2006).
- Liao et al. (2000) Q. Liao, L. Chen, X. Qu, and X. Jin, J. Colloid Interface Sci. 227, 84 (2000).
- Plimpton (1995) S. Plimpton, J. Comp. Phys. 117, 1 (1995).
- Note (1) See Fig. 5 in Appendix.
- Note (2) See Appendix for simulation details.
- Dijkstra et al. (1999) M. Dijkstra, R. van Roij, and R. Evans, Phys. Rev. E 59, 5744 (1999).
- Note (3) See Appendix for details of experiments and particle synthesis.
- Van den Broeck et al. (1981) C. Van den Broeck, F. Lostak, and H. Lekkerkerker, J. Chem. Phys. 74, 2006 (1981).
- Russel et al. (1992) W. B. Russel, D. A. Saville, and W. R. Schowalter, Colloidal Dispersions (Cambridge University Press, 1992).
- Hayakawa and Ichiki (1995) H. Hayakawa and K. Ichiki, Phys. Rev. E 51, R3815 (1995).
- Bowen et al. (2000) W. R. Bowen, Y. Liang, and P. M. Williams, Chem. Eng. Sci. 55, 2359 (2000).
- Padding and Louis (2004) J. T. Padding and A. A. Louis, Phys. Rev. Lett. 93, 220601 (2004).
- Peppin and Elliott (2006) S. Peppin and J. Elliott, Journal of Fluid Mechanics 554, 147 (2006).
- Tekin et al. (2008) E. Tekin, P. J. Smith, and U. S. Schubert, Soft Matter 4, 703 (2008).
- Obara and McGinity (1995) S. Obara and J. W. McGinity, International journal of pharmaceutics 126, 1 (1995).
- Lecomte et al. (2004) F. Lecomte, J. Siepmann, M. Walther, R. J. MacRae, and R. Bodmeier, Pharmaceutical Research 21, 882 (2004).
- Faers and Pontzen (2008) M. A. Faers and R. Pontzen, Pest management science 64, 820 (2008).
- Taylor (2011) P. Taylor, Current Opinion in Colloid & Interface Science 16, 326 (2011).
- Hampton et al. (2012) M. A. Hampton, T. A. H. Nguyen, A. V. Nguyen, Z. P. Xu, L. Huang, and V. Rudolph, Journal Of Colloid And Interface Science 377, 456 (2012).
- Wissing and Müller (2001) S. A. Wissing and R. H. Müller, International journal of cosmetic science 23, 233 (2001).
- Barker and Henderson (1976) J. A. Barker and D. Henderson, Mol. Phys. 48, 587 (1976).
- Pieranski (1980) P. Pieranski, Phys. Rev. Lett. 45, 569 (1980).
- Charleux et al. (2012) B. Charleux, G. Delaittre, J. Rieger, and F. D’Agosto, Macromolecules 45, 6753 (2012).
- Chaduc et al. (2012a) I. Chaduc, M. Lansalot, F. D’Agosto, and B. Charleux, Macromolecules 45, 1241 (2012a).
- Chaduc et al. (2012b) I. Chaduc, M. Girod, R. Antoine, B. Charleux, F. D’Agosto, and M. Lansalot, Macromolecules 45, 5881 (2012b).
- Wang et al. (2015) X. Wang, X. Ye, and G. Zhang, Soft Matter 11, 5381 (2015).