On the crystalline structure of orthorhombic SrRuO3: A benchmark study of DFT functionals
Abstract
By investigating the crystalline structure of ground-state orthorhombic SrRuO3, we present a benchmark study of some of the most popular density functional theory (DFT) approaches from the local density approximation (LDA), generalized-gradient approximation (GGA), and hybrid functional families. Recent experimental success in stabilizing tetragonal and monoclinic phases of SrRuO3 at room temperature sheds a new light on the ability to accurately describe geometry of this material by applying first-principles calculations. Therefore, our work is aimed to analyse the performance of different DFT functionals and provide some recommendations for future research of SrRuO3. A comparison of the obtained results to the low-temperature experimental data indicates that revised GGAs for solids are the best choice for the lattice constants and volume due to their nice accuracy and low computational cost. However, when tilting and rotation angles appear on the scene, a combination of the revised GGAs with the hybrid scheme becomes the most preferable option. It is important to note that a worse performance of LDA functional is somewhat compensated by its realistic reproduction of electronic and magnetic structure of SrRuO3, making it a strong competitor if the physical features are also taken into account.
I Introduction
SrRuO3 is a metallic ferromagnetic perovskite-type ruthenate highly valued for its beneficial electrical and magnetic properties, thermal and chemical stability, atomically smooth surface, and a good lattice match with a wide variety of functional oxides [Koster et al., 2012]. In recent years, SrRuO3 has become the most popular epitaxial electrode for complex oxide heterostructures and has been utilized in ferroelectrics, Schottky junctions, magnetocalorics, and magnetoelectrics [Junquera and Ghosez, 2003; Fujii et al., 2005; Thota et al., 2010; Niranjan et al., 2009]. Moreover, it has attracted the attention of superconductor and spintronics communities [Takahashi et al., 2003; Gausepohl et al., 1995; Feigenson et al., 2005]. Reflecting this broad interest, more than 1000 papers involving the physics, materials science, and applications of SrRuO3 have been published over the last two decades [Koster et al., 2012]. But despite all that has been learned, there remain some issues that have not been fully addressed yet.
At ambient conditions, bulk SrRuO3 crystallizes in an orthorhombic () structure and upon heating undergoes phase transitions to tetragonal ( at 820 K) and then to cubic ( at 950 K) systems [Kennedy and Hunter, 1998]. Although one can find several previous theoretical studies [Zayak et al., 2006; Rondinelli et al., 2008; Hadipour and Akhavan, 2011; García-Fernández et al., 2012a; Verissimo-Alves et al., 2012; Zang and Ma, 2013; Miao et al., 2014] in which the ground-state orthorhombic structure is reproduced by density functional theory (DFT) calculations within the local density approximation (LDA), generalized-gradient approximation (GGA), hybrid functional, and even or frameworks, a more detailed and systematic analysis of the obtained results in most cases is missing. This now seems like an obvious gap of knowledge, since the importance of geometry optimization has recently grown to a new level due to the experimental breakthrough in stabilizing tetragonal and/or monoclinic phases of SrRuO3 at room temperature by applying external pressure [Zhernenkov et al., 2013], introducing oxygen vacancies [Lu et al., 2013a, Lu et al., 2013b], and employing compressive and/or tensile strains induced by different substrates [Vailionis, Siemons, and Koster, 2008; Choi et al., 2010; Chang et al., 2011; Vailionis et al., 2011; Herklotz et al., 2013; Kan et al., 2013a, b; Aso et al., 2014; Lu et al., 2015]. As it was noticed by Herklotz . [Herklotz and Dörr, 2015], an ongoing debate on the exact space group symmetry of the strained SrRuO3 films paves the way for the first-principles calculations which can lend a helping hand to the researchers in the laboratory. For example, in the work of Vailionis . [Vailionis et al., 2011] the authors state that a tensile strained SrRuO3 thin film most likely possesses a rather than space group symmetry, but the subtle differences between these two phases are too small to be detected experimentally. From a theoretical standpoint, this issue could be more or less painlessly resolved by carefully performing geometry optimization at the DFT level. What is more, geometry optimization also plays a significant role in theoretical modelling the electronic structure of SrRuO3 films grown on SrTiO3 substrates at the ultrathin limit [Mahadevan et al., 2009; Gupta, Mandal, and Mahadevan, 2014; Si et al., 2015]. However, in order to effectively employ DFT approaches for the strained systems, initially one should get acquainted with their side-by-side performance comparison produced for the ground-state configuration.
In this study, we have systematically investigated the crystalline structure of SrRuO3 and compared obtained results with the low-temperature experimental data. From a theoretical point of view, we have comprised three rungs of the Jacob’s ladder of DFT approximations [Perdew et al., 2005] – the first, second, and fourth – by applying LDA, GGAs, and hybrid functionals that are widely used for the solid-state calculations. The third rung of the ladder assigned for the meta-GGAs, which in turn consider kinetic-energy density as an additional variable, was not taken into account, since promising meta-GGAs for solids, like revTPSS [Perdew et al., 2009], are still not implemented in many of the popular DFT codes. We have distinguished structural parameters into three categories, namely, (a) lattice constants and volume, (b) tilting and rotation angles, and (c) internal angles and bond distances within RuO6 octahedra. On one hand, it is well known that lattice constants and volume are critically important for many inherent material properties – including phonon frequencies, elastic constants, ferromagnetism, and the possibility of structural phase transitions [Csonka et al., 2009, Haas et al., 2010] – and therefore deserve an exceptional attention. On the other hand, it has been shown that octahedral rotations and tilts in the strained SrRuO3 thin films are a key factor for determining their functionalities and possible applications [Lu et al., 2013b, Vailionis et al., 2011, Kan et al., 2013a, Lu et al., 2015]. Experimental recognition of epitaxially stabilized tetragonal structures with no octahedral rotations, but with octahedral deformations introduced instead [Kan et al., 2013b, Aso et al., 2014] encourages to focus on the internal parameters of octahedra. As the electrical and magnetic properties of these thin films were discovered to exhibit a close relationship with the strain-induced octahedral deformations, we also found it important to check the performance of DFT approaches in reproducing the ground-state geometry of RuO6. For the sake of completeness, we have additionally presented the electronic structure and magnetic moment of SrRuO3 which allow us to demonstrate the versatility of the tested functionals in the context of physical features.
II Theoretical background
In the LDA framework [Dirac, 1930], the exchange energy has the form
| (1) |
where denotes the electron density and is the exchange energy density per particle for a uniform electron gas. The GGA form for the exchange energy is simply
| (2) |
in which (with Fermi wave vector ) is the dimensionless reduced gradient and is the exchange enhancement factor. Any GGA that reproduces the uniform gas limit can be expressed as [Perdew et al., 2008]
| (3) |
and accordingly
| (4) |
where the gradient expansion (GE) that is precise for slowly-varying electron gases has [Antoniewicz and Kleinman, 1985]
| (5) |
The PBE GGA [Perdew, Burke, and Ernzerhof, 1996] is nowadays considered as a standard functional for solid-state calculations [Haas et al., 2009]. Although this GGA belongs to the class of parameter-free functionals, it still contains some arbitrary choices, e.g., the analytical form of the enhancement factor or the constraints that have to be satisfied. It has been shown [Perdew et al., 2008, Perdew et al., 2006] that in order to obtain the accurate exchange energy for free neutral atoms, any GGA must have . For the PBE functional, is set to 0.2195 from slightly different requirement which is based on the reproduction of the LDA jellium response. Here, has the form
| (6) |
The parameter , which controls behaviour at , is set to 0.804 according to the relation to ensure the Lieb-Oxford (LO) bound [Lieb and Oxford, 1981], which is an upper limit on the ratio of the exact exchange-correlation energy to the value of the LDA approximation of the exchange energy with . At the limit of a slowly-varying high density, the GE for the correlation energy of a GGA can be written as
| (7) |
where is the correlation energy per particle of the uniform electron gas, is a coefficient set to 0.0667 [Ma and Brueckner, 1968], and (with Thomas-Fermi screening wave vector ) denotes an appropriate reduced density gradient for correlation. In the PBE correlation functional, the value of is retained, whereas in PBEsol [Perdew et al., 2008], it is chosen to be 0.046 in order to reproduce the accurate exchange-correlation energy for a jellium surface obtained at the meta-GGA TPSS [Tao et al., 2003] level. In the PBEsol exchange functional, the value of , which determines behaviour for , is restored back to , since it has been argued [Perdew et al., 2008] that is harmful for many condensed matter applications. This choice allows to recover the second-order GE, but on the other hand, it means that PBEsol no longer satisfies the LDA jellium response, because . Thus, as , there is no complete cancellation between beyond-LDA exchange and correlation contributions. While constructing the PBE functional, this sort of cancellation was believed to be more accurate than the lower-order gradient expansion for small . Although PBE works equally well for finite and infinite systems [Haas et al., 2009], PBEsol outperforms it in various crystalline structure calculations. Nevertheless, this benefit is accompanied by a worsening of the thermochemical properties [Zhao and Truhlar, 2008]. It is evident that due to pretty simple mathematical form of GGA one has to choose between improved atomization energies of molecules or improved lattice parameters of solids [Haas et al., 2010].
The SOGGA exchange functional [Zhao and Truhlar, 2008], used in combination with the PBE correlation functional, completely restores the GE to the second order for both exchange and correlation. The analytical form of the SOGGA exchange enhancement factor is expressed as an average of the PBE and RPBE [Hammer, Hansen, and Nørskov, 1999] exchange functionals
| (8) |
in which . The parameter is set to 0.552 in order to satisfy a tighter LO bound with .
The WC exchange enhancement factor is given by [Wu and Cohen, 2006]
| (9) |
where
| (10) |
Parameters and have the same values as in PBE and is set to recover the fourth order parameters of the fourth order GE of the exchange functional for small (unfortunately, incorrectly [Haas et al., 2009]). On the whole, the analysis of a large set of solids [Haas, Tran, and Blaha, 2009] shows that concerning the lattice constants PBEsol, SOGGA, and WC perform quite similarly, and in most cases demonstrate an explicit improvement over the typically underestimated and overestimated values of LDA and PBE, respectively.
It is interesting to note that for some solids the overestimated lattice constants can be improved by including a fraction of the exact Hartree-Fock (HF) exchange energy [Paier et al., 2006; Paier, Marsman, and Kresse, 2007; Marsman et al., 2008]. Among the so called hybrid functionals, PBE0 [Adamo and Barone, 1999] is defined by
| (11) |
where the amount of mixing coefficient has been derived from theoretical arguments through the perturbation theory. However, due to the slow decay of the HF exchange interaction, which in some cases can reach up to hundreds of angstroms, the evaluation of may be computationally very demanding. Fortunately, it was demonstrated [Heyd and Scuseria, 2004] that the screened HF exchange, in which the computationally expensive long-range part is replaced by a corresponding PBE counterpart, exhibits all physically relevant properties of the full HF exchange. The resulting expression for the exchange-correlation energy, known as HSE06 [Krukau et al., 2006], is given by
| (12) |
Here, (SR) and (LR) denote the short- and long-range parts of the respective exchange interactions. The separation of them is achieved through a partitioning of the Coulomb potential for exchange
| (13) |
where , and is the screening parameter that defines the separation range. For , the PBE0 functional is recovered, and for , HSE06 becomes identical to PBE. The value of the screening parameter bohr-1 was chosen as a reasonable compromise between computational cost and the quality of the results which, regarding the lattice constants, are similar to those obtained using the PBE0 functional [Marsman et al., 2008].
Interestingly, it appears that the accuracy of the lattice constants can be increased for both screened and non-screened hybrid schemes by substituting the PBE functional with the ones revised for solids. For the screened hybrids, the HSEsol functional [Schimka, Harl, and Kresse, 2011] was introduced which has the same form (see Eq. 12) and the same range-separation parameter as HSE06, but it is based on PBEsol for the exchange as well as correlation part. Concerning the non-screened hybrids, the B1WC functional [Bilc et al., 2008] – which is in turn based on the PBE0 scheme (see Eq. 11) with the PBE exchange and correlation correspondingly replaced by WC and PW [Perdew et al., 1992], and parameter set to 0.16 – also shows promising results, especially for the perovskite-structured materials [García-Fernández et al., 2012b].
III Computational details
The ferromagnetic state of low-temperature orthorhombic SrRuO3 was modelled with the CRYSTAL14 code [Dovesi et al., 2014] employing a linear combination of atom-centered Gaussian orbitals. The small-core Hay-Wadt pseudopotentials [Hay and Wadt, 1985] were utilized to describe the inner-shell electrons () of Sr and Ru atoms. The valence part of the basis set for Sr () was adopted from the SrTiO3 study [Piskunov et al., 2004], while the valence functions for Ru () were taken from our previous work on non-stoichiometric SrRuO3 [Masys et al., 2013]. Regarding the O atom, the all-electron basis set with a double set of functions was applied from the CaCO3 study [Valenzano et al., 2006]. All these aforementioned basis sets are also available online at CRYSTAL’s basis sets library [cry, ].
While performing full geometry optimization, the default values were chosen for most of the technical setup, the details of which can be found in CRYSTAL14 user’s manual [Dovesi et al., ]. However, the parameters that define the convergence threshold on total energy and truncation criteria for bielectronic integrals were tightened to (8) and (8 8 8 8 16), respectively. Besides, the allowed root-mean-square values of energy gradients and nuclear displacements were correspondingly set to more severe ones: 0.00006 and 0.00012 in atomic units. In order to improve the self-consistence field convergence, the Kohn-Sham matrix mixing technique (at ) together with Anderson’s method [Anderson, 1965], as proposed by Hamman [Hamann, 1979], were applied. The reciprocal space was sampled according to regular sublattice with a shrinking factor of 8, resulting in 125 independent k points in the first irreducible Brillouin zone.
We would like to remark that in this paper instead of the original PW functional the correlation part from the PBE framework was taken for the modified B1WC calculations, named as mB1WC. In the meantime, LDA exchange was combined with VWN correlation [Vosko, Wilk, and Nusair, 1980], whereas PBE, SOGGA, and WC exchange functionals were used with the correlation part of PBE. The PBEsol exchange functional was employed with the correlation part of PBEsol and PBE. A separate notation PBEsolPBE was introduced for the latter combination.
IV Results and discussion
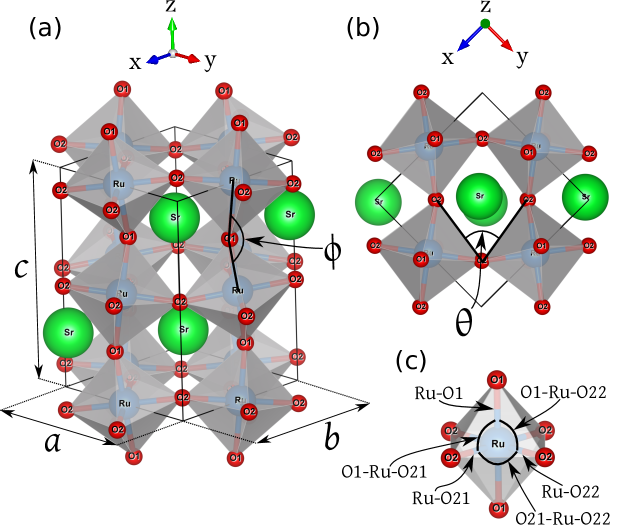
For the sake of clarity, the geometry of ground-state SrRuO3 is visualized in Fig. 1. The equilibrium structural parameters and magnetic moment calculated within different DFT approximations are given in Table 1. The low-temperature experimental data are also presented therein, however, no zero-point anharmonic expansion (ZPAE) corrections were applied. On one hand, it is not straightforward to evaluate ZPAE corrections for the non-cubic systems. On the other hand, ZPAE should not have a noticeable influence on material like SrRuO3. Our previous non-magnetic calculations [Masys and Jonauskas, 2013] indicate that ZPAE correction for the lattice constant of cubic SrRuO3 reaches at most and therefore can be treated as negligible. The given mean absolute relative errors (MAREs) were evaluated according to the expression
| (14) |
in which and are the calculated and experimental values of the considered parameter, respectively. Note that in the literature tilting and rotation angles of RuO6 octahedra are usually defined through the corresponding relations with and :
| (15) |
| (16) |
But in this study, and are themselves denoted as tilting and rotation angles, since – as it can be seen from Fig. 1 – they can be measured directly. The derived values of and would simply distort the provided statistics in regard to other structural parameters.
| LDA | PBE | PBEsol | PBEsolPBE | SOGGA | WC | mB1WC | PBE0 | HSE06 | HSEsol | Expt. | |
|---|---|---|---|---|---|---|---|---|---|---|---|
| 5.530 | 5.644 | 5.577 | 5.568 | 5.565 | 5.580 | 5.555 | 5.557 | 5.564 | 5.534 | 5.566 | |
| (0.64) | (1.40) | (0.20) | (0.04) | (0.01) | (0.26) | (0.20) | (0.17) | (0.03) | (0.58) | ||
| 5.490 | 5.623 | 5.549 | 5.538 | 5.534 | 5.553 | 5.512 | 5.580 | 5.572 | 5.503 | 5.532 | |
| (0.76) | (1.65) | (0.31) | (0.10) | (0.04) | (0.38) | (0.36) | (0.86) | (0.72) | (0.52) | ||
| 7.787 | 7.970 | 7.871 | 7.858 | 7.854 | 7.877 | 7.831 | 7.915 | 7.915 | 7.839 | 7.845 | |
| (0.74) | (1.59) | (0.33) | (0.16) | (0.11) | (0.41) | (0.18) | (0.89) | (0.90) | (0.07) | ||
| 236.41 | 252.94 | 243.58 | 242.30 | 241.90 | 244.08 | 239.78 | 245.39 | 245.40 | 238.75 | 241.56 | |
| (2.13) | (4.71) | (0.84) | (0.31) | (0.14) | (1.04) | (0.73) | (1.58) | (1.59) | (1.16) | ||
| 159.31 | 159.26 | 159.76 | 159.98 | 159.97 | 159.58 | 161.24 | 159.10 | 159.71 | 161.09 | 161.99 | |
| (1.66) | (1.69) | (1.38) | (1.24) | (1.25) | (1.49) | (0.46) | (1.78) | (1.41) | (0.56) | ||
| 75.08 | 74.20 | 74.28 | 74.43 | 74.40 | 74.21 | 76.20 | 74.73 | 75.17 | 76.18 | 77.31 | |
| (2.88) | (4.03) | (3.92) | (3.73) | (3.76) | (4.01) | (1.43) | (3.34) | (2.78) | (1.46) | ||
| Ru-O1 | 1.979 | 2.026 | 1.999 | 1.995 | 1.994 | 2.001 | 1.984 | 2.012 | 2.010 | 1.987 | 1.986 |
| (0.34) | (2.00) | (0.65) | (0.45) | (0.40) | (0.76) | (0.08) | (1.32) | (1.23) | (0.06) | ||
| Ru-O21 | 1.983 | 2.030 | 2.004 | 1.999 | 1.998 | 2.005 | 1.986 | 1.979 | 1.979 | 1.961 | 1.986 |
| (0.13) | (2.24) | (0.89) | (0.66) | (0.61) | (0.98) | (0.02) | (0.36) | (0.33) | (1.24) | ||
| Ru-O22 | 1.981 | 2.028 | 2.001 | 1.997 | 1.996 | 2.003 | 1.984 | 2.023 | 2.020 | 1.997 | 1.987 |
| (0.30) | (2.03) | (0.70) | (0.49) | (0.44) | (0.79) | (0.16) | (1.81) | (1.65) | (0.48) | ||
| O1-Ru-O21 | 90.20 | 90.04 | 90.16 | 90.20 | 90.21 | 90.14 | 90.15 | 90.99 | 90.88 | 90.69 | 90.33 |
| (0.15) | (0.32) | (0.20) | (0.15) | (0.14) | (0.22) | (0.20) | (0.72) | (0.61) | (0.39) | ||
| O1-Ru-O22 | 90.46 | 90.25 | 90.33 | 90.38 | 90.39 | 90.33 | 90.39 | 89.83 | 90.03 | 90.51 | 90.27 |
| (0.21) | (0.02) | (0.06) | (0.12) | (0.13) | (0.07) | (0.14) | (0.49) | (0.27) | (0.26) | ||
| O21-Ru-O22 | 91.38 | 91.17 | 91.19 | 91.21 | 91.21 | 91.21 | 91.24 | 90.75 | 90.87 | 91.21 | 91.07 |
| (0.35) | (0.12) | (0.14) | (0.16) | (0.16) | (0.16) | (0.19) | (0.35) | (0.21) | (0.15) | ||
| 1.70 | 1.96 | 1.92 | 1.93 | 1.93 | 1.94 | 2.00 | 2.00 | 2.00 | 2.00 | 1.63 | |
| MARE1 | 1.07 | 2.34 | 0.42 | 0.15 | 0.08 | 0.52 | 0.37 | 0.88 | 0.81 | 0.58 | |
| MARE2 | 2.27 | 2.86 | 2.65 | 2.49 | 2.50 | 2.75 | 0.95 | 2.56 | 2.09 | 1.01 | |
| MARE3 | 0.25 | 1.12 | 0.44 | 0.34 | 0.31 | 0.50 | 0.13 | 0.84 | 0.72 | 0.43 | |
| MARE | 0.86 | 1.82 | 0.80 | 0.64 | 0.60 | 0.88 | 0.34 | 1.14 | 0.98 | 0.58 |
IV.1 Lattice constants and volume
We start with the lattice constants and volume, and a careful look at Table 1 reveals that LDA and PBE functionals tend to underestimate and overestimate these parameters, respectively, with LDA being substantially closer to the experiment than PBE. The revised functionals for solids – PBEsol, PBEsolPBE, SOGGA, and WC – demonstrate an explicit improvement over the results of LDA and PBE. That is not very surprising, though, since the same tendency was already noticed for a large set of solids [Haas, Tran, and Blaha, 2009]. Among the revised functionals, PBEsolPBE and SOGGA show the best performance with the corresponding MARE1 values of 0.15 and . Having in mind that “good” theoretical deviations should not exceed [Haas, Tran, and Blaha, 2009], these numbers appear to be truly impressive. The numbers of PBEsol () and WC () can also be considered as good, while LDA () and PBE () exceed the critical value of what we call a satisfactory threshold, in this work set to . Interestingly, the inclusion of of the exact HF exchange – as it is in the PBE0 scheme – has a noticeable influence on the performance of PBE functional, since MARE1 now gets reduced from unacceptable to a satisfactory value of . The additional rejection of the long-range HF exchange in the HSE06 approximation has a small but positive effect, with MARE1 being further improved to . However, the combination of HSE-type framework and PBEsol-type revision seems to be the best choice among hybrids (HSEsol with ), unless the amount of full-range HF exchange is reduced to and PBEsol functional is interchanged with WC counterpart (mB1WC with ). Notice that these two hybrids, together with LDA, also have some potential to benefit from ZPAE corrections, as their lattice constants and volume are slightly lower compared to experimental data. In the meantime, all the remaining functionals practically have no room for improvement, with their structural parameters being higher than experimental ones. A further comparison to the results of and schemes, presented in the corresponding works of Verissimo-Alves [Verissimo-Alves et al., 2012] and Zang [Zang and Ma, 2013], indicates that the introduction of electron correlation corrections to the Ru orbitals has a minor influence on the performance of their respective parent functionals, LDA and PBE, since MARE1 for reaches , whereas for . These numbers are very close to our LDA and PBE values, besides, the typical behaviour to underestimate and overestimate lattice parameters also remains unaffected. It appears that the inclusion of the Hubbard term is not an effective option for a better description of SrRuO3 geometry, at least for the considered values of .
IV.2 Tilting and rotation angles
As it was already noted by García-Fernández [García-Fernández et al., 2012b] for a variety of perovskites, calculation of tilting and rotation angles involves energy changes that are much more subtle than those associated with lattice parameters, therefore relative errors of DFT approaches become more pronounced. And indeed, Table 1 clearly demonstrates that deviations from experiment are much larger than previously discussed ones, especially for the rotation angle . Revisions made to PBEsol, SOGGA, and WC approximations have a quite small positive impact on the performance of PBE and, what is more surprising, are sufficient to outperform LDA only for the tilting angle . The results of revised functionals fall within the inner range between MARE2 values of LDA () and PBE (), which are far above our satisfactory threshold. It is worth mentioning that PBE0 () and HSE06 () hybrids do not essentially ameliorate the situation, although in this case the rejection of the long-range HF exchange shows slightly more pronounced influence compared to the HSE06 numbers for lattice constants and volume. However, the most interesting observation is that neither enhancement factor revision nor inclusion of a portion of exact exchange is able to alone improve the results of PBE to an acceptable level. Only a combination of both has an effect large enough to reduce MARE2 to values near a satisfactory threshold, like for HSEsol and for mB1WC hybrids. This is a somewhat unexpected trend, once again confirming that variations in tilting and rotation angles are extremely energetically sensitive and difficult to accurately reproduce. An additional comparison to the [Verissimo-Alves et al., 2012] performance with its MARE2 reaching indicates that a Hubbard-type electron correlation correction is negligible, as we have already remarked from the analysis of lattice parameters.
IV.3 Internal geometry of octahedra
In contrast to the tilting and rotation angles, the internal parameters of RuO6 octahedra are reproduced with commendable accuracy. Even the PBE functional – the worst performer so far – yields reasonable results with its MARE3 reaching , which is just slightly above the satisfactory threshold. The rest of the GGAs, on the other hand, do not exceed for MARE3 but their good execution remains a bit worse compared to that of LDA (), especially for the bond distances Ru-O. However, the same cannot be said about the results of [Verissimo-Alves et al., 2012] framework, despite the fact that our previous analysis of lattice parameters and interoctahedral angles revealed only a small difference between LDA and performance. In this case, MARE3 for increases to , and that is the most prominent discrepancy noticed for these two methods. It is no longer surprising that the inclusion of a portion of HF exchange has a positive impact on the results of PBE with MARE3 being reduced to for PBE0 and for HSE06. Although the interchange with PBEsol functional gives even a better effect (HSEsol with ), the closest resemblance to the experiment was demonstrated by mB1WC hybrid with its excellent MARE3 value of . One can note that mB1WC is able to outperform LDA for practically every parameter of RuO6. On the whole, the performance of all presented functionals can be considered as rather good and, to be honest, that is not a very astonishing trend. Octahedral deformations in SrRuO3 are very energetically costly [Lu et al., 2015], therefore large energy variations involved in RuO6 geometry optimization are easier to deal with for a variety of DFT approximations.
IV.4 Overall performance
The values of MARE reflect the overall performance of tested functionals in reproducing the ground-state crystalline structure of SrRuO3 by taking into account both the internal geometry of the unit cell and lattice parameters. From Table 1 it is seen that despite its well-known versatility for finite and infinite systems the original PBE approach undoubtedly remains the last selection among all the contestants. Its MARE value of practically two times exceeds our satisfactory threshold, and even the incorporation of of the exact full-range HF exchange does not help to achieve desired MARE (PBE0 with ). On the other hand, the screening of HF exchange in the HSE-type framework is effective enough to improve MARE to a satisfactory result (HSE06 with ), although the difference between the performance of these two hybrids is not very significant. The more surprising result is demonstrated by LDA functional, since its value of is not only noticeably smaller than that of [Verissimo-Alves et al., 2012] scheme () – conclusively convincing that the Hubbard term is unnecessary for the geometry optimization of bulk SrRuO3, – but is also more or less of the same magnitude as MARE of revised WC () and PBEsol () approximations. The initial advantage of these two GGAs obtained while reproducing lattice constants and volume is gradually lost when internal geometry of SrRuO3 is taken into consideration. And yet, the combination of and as well as modifications present in appear to be sufficiently fruitful to bring respective MARE of PBEsolPBE () and SOGGA () close to “good” theoretical values (). A similar result is also yielded by HSEsol hybrid (), but in this case the largest benefit is derived from the superior reproduction of tilting and rotation angles. However, a MARE value of apparently speaks of the best overall performance which belongs to the mB1WC hybrid – the only functional that tightly satisfied the criterion for all four considered MAREs. Moreover, the values of MARE, MARE, and MARE are found to be below threshold confirming its perfect suitability for the complete description of the crystalline structure of SrRuO3.
An analysis of previous study in which the older version of CRYSTAL code was employed [García-Fernández et al., 2012a] reveals that MARE values of DFT results provided therein (LDA, PBE, PBEsol, WC, PBE0, mB1WC) are worse compared to ours on average by about . We believe that the most probable source of this discrepancy lies in the basis sets utilized in the calculations and therefore has nothing to do with versions of the CRYSTAL code. Since basis set for Sr is well-tested and identical in both studies, basis sets for O are of the same reliable quality, the factor that remains is the difference between the basis sets for Ru. We have adopted a valence part specially optimized for SrRuO3, and it seems that our choice paid off, even despite the tighter convergence criteria applied in the work of García-Fernández On the other hand, a direct comparison to the previous plane-wave based LDA calculations, carried out by three groups using two distinct packages [Zayak et al., 2006, Rondinelli et al., 2008, Miao et al., 2014], shows a good agreement with the tendencies of LDA noticed in our study: MARE, MARE, and MARE. A somewhat worse overall performance of these works (Zayak with MARE, Rondinelli with MARE, Miao with MARE) could be influenced by different technical parameters, specific selection of parametrization, and even the way the DFT functionals are implemented in a particular code [Grånäs et al., 2014].
IV.5 Electronic and magnetic structure
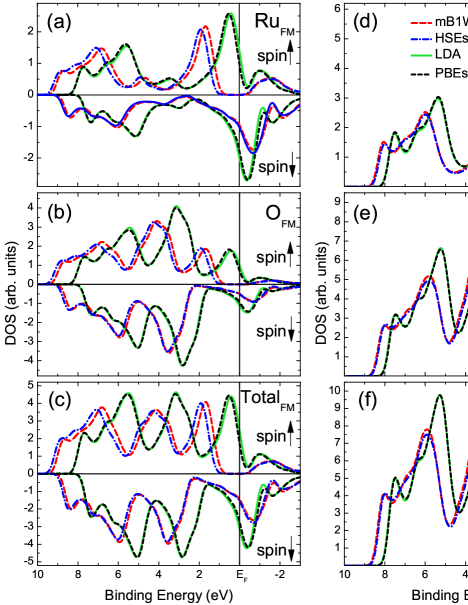
The calculated electronic structure and magnetic moment of SrRuO3 can be found in Fig. 2 and Table 1, respectively. We have applied the experimental geometry while investigating these properties, since it allows us to eliminate the differences that may rise due to the non-equivalent lattice parameters, distorting the direct comparison between the performance of tested DFT approaches. Our decision was motivated by the work of Grånäs [Grånäs et al., 2014] in which the calculated magnetic moments appeared to be quite sensitive to the chosen equilibrium volume of SrRuO3. In addition, we have excluded several functionals from Fig. 2 leaving only those that satisfied the of MARE criterion and reflected the typical behaviour of the particular rung of the ladder. Therefore, the remaining functionals represent LDA, GGA (PBEsolPBE), and hybrid approximations with a fraction of HF exchange set to (mB1WC) and (HSEsol). Concerning the electronic structure, the NM density of states (DOS) indicates that valence band of SrRuO3 is formed by strongly hybridized Ru and O orbitals, with the former ones being dominant in the vicinity of and the latter ones being more pronounced at higher binding energy regions. The position of the main peaks and shape of the spectra are in a good overall agreement with some recent ultraviolet and x-ray photoemission spectroscopy measurements [Kim, Chung, and Oh, 2005; Toyota et al., 2005; Grebinskij et al., 2013], and this result only quantitatively depends on the choice of the functional. One can note that performance of LDA and GGA in reproducing NM DOS is identical, while hybrids demonstrate a suppression of electronic states at and a spectral shift of 0.5 eV for higher binding energies. However, the picture becomes qualitatively different when energetically more favourable FM solution appears on the scene. In this case, not only does the spectral shift get more pronounced for the mB1WC and HSEsol schemes, but also a band gap opens in the spin-up channel paving the way for the half-metal state in which conduction of the system is assured solely by the spin-down electrons. In the meantime, LDA and GGA frameworks continue to demonstrate metallic behaviour, as their first peak in the spin-up channel clearly crosses . A careful look at the FM part of Fig. 2 reveals that LDA exhibits a larger overlap of the spin-up and spind-down bands at compared to that of GGA, and this is also reflected in the values of magnetic moment in Table 1: versus per formula unit. If one would take into account experimental uncertainty, could practically ideally match the provided result of magnetization measurement in SrRuO3. Hybrids, on the other hand, yield a saturated magnetic moment of 2 per formula unit which has not been reported from the laboratories so far. Thus, as long as the experimental observation of half-metallicity and the saturation of magnetic moment remains a serious challenge [Verissimo-Alves et al., 2012], LDA seems to be the functional of choice for the realistic reproduction of electronic and magnetic structure of SrRuO3. This outcome is also confirmed by different basis set, for instance, plane-waves [Miao et al., 2014] or muffin-tin orbitals [Grånäs et al., 2014], calculations.
IV.6 Final remarks
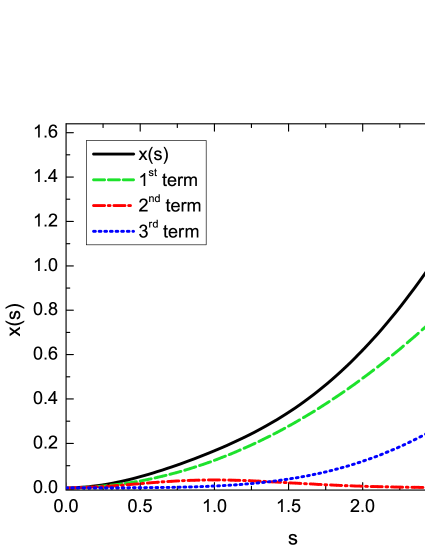
The fact that we used the same correlation functional for PBE, PBEsolPBE, PBE0, SOGGA, and WC allows us to present a few significant insights into the inner structure of SrRuO3. Firstly, a simple step that leads from to appears to be the most important for the accurate description of the geometry of SrRuO3. This can be noticed by analysing the overall performance of PBE, PBEsolPBE, and PBE0 (MARE in Table 1) – the inclusion of a fraction of HF exchange into the PBE framework is not that effective compared to the modification of parameter , which was set from to . Secondly, the modification of parameter in the correlation part () has much less impact – seen from comparison between MARE of PBEsolPBE and PBEsol – indicating that the magnitude of the exchange energy is substantially larger compared to the correlation energy. Besides, a slightly better performance of the PBEsolPBE combination implies that the restoration of GE for correlation is more relevant for bulk SrRuO3 than the original choice to reproduce exchange-correlation energy of jellium surface at the TPSS level [Perdew et al., 2008]. A close look at Fig. 3 reveals that and are nearly identical for . Having in mind that MARE results obtained with PBE and WC functionals are in a noticeable discrepancy, one can make an assumption that the average reduced density gradient should exceed this value in SrRuO3. Although the WC approach has rather complicated form, which ensures the same behaviour as PBE for and , examination of the terms in , presented in Fig. 4, shows that at values larger than 0.5 the first term starts dominating over the remaining two. Since this term is exactly the same as the one in PBEsol, it becomes clear why these two functionals with distinct values are both able to improve the PBE calculations. This once again confirms the significance of the exact second-order GE for the description of the crystalline structure of SrRuO3.
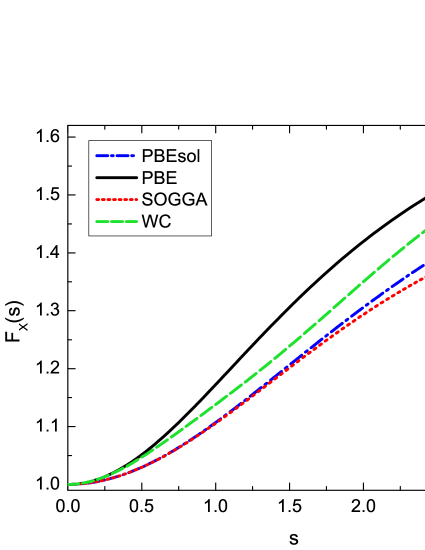
Another close look at Fig. 3 indicates that the SOGGA and PBEsol curves are almost identical up to . This observation is perfectly consistent with a very similar performance of SOGGA and PBEsolPBE reflected in the results of all four MAREs. If the average value of would be higher, we should obtain a more pronounced difference between SOGGA and PBEsolPBE. However, the difference is negligible meaning that the average value of should fall in the range of . Such range testifies about a moderately-varying density in SrRuO3. It is also interesting that another two similarly performing functionals – PBEsol and WC – have different parameters in exchange and correlation parts. As we have already found out that the first term in makes the largest contribution to , one can note that the effect of the addition of remaining two terms somewhat corresponds to the effect of the modification of correlation functional in PBEsol.
A comparison between the non-screened PBE0 hybrid and its screened HSE06 counterpart also offers a few thoughts on the intrinsic features of SrRuO3. On one hand, only a slightly improved performance of the HSE06 functional shows that the non-screened LR part of the HF exchange interaction, present in the PBE0 scheme, is quite unimportant. A beneficial reduction of the self-interaction error, common for GGAs, appears to take place at the SR distance, which turns out to be not so short, extending over two or three chemical bonds in various crystalline materials [Henderson et al., 2009]. On the other hand, a worse performance of the PBE0 functional unveils that the inclusion of the LR exact exchange has a small but negative impact on the geometry of SrRuO3. This is not an unexpected trend, though, since the LR portion of the HF exchange may lead to unphysical results in solids [Lucero, Henderson, and Scuseria, 2012], especially metallic systems, due to the incomplete cancellation with the approximate correlation functional [Janesko, Henderson, and Scuseria, 2009]. However, a factor that has a greater influence on the performance of hybrids is the amount of exact exchange incorporated through the mixing parameter . As we have already found that PBEsol and WC demonstrate similar values of MAREs and HSE-type correction is not essential, a comparison between HSEsol and mB1WC allows to take a look at the effect of reduction from 0.25 to 0.16. One can note that mB1WC produces noticeably better results which in turn indicate that the typical value of the HF exchange is not the best option for SrRuO3. A fraction of , in the meantime, is in agreement with the recent observation that a mixing of seems to be more appropriate choice for the description of the perovskite family [Franchini, 2014]. The advantage of mB1WC over HSEsol also points to the smaller self-interaction error the DFT approaches deal with in this perovskite.
V Conclusions
In this work, we have investigated the crystalline structure of ground-state orthorhombic SrRuO3 by applying a bunch of functionals from three families of DFT approximations: LDA, GGAs, and hybrids. The calculated equilibrium structural parameters – (a) lattice constants and volume, (b) tilting and rotation angles, and (c) internal angles and bond distances within RuO6 octahedra – were compared with the low-temperature experimental data. Our analysis of the obtained results allows to highlight several important points. Firstly, the PBE functional is apparently the worst performer among all the contestants, therefore it should be considered as the last option for the geometry optimization of SrRuO3. Secondly, the restoration of the exact second-order density GE for exchange – in one way or another incorporated into the revised PBEsol, SOGGA, and WC GGAs – effectively ameliorates performance of the PBE approach, especially for the lattice constants and volume. Thirdly, the inclusion of a portion of the HF exchange also has a positive impact on the crystalline structure of SrRuO3 with respect to the PBE results. In addition, the HSE-type screening of the LR part of the exact exchange is not an essential ingredient for the improvement provided by the hybrid framework. Fourthly and finally, a combination of the revised GGAs with the hybrid scheme seems to be the most appropriate tool for the accurate description of the external [(a)] and internal [(b) and (c)] structural parameters simultaneously. However, amounts of HF exchange smaller than the standard should be preferred. Based on these findings, we are able to offer some recommendations for further theoretical modelling of experimentally observed phases of SrRuO3. If the research is limited to the lattice constants and volume, one should give a chance to the revised GGAs for solids (PBEsol/PBEsolPBE, SOGGA, WC) due to their impressive performance and substantially lower computational cost compared to the hybrids. But if the field of interest comprises interoctahedral angles or full geometry of the system, one should lean towards the hybrids which are based on the revised GGAs (mB1WC, HSEsol). Although the internal geometry of RuO6 is well described by both families of functionals, in case of full geometry of the system hybrids are superior because of their significantly better performance in reproducing tilting and rotation angles. It is also interesting to note that additionally calculated electronic and magnetic structure of SrRuO3 indicates that LDA, despite its striking simplicity, can be treated as the most universal of all the tested functionals. A reasonable geometry optimization followed by a realistic representation of electronic structure and magnetic moment shows that this approximation can be a serious competitor if the crystalline structure is not the only issue the research is focused on.
Acknowledgements.
The authors are thankful for the HPC resources provided by the ITOAC of Vilnius University.References
- Koster et al. (2012) G. Koster, L. Klein, W. Siemons, G. Rijnders, J. S. Dodge, C.-B. Eom, D. H. A. Blank, and M. R. Beasley, Rev. Mod. Phys. 84, 253 (2012).
- Junquera and Ghosez (2003) J. Junquera and P. Ghosez, Nature 422, 506 (2003).
- Fujii et al. (2005) T. Fujii, M. Kawasaki, A. Sawa, H. Akoh, Y. Kawazoe, and Y. Tokura, Appl. Phys. Lett. 86, 012107 (2005).
- Thota et al. (2010) S. Thota, Q. Zhang, F. Guillou, U. Lüders, N. Barrier, W. Prellier, A. Wahl, and P. Padhan, Appl. Phys. Lett. 97, 112506 (2010).
- Niranjan et al. (2009) M. K. Niranjan, J. D. Burton, J. P. Velev, S. S. Jaswal, and E. Y. Tsymbal, Appl. Phys. Lett. 95, 052501 (2009).
- Takahashi et al. (2003) K. S. Takahashi, A. Sawa, Y. Ishii, H. Akoh, M. Kawasaki, and Y. Tokura, Phys. Rev. B 67, 094413 (2003).
- Gausepohl et al. (1995) S. C. Gausepohl, M. Lee, L. Antognazza, and K. Char, Appl. Phys. Lett. 67, 1313 (1995).
- Feigenson et al. (2005) M. Feigenson, L. Klein, M. Karpovski, J. W. Reiner, and M. R. Beasley, J. Appl. Phys. 97, 10J120 (2005).
- Kennedy and Hunter (1998) B. J. Kennedy and B. A. Hunter, Phys. Rev. B 58, 653 (1998).
- Zayak et al. (2006) A. T. Zayak, X. Huang, J. B. Neaton, and K. M. Rabe, Phys. Rev. B 74, 094104 (2006).
- Rondinelli et al. (2008) J. M. Rondinelli, N. M. Caffrey, S. Sanvito, and N. A. Spaldin, Phys. Rev. B 78, 155107 (2008).
- Hadipour and Akhavan (2011) H. Hadipour and M. Akhavan, Eur. Phys. J. B 84, 203 (2011).
- García-Fernández et al. (2012a) P. García-Fernández, S. Ghosh, N. J. English, and J. A. Aramburu, Phys. Rev. B 86, 144107 (2012a).
- Verissimo-Alves et al. (2012) M. Verissimo-Alves, P. García-Fernández, D. I. Bilc, P. Ghosez, and J. Junquera, Phys. Rev. Lett. 108, 107003 (2012).
- Zang and Ma (2013) T.-C. Zang and C.-L. Ma, Physica B 415, 10 (2013).
- Miao et al. (2014) N. Miao, N. C. Bristowe, B. Xu, M. J. Verstraete, and P. Ghosez, J. Phys.: Condens. Matter 26, 035401 (2014).
- Zhernenkov et al. (2013) M. Zhernenkov, G. Fabbris, O. Chmaissem, J. Mitchell, H. Zheng, and D. Haskel, J. Solid State Chem. 205, 177 (2013).
- Lu et al. (2013a) W. Lu, W. Dong Song, K. He, J. Chai, C.-J. Sun, G.-M. Chow, and J.-S. Chen, J. Appl. Phys. 113, 063901 (2013a).
- Lu et al. (2013b) W. Lu, P. Yang, W. D. Song, G. M. Chow, and J. S. Chen, Phys. Rev. B 88, 214115 (2013b).
- Vailionis, Siemons, and Koster (2008) A. Vailionis, W. Siemons, and G. Koster, Appl. Phys. Lett. 93, 051909 (2008).
- Choi et al. (2010) K. J. Choi, S. H. Baek, H. W. Jang, L. J. Belenky, M. Lyubchenko, and C.-B. Eom, Adv. Mater. 22, 759 (2010).
- Chang et al. (2011) S. H. Chang, Y. J. Chang, S. Y. Jang, D. W. Jeong, C. U. Jung, Y.-J. Kim, J.-S. Chung, and T. W. Noh, Phys. Rev. B 84, 104101 (2011).
- Vailionis et al. (2011) A. Vailionis, H. Boschker, W. Siemons, E. P. Houwman, D. H. A. Blank, G. Rijnders, and G. Koster, Phys. Rev. B 83, 064101 (2011).
- Herklotz et al. (2013) A. Herklotz, M. Kataja, K. Nenkov, M. D. Biegalski, H.-M. Christen, C. Deneke, L. Schultz, and K. Dörr, Phys. Rev. B 88, 144412 (2013).
- Kan et al. (2013a) D. Kan, R. Aso, H. Kurata, and Y. Shimakawa, Adv. Funct. Mater. 23, 1129 (2013a).
- Kan et al. (2013b) D. Kan, R. Aso, H. Kurata, and Y. Shimakawa, J. Appl. Phys. 113, 173912 (2013b).
- Aso et al. (2014) R. Aso, D. Kan, Y. Fujiyoshi, Y. Shimakawa, and H. Kurata, Cryst. Growth Des. 14, 6478 (2014).
- Lu et al. (2015) W. Lu, W. Song, P. Yang, J. Ding, G. M. Chow, and J. Chen, Sci. Rep. 5, 10245 (2015).
- Herklotz and Dörr (2015) A. Herklotz and K. Dörr, Eur. Phys. J. B 88, 60 (2015).
- Mahadevan et al. (2009) P. Mahadevan, F. Aryasetiawan, A. Janotti, and T. Sasaki, Phys. Rev. B 80, 035106 (2009).
- Gupta, Mandal, and Mahadevan (2014) K. Gupta, B. Mandal, and P. Mahadevan, Phys. Rev. B 90, 125109 (2014).
- Si et al. (2015) L. Si, Z. Zhong, J. M. Tomczak, and K. Held, Phys. Rev. B 92, 041108 (2015).
- Perdew et al. (2005) J. P. Perdew, A. Ruzsinszky, J. Tao, V. N. Staroverov, G. E. Scuseria, and G. I. Csonka, J. Chem. Phys. 123, 062201 (2005).
- Perdew et al. (2009) J. P. Perdew, A. Ruzsinszky, G. I. Csonka, L. A. Constantin, and J. Sun, Phys. Rev. Lett. 103, 026403 (2009).
- Csonka et al. (2009) G. I. Csonka, J. P. Perdew, A. Ruzsinszky, P. H. T. Philipsen, S. Lebègue, J. Paier, O. A. Vydrov, and J. G. Ángyán, Phys. Rev. B 79, 155107 (2009).
- Haas et al. (2010) P. Haas, F. Tran, P. Blaha, L. S. Pedroza, A. J. R. da Silva, M. M. Odashima, and K. Capelle, Phys. Rev. B 81, 125136 (2010).
- Dirac (1930) P. A. M. Dirac, Proc. Camb. Philos. Soc. 26, 376 (1930).
- Perdew et al. (2008) J. P. Perdew, A. Ruzsinszky, G. I. Csonka, O. A. Vydrov, G. E. Scuseria, L. A. Constantin, X. Zhou, and K. Burke, Phys. Rev. Lett. 100, 136406 (2008).
- Antoniewicz and Kleinman (1985) P. R. Antoniewicz and L. Kleinman, Phys. Rev. B 31, 6779 (1985).
- Perdew, Burke, and Ernzerhof (1996) J. P. Perdew, K. Burke, and M. Ernzerhof, Phys. Rev. Lett. 77, 3865 (1996).
- Haas et al. (2009) P. Haas, F. Tran, P. Blaha, K. Schwarz, and R. Laskowski, Phys. Rev. B 80, 195109 (2009).
- Perdew et al. (2006) J. P. Perdew, L. A. Constantin, E. Sagvolden, and K. Burke, Phys. Rev. Lett. 97, 223002 (2006).
- Lieb and Oxford (1981) E. H. Lieb and S. Oxford, Int. J. Quantum Chem. 19, 427 (1981).
- Ma and Brueckner (1968) S.-K. Ma and K. A. Brueckner, Phys. Rev. 165, 18 (1968).
- Tao et al. (2003) J. Tao, J. P. Perdew, V. N. Staroverov, and G. E. Scuseria, Phys. Rev. Lett. 91, 146401 (2003).
- Zhao and Truhlar (2008) Y. Zhao and D. G. Truhlar, J. Chem. Phys. 128, 184109 (2008).
- Hammer, Hansen, and Nørskov (1999) B. Hammer, L. B. Hansen, and J. K. Nørskov, Phys. Rev. B 59, 7413 (1999).
- Wu and Cohen (2006) Z. Wu and R. E. Cohen, Phys. Rev. B 73, 235116 (2006).
- Haas, Tran, and Blaha (2009) P. Haas, F. Tran, and P. Blaha, Phys. Rev. B 79, 085104 (2009).
- Paier et al. (2006) J. Paier, M. Marsman, K. Hummer, G. Kresse, I. C. Gerber, and J. G. Ángyán, J. Chem. Phys. 124, 154709 (2006).
- Paier, Marsman, and Kresse (2007) J. Paier, M. Marsman, and G. Kresse, J. Chem. Phys. 127, 024103 (2007).
- Marsman et al. (2008) M. Marsman, J. Paier, A. Stroppa, and G. Kresse, J. Phys.: Condens. Matter 20, 064201 (2008).
- Adamo and Barone (1999) C. Adamo and V. Barone, J. Chem. Phys. 110, 6158 (1999).
- Heyd and Scuseria (2004) J. Heyd and G. E. Scuseria, J. Chem. Phys. 120, 7274 (2004).
- Krukau et al. (2006) A. V. Krukau, O. A. Vydrov, A. F. Izmaylov, and G. E. Scuseria, J. Chem. Phys. 125, 224106 (2006).
- Schimka, Harl, and Kresse (2011) L. Schimka, J. Harl, and G. Kresse, J. Chem. Phys. 134, 024116 (2011).
- Bilc et al. (2008) D. I. Bilc, R. Orlando, R. Shaltaf, G.-M. Rignanese, J. Íñiguez, and P. Ghosez, Phys. Rev. B 77, 165107 (2008).
- Perdew et al. (1992) J. Perdew, J. Chevary, S. Vosko, K. Jackson, M. Pederson, D. Singh, and C. Fiolhais, Phys. Rev. B 46, 6671 (1992).
- García-Fernández et al. (2012b) P. García-Fernández, S. Ghosh, N. J. English, and J. A. Aramburu, Phys. Rev. B 86, 144107 (2012b).
- Dovesi et al. (2014) R. Dovesi, R. Orlando, A. Erba, C. M. Zicovich-Wilson, B. Civalleri, S. Casassa, L. Maschio, M. Ferrabone, M. De La Pierre, P. D’Arco, Y. Noël, M. Causà, M. Rérat, and B. Kirtman, Int. J. Quantum Chem. 114, 1287 (2014).
- Hay and Wadt (1985) P. J. Hay and W. R. Wadt, J. Chem. Phys. 82, 299 (1985).
- Piskunov et al. (2004) S. Piskunov, E. Heifets, R. Eglitis, and G. Borstel, Comput. Mater. Sci. 29, 165 (2004).
- Masys et al. (2013) Š. Masys, V. Jonauskas, S. Grebinskij, S. Mickevičius, V. Pakštas, and M. Senulis, Lith. J. Phys. 53, 150 (2013).
- Valenzano et al. (2006) L. Valenzano, F. J. Torres, D. Klaus, F. Pascale, C. M. Zicovich-Wilson, and R. Dovesi, Z. Phys. Chem. 220, 893 (2006).
- (65) http://www.crystal.unito.it/basis-sets.php.
- (66) R. Dovesi, V. R. Saunders, C. Roetti, R. Orlando, C. M. Zicovich-Wilson, F. Pascale, B. Civalleri, K. Doll, N. M. Harrison, I. J. Bush, P. D’Arco, M. Llunell, M. Causà, and Y. Noël, CRYSTAL14 User’s Manual (University of Torino, Torino, 2014).
- Anderson (1965) D. G. Anderson, J. Assoc. Comput. Mach. 12, 547 (1965).
- Hamann (1979) D. R. Hamann, Phys. Rev. Lett. 42, 662 (1979).
- Vosko, Wilk, and Nusair (1980) S. H. Vosko, L. Wilk, and M. Nusair, Can. J. Phys. 58, 1200 (1980).
- Masys and Jonauskas (2013) Š. Masys and V. Jonauskas, J. Chem. Phys. 139, 224705 (2013).
- Grånäs et al. (2014) O. Grånäs, I. Di Marco, O. Eriksson, L. Nordström, and C. Etz, Phys. Rev. B 90, 165130 (2014).
- Kim, Chung, and Oh (2005) J. Kim, J. Chung, and S.-J. Oh, Phys. Rev. B 71, 121406 (2005).
- Toyota et al. (2005) D. Toyota, I. Ohkubo, H. Kumigashira, M. Oshima, T. Ohnishi, M. Lippmaa, M. Takizawa, A. Fujimori, K. Ono, M. Kawasaki, and H. Koinuma, Appl. Phys. Lett. 87, 162508 (2005).
- Grebinskij et al. (2013) S. Grebinskij, Š. Masys, S. Mickevičius, V. Lisauskas, and V. Jonauskas, Phys. Rev. B 87, 035106 (2013).
- Henderson et al. (2009) T. M. Henderson, A. F. Izmaylov, G. Scalmani, and G. E. Scuseria, J. Chem. Phys. 131, 044108 (2009).
- Lucero, Henderson, and Scuseria (2012) M. J. Lucero, T. M. Henderson, and G. E. Scuseria, J. Phys.: Condens. Matter 24, 145504 (2012).
- Janesko, Henderson, and Scuseria (2009) B. G. Janesko, T. M. Henderson, and G. E. Scuseria, Phys. Chem. Chem. Phys. 11, 443 (2009).
- Franchini (2014) C. Franchini, J. Phys.: Condens. Matter 26, 253202 (2014).
- Bushmeleva et al. (2006) S. N. Bushmeleva, V. Y. Pomjakushin, E. V. Pomjakushina, D. V. Sheptyakov, and A. M. Balagurov, J. Magn. Magn. Mat. 305, 491 (2006).
- Momma and Izumi (2011) K. Momma and F. Izumi, J. Appl. Crystallogr. 44, 1272 (2011).