Dust interferometers in plasmas
Abstract
An interferometric imaging technique has been proposed to instantly measure the diameter of individual spherical dust particles suspended in a gas discharge plasma. The technique is based on the defocused image analysis of both spherical particles and their binary agglomerates. Above a critical diameter, the defocused images of spherical particles contain stationary interference fringe patterns and the fringe number increases with particle diameters. Below this critical diameter, the particle size has been measured using the rotational interference fringe patterns which appear only on the defocused images of binary agglomerates. In this case, a lower cut-off limit of particle diameter has been predicted, below which no such rotational fringe patterns are observed for the binary agglomerates. The method can be useful as a diagnostics for complex plasma experiments on earth as well as under microgravity condition.
pacs:
07.60.Ly, 42.25.Hz, 52.27.Lw, 52.70.Kz, 64.70.Dv, 95.55.BrUnderstanding strongly correlated phenomena such as crystal and liquid structures, melting dynamics, crystallization, homogeneous nucleation, dendrites, glass transition, etc. in a classical many body systems are outstanding topics of practical importance in material science Chaikin:Lubensky ; kittel ; Hansen:McDonald ; larson . Colloids have long been used as a model system to investigate such processes where particles of different shapes (sphere, cube, ellipsoid, agglomerates, etc.) can be synthesized based on experimental requirements lowen1994 ; biben1994 ; Weeks:2000aa ; Gasser:2001aa ; Dullens2006 ; Kawasaki:2010aa ; Peng-Tan:2014aa . The surfaces of colloidal particles can be treated chemically to explore wide range of inter-particle interactions (repulsive to attractive, hard sphere to ultra-soft) and associated tunable, collective, self-organized processes. Different high resolution imaging techniques, such as laser scanning confocal microscope (LSCM), electron microscopy or atomic force microscopy (AFM) techniques can be used to measure size and shape of colloidal particles precisely. Other technique such as dynamic light scattering has also been used to measure hydrodynamic size of the particles in a dilute solution. In recent times, it is revealed that colloids share unique complementary features with complex (dusty) plasma which is being considered as the plasma state of soft matter Morfill_RMP ; Chaudhuri_SM ; Morfill:lowen . However, unlike colloids where the particle dynamics is over damped due to viscous solvents, the highly charged solid particles in complex plasmas levitate in the background of weakly ionized gas Thomas_PRL ; Chu_PRL ; Thomas-Nature-1996 . Basic understanding of plasma-particle interactions are essential to tune inter-particle interactions and relevant self-organized collective phenomena in complex plasmas Fortov2005PR ; vladimirov-ost-phys.rep-2004 ; Konopka2000 ; lampe-gos-ste-phys.plasmas-2003 ; Chaudhuri2007a ; Chaudhuri2008a ; ChaudhuriIEEE2010 . The background neutral gas pressure can be controlled precisely to achieve almost undamped particle dynamics which makes complex plasma a unique model system to explore classical many body phenomena at the “atomistic” level Morfill:lowen ; Morfill:pop . Different types of unique experiments have been performed at ground based laboratories on earth Quinn_PhysRevE.64.051404 ; Zuzic:PhysRevLett.85.4064 ; Nosenko_PhysRevLett.93.155004 ; Nosenko_PhysRevLett.103.015001 ; Hartmann_PhysRevLett.105.115004 ; Feng_PhysRevLett.104.165003 ; Nosenko_PhysRevLett.99.025002 ; Knapek_PhysRevLett.98.015004 ; Nunomura_PhysRevLett.95.025003 ; Nosenko_PhysRevLett.93.155004 ; Liu_PhysRevLett.100.055003 ; Juan_PhysRevE.64.016402 , as well as under microgravity condition onboard “International Space Station (ISS)” Morfill:PhysRevLett.83.1598 ; Kretschmer:PhysRevE.71.056401 ; Zuzic:Naturephysics ; Thomas:NJP ; Schwabe:EPL . Typically experimental data in complex plasmas is analyzed by using standard particle location and tracking methods on sequence of images obtained by video microscopy technique. Several other techniques with different features have also been used, such as, Particle-Image-Velocimetry (PIV) Ed_Thomas_10.1063/1.873544 ; Ed_Thomas_10.1063/1.2174831 , digital in-line holography Kroll_10.1063/1.2932109 , color gradient method Annaratone_PPCF , stereoscopy kading:090701 , etc. However to the best of our knowledge, there exists no technique in complex plasmas to identify individual particles shape and size instantly during experiments.
Recently defocus imaging technique has been used as an useful diagnostic to identify binary agglomerates in complex plasma which contains rotating interference fringe patterns on their defocus images APL_Manis . Now, it is discovered that stationary interference fringes appear on individual, bigger size, spherical particles. In such cases, a combination of rotational and stationary fringe patterns are the characteristic of binary agglomerates as shown in Fig. 2f. At some point, the rotational fringe pattern overlaps exactly on top of stationary fringe patterns which implies that inter-fringe spacings are identical on defocus images for such spherical particles and their binary agglomerates. The goal of this work is to put forward an idea of using defocus imaging technique to measure diameter of individual spherical dust particle instantly during experiments within some accuracy. We have tried to explore the origin of the fringe patterns for individual spherical dust particle which itself acts as an efficient interferometer. The fringe pattern becomes distinct as the particle diameter increases and there is a lower cut-off ( 9 m) below which we don’t observe any such fringes. For medium size particles, rotational fringes appear on binary agglomerates but very faint fringes appear on defocus images of individual spherical particles. For smaller particles (below 5.5 m) no fringes are observed at all on either spherical particles or on their binary agglomerates.
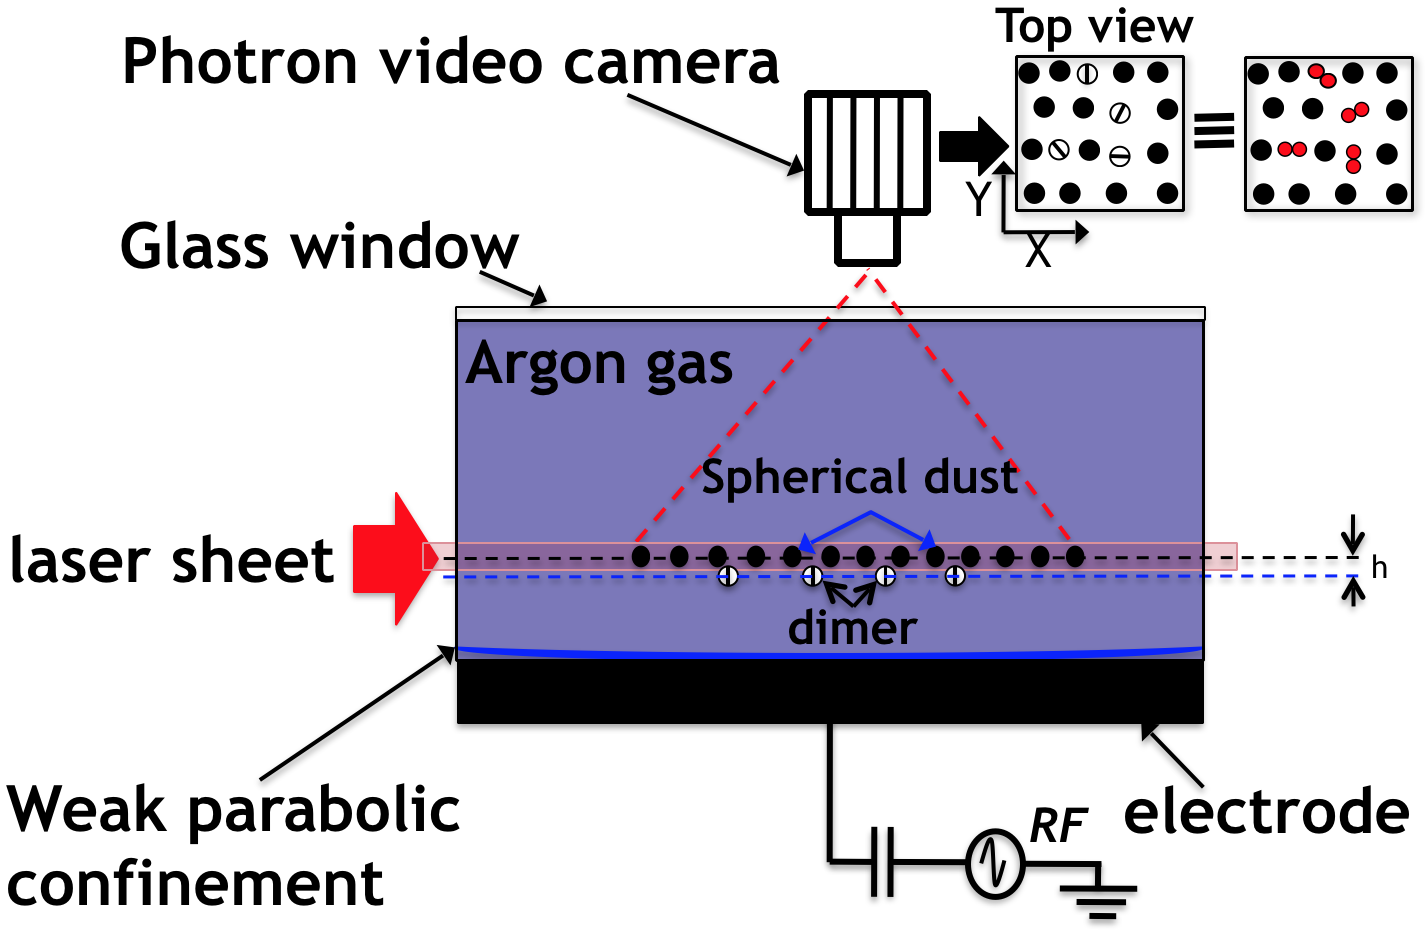
The experiments were performed with a (modified) Gaseous Electronics Conference (GEC) chamber, in a capacitively coupled rf glow discharge at 13.56 MHz (see Fig. 1). The Argon pressure and the forward rf power were kept at 1 Pa and at 20 Watt respectively. Particles of different sizes and materials have been used for the experiments: Melamine formaldehyde (MF) particles (mass density: 1.51gm/cm3, refractive index (RI): 1.68) with diameters () of 4.32 m, 7.16 m, 8.42 m, 9.19 m and 14.910.26 m; polystyrene (PS) particles (mass density: 1.05 gm/cm3, RI: 1.58) with a diameter of 11.35 m and PMMA particles (mass density: 1.19 gm/cm3, RI: 1.49) with diameters of 17.020.03 m and 20 m. The particle suspension was illuminated with a horizontal sheet of red diode laser light (wavelength of 660 nm) and imaged through the top glass window with the Photron FASTCAM 1024 PCI camera operating at a speed of 60 frames/sec with a field of view of 1024 x 1024 pixels. The focal length of the lens is 105 mm with aperture range, to . The camera lens was equipped with a narrow-band interference filter to collect only the illumination laser light scattered by the particles.
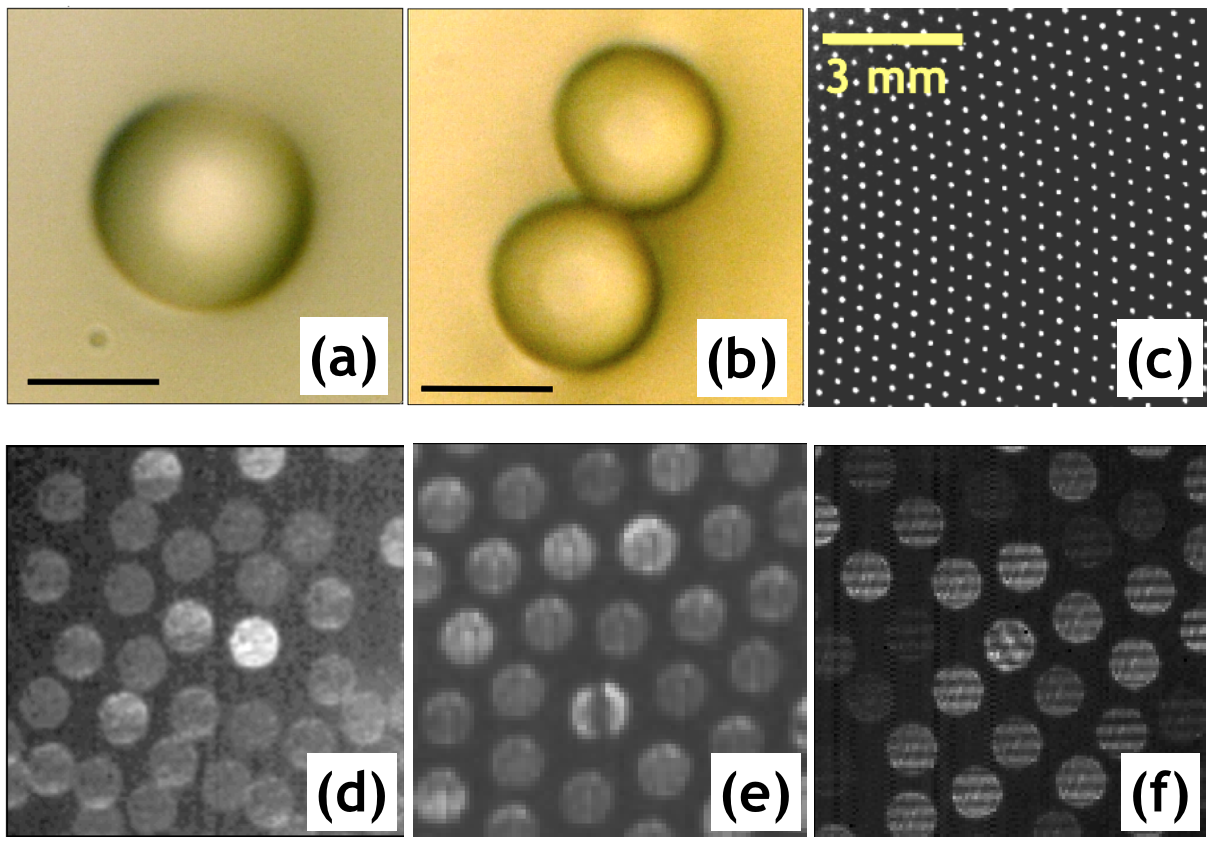
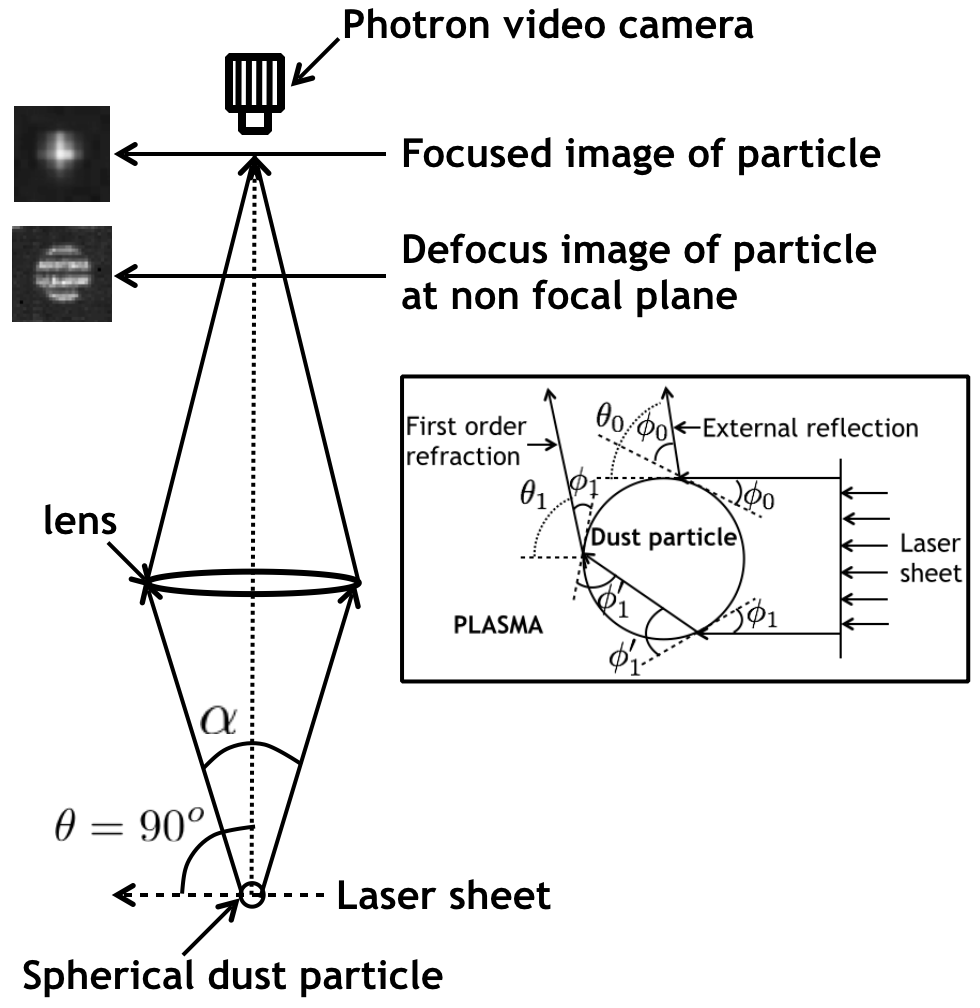
When injected in the plasma, both the spherical dust particles and their binary agglomerates become highly charged and form a quasi-two dimensional suspension above the lower electrode APL_Manis . The binary agglomerates levitate just below the monolayer of spherical particles without forming vertical pairs so that all the particles can be viewed from top view camera as shown schematically in Fig. 1. All the particles can be identified by few bright pixels in a focused image due to laser light scattering. It is not possible to characterize the particle shape and size by looking at these focused images. But as we defocus the images, interesting new features are observed: distinct interference fringe patterns appear on the defocused images of the particles APL_Manis . Identical fringe patterns are observed for particles with same diameter as shown in Fig. 2f. As we increase the particle size, the number of fringes also increases on the defocused image of a single spherical particle and they become distinct. The observed phenomena i.e. the appearance of stationary fringe pattern on bigger size, spherical dust particles in plasma environment has been explained in the framework of “Interferometric Laser Imaging (ILI)” technique which is based on “Mie scattering theory” and takes into account the interference of the scattered light from a single transparent particle. The reflected and first order refracted rays interfere with each other to generate fringe patterns at the defocus plane. This technique has been applied before for measuring size of drops and bubbles (Interferometric Laser Imaging for Droplet Sizing (ILIDS)) in spray dryer systems, spark ignition engine, etc. as mentioned in Ref. Maeda2000 and references there in. Two glare points due to reflection and refraction from diametrically opposite positions can be observed at the focal plane if 50 m. However, for 50 m, ILI is the most suitable technique to determine particle size. It is to be noted that there is a lower limit of particle diameter below which ILI is invalid: where is the wavelength of illumination laser. In our experiment, we use nm and hence 4.20 m.
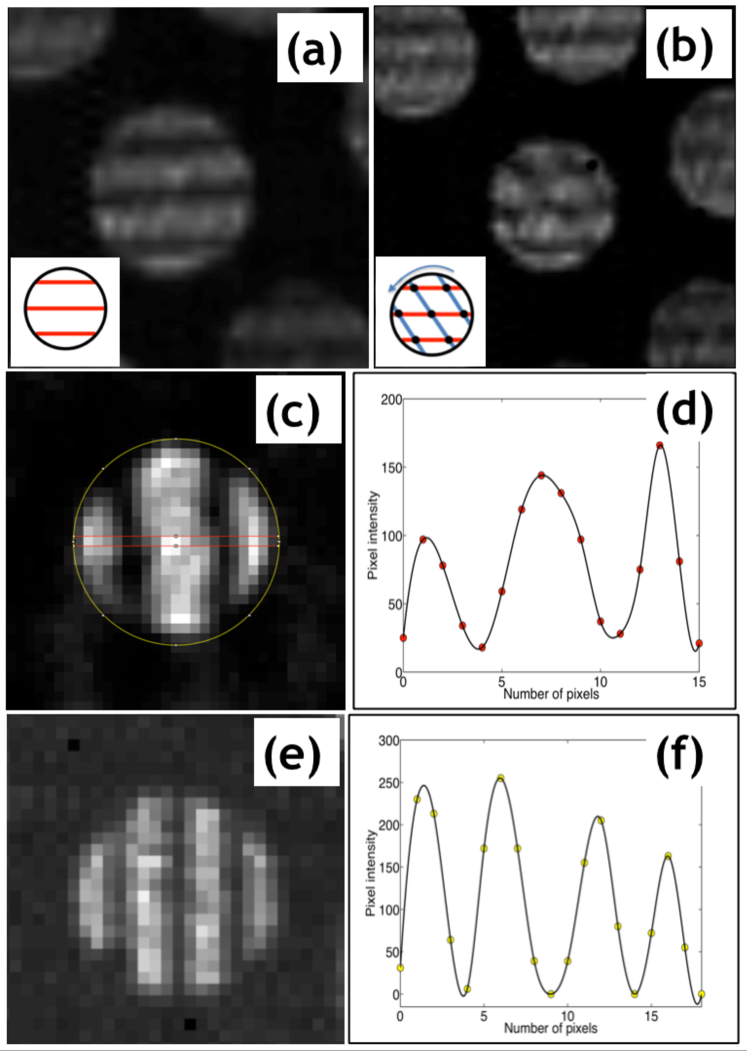
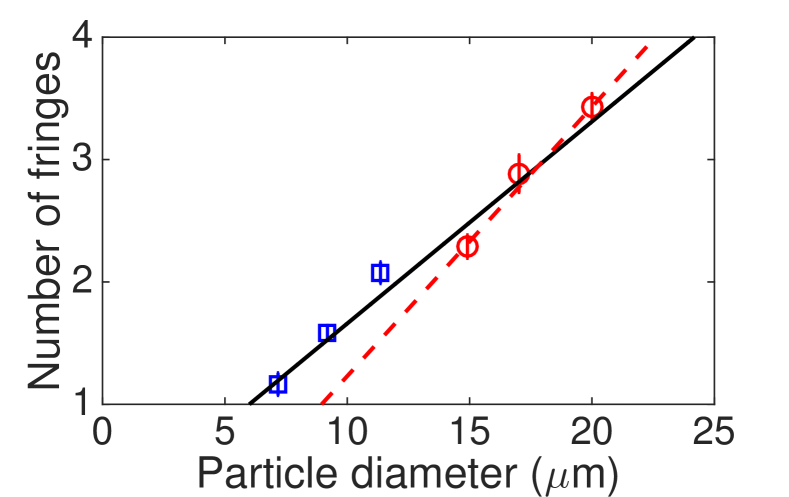
To calculate the number of fringes observed on the defocused image of a single particle, we select a one pixel width horizontal region of interest (ROI) along the diameter at the centre of the particle image. The dark fringes are perpendicular to the ROI. The intensity variation along the ROI exhibits several maxima and minima. As the particle size increases, the number of fringes increases and hence number of maxima/minima increases: N 1.16 for 7.16 m, N 1.58 for 9.19 m, N 2.07 for 11.35 m, N 2.28 for 14.91 m, N 2.88 for 17.02 m, and N 3.43 for 20 m. It is to be noted that with increasing particle size, the width of each peak decreases and height increases indicating distinct as well as sharp features of fringe patterns. It is difficult to measure the fringe separation for smaller particles due to the wider width of fringes and they appear almost at two ends of ROI.
According to Lorentz-Mie theory, the light scattered by a spherical particle is inhomogeneously distributed in space (oscillating function of the angle in the range ) which depends on particle diameter, refractive index and incident light characteristics hulst . The origin of these oscillations is due to interference between reflected, refracted and diffracted rays coming out of the particle and forms the basis of the Mie Scattering Interferrometry. However, for bigger particle it was shown that simpler geometric analysis can be used as an alternate of complex Mie theory to estimate particle size for a scattering angle centred around . To analyze the phenomenon, we consider all dust particles are perfectly spherical and homogeneous. The interaction between laser beam and the particle is shown in Fig. 3. The total scattering light intensity is due to the sum of reflection and first order refraction rays. The phase difference between the reflected and refracted rays can be expressed as Pajot1997 ; Golombok1998 :
| (1) |
An infinitesimal variation of the scattering angle induces a maximum or minimum light intensity variation when the phase difference is equal to . So, the angular inter-fringe spacing can be related to the particle diameter:
| (2) |
If the scattering angle is of then it can be assumed that the incidence angle of the refracted ray on the particle is close to zero and hence the above equation can be simplified as,
| (3) |
The number of fringes on the defocused image of a spherical particle depends on the collection angle, which is equal to the product of number of fringes and angular fringe spacing, :
| (4) |
The results have been described in Table-1 in which the left most column represents the diameter of the particles as specified by the manufacturer. Then Eqn. 4 has been used to estimate the particle diameters in experiments for known refractive indices of materials, wavelength of the illuminating lasers and specified diameters (14.91, 17.02 and 20 m).
It is to be noted that the diameters for smaller particles (7.16, 9.19 and 11.35 m) have been estimated by analyzing rotational interference fringes on defocused images of their binary agglomerates. It is based on the conjecture that the same measurement technique as described above for spherical particles is also applicable for defocused image analysis of binary agglomerates which contain rotational fringe patterns. This is due to the fact that the inter-fringe spacing for rotational pattern and stationary patterns are same for bigger size particles where both patterns are visible. This simplified approximation agrees well with experimental observations. However, the full understanding of the source of these rotating fringes is still unknown and kept for future work, but they certainly represent the dynamic signatures of binary agglomerates. It is found that the estimated diameters are sufficiently close to those of specified diameters with maximum tolerance of 14% for 11.35 m particles and minimum of 2% for 14.91 m particles.
| d (m) | Material | RI | Defocused | N: # of | d (m) |
| Specified | (m) | image | fringes | Estimated | |
| analysis | |||||
| 7.16 | MF | 1.68 | BA | 1.16 0.09 | 7.43 0.64 |
| 9.19 | MF | 1.68 | BA | 1.58 0.05 | 10.12 0.32 |
| 11.35 | PS | 1.58 | BA | 2.07 0.09 | 12.90 0.50 |
| 14.91 | MF | 1.68 | SP, BA | 2.28 0.09 | 14.60 0.52 |
| 17.02 | PMMA | 1.49 | SP, BA | 2.88 0.15 | 17.57 0.89 |
| 20 | PMMA | 1.49 | SP, BA | 3.43 0.10 | 20.91 0.61 |
In conclusion, we have discussed a simple and useful method to estimate size of a spherical particle over a wide size range by analyzing defocused images of both spherical particles and their binary agglomerates. The diameter of the spherical particle has been estimated for the first time by counting the number of interference fringes and their separation in the framework of interferometric laser imaging methods. The stationary fringe pattern is distinct for bigger spherical particles but they are not clearly visible for medium size particles. To overcome this problem, the separation of the rotating fringes for the binary agglomerates has been used in this size range. The number of fringes increases with particle size and there exists two critical diameters below which we do not observe any stationary and rotational fringe patterns. This simple technique can be used to identify size and shape of impurities or polydispersities in laboratory experiments as well as under microgravity conditions.
* Email: manischaudhuri@g.harvard.edu
Acknowledgement: M.C is supported by Marie-Curie international outgoing fellowship.
References
- (1) P. M. Chaikin and T. Lubensky, Principles of Condensed Matter Physics (Cambridge University Press, Cambridge, 2000).
- (2) C. Kittel, Introduction to Solid State Physics (Wiley, 2004).
- (3) J.-P. Hansen and I. McDonald, Theory of Simple Liquids (Academic Press, 2013).
- (4) R. G. Larson, The Structure and Rheology of Complex Fluids (Oxford University Press, 1998).
- (5) H. Löwen, Phys. Rep. 237, 249324 (1994).
- (6) T. Biben, R. Ohnesorge, and H. Löwen, Europhys. Lett. 28, 665670 (1994).
- (7) E. R. Weeks, J. C. Crocker, A. C. Levitt, A. Schofield, and D. A. Weitz, Science 287, 627 (2000).
- (8) U. Gasser, E. R. Weeks, A. Schofield, P. N. Pusey, and D. A. Weitz, Science 292, 258 (2001).
- (9) R. P. A. Dullens, D. G. A. L. Aarts, and W. K. Kegel, Phys. Rev. Lett. 97, 228301 (2006).
- (10) T. Kawasaki and H. Tanaka, PNAS 107, 14036 (2010).
- (11) N. X. Peng Tan and L. Xu, Nat. Phys. 10, 73 (2014).
- (12) G. E. Morfill and A. V. Ivlev, Rev. Mod. Phys. 81, 1353 (2009).
- (13) M. Chaudhuri, A. V. Ivlev, S. A. Khrapak, H. M. Thomas, and G. E. Morfill, Soft Matter. 7, 1229 (2011).
- (14) A. Ivlev, H. Löwen, G. Morfill, and C. P. Royall, Complex plasmas and colloidal dispersions: Particle-resolved studies of classical liquids and solids (World Scientific, Singapore, 2012).
- (15) H. M. Thomas, G. E. Morfill, and et. al, Phys. Rev. Lett. 73, 652 (1994).
- (16) J. H. Chu and L. I, Phys. Rev. Lett. 72, 4009 (1994).
- (17) H. M. Thomas and G. E. Morfill, Nature 379, 806 (1996).
- (18) V. E. Fortov, A. V. Ivlev, S. A. Khrapak, A. G. Khrapak, and G. E. Morfill, Phys. Rep. 421, 1 (2005).
- (19) S. V. Vladimirov and K. Ostrikov, Phys. Rep. 393, 175 (2004).
- (20) U. Konopka, G. E. Morfill, and L. Ratke, Phys. Rev. Lett. 84, 891 (2000).
- (21) M. Lampe, R. Goswami, Z. Sternovsky, S. Robertson, V. Gavrishchaka, G. Ganguli, and G. Joyce, Phys. Plasmas 10, 1500 (2003).
- (22) M. Chaudhuri, S. A. Khrapak, and G. E. Morfill, Phys. Plasmas 14, 022102 (2007).
- (23) M. Chaudhuri, S. A. Khrapak, and G. E. Morfill, Phys. Plasmas 15, 053703 (2008).
- (24) M. Chaudhuri, S. A. Khrapak, R. Kompaneets, and G. E. Morfill, IEEE Trans. on Plasma Sci. 38, 818 (2010).
- (25) G. E. Morfill, A. V. Ivlev, and H. M. Thomas, Phys. Plasmas 19, 055402 (2012).
- (26) R. A. Quinn and J. Goree, Phys. Rev. E 64, 051404 (2001).
- (27) M. Zuzic, A. V. Ivlev, J. Goree, G. E. Morfill, H. M. Thomas, H. Rothermel, U. Konopka, R. Sütterlin, and D. D. Goldbeck, Phys. Rev. Lett. 85, 4064 (2000).
- (28) V. Nosenko and J. Goree, Phys. Rev. Lett. 93, 155004 (2004).
- (29) V. Nosenko, S. K. Zhdanov, A. V. Ivlev, C. A. Knapek, and G. E. Morfill, Phys. Rev. Lett. 103, 015001 (2009).
- (30) P. Hartmann, A. Douglass, J. C. Reyes, L. S. Matthews, T. W. Hyde, A. Kovacs, and Z. Donko, Phys. Rev. Lett. 105, 115004 (2010).
- (31) Y. Feng, J. Goree, and B. Liu, Phys. Rev. Lett. 104, 165003 (2010).
- (32) V. Nosenko, S. Zhdanov, and G. Morfill, Phys. Rev. Lett. 99, 025002 (2007).
- (33) C. A. Knapek, D. Samsonov, S. Zhdanov, U. Konopka, and G. E. Morfill, Phys. Rev. Lett. 98, 015004 (2007).
- (34) S. Nunomura, D. Samsonov, S. Zhdanov, and G. Morfill, Phys. Rev. Lett. 95, 025003 (2005).
- (35) B. Liu and J. Goree, Phys. Rev. Lett. 100, 055003 (2008).
- (36) W.-T. Juan, M.-H. Chen, and L. I, Phys. Rev. E 64, 016402 (2001).
- (37) G. E. Morfill, H. M. Thomas, U. Konopka, H. Rothermel, M. Zuzic, A. Ivlev, and J. Goree, Phys. Rev. Lett. 83, 1598 (1999).
- (38) M. Kretschmer, S. A. Khrapak, S. K. Zhdanov, H. M. Thomas, G. E. Morfill, V. E. Fortov, A. M. Lipaev, V. I. Molotkov, A. I. Ivanov, and M. V. Turin, Phys. Rev. E 71, 056401 (2005).
- (39) M. Rubin-Zuzic, G. E. Morfill, A. V. Ivlev, R. Pompl, B. A. Klumov, W. Bunk, H. M. Thomas, H. Rothermel, O. Havnes, and A. Fouquet, Nat. Phys. 2, 181185 (2006).
- (40) H. M. Thomas, G. E. Morfill, V. E. Fortov, A. V. Ivlev, V. I. Molotkov, A. M. Lipaev, T. Hagl, H. Rothermel, S. A. Khrapak, R. K. Suetterlin, M. Rubin-Zuzic, O. F. Petrov, V. I. Tokarev, and S. K. Krikalev, New Journal of Physics 10, 033036 (2008).
- (41) M. Schwabe, K. Jiang, S. Zhdanov, T. Hagl, P. Hu- ber, A. V. Ivlev, A. M. Lipaev, V. I. Molotkov, V. N. Naumkin, K. R. Stterlin, H. M. Thomas, V. E. Fortov, G. E. Morfill, A. Skvortsov, and S. Volkov, Europhysics Letters 96, 55001 (2011).
- (42) E. Thomas, Phys. Plasmas 6, 2672 (1999).
- (43) E. Thomas and J. Williams, Phys. Plasmas 13, 055702 (2006).
- (44) M. Kroll, S. Harms, D. Block, and A. Piel, Phys. Plasmas 15, 063703 (2008).
- (45) B. M. Annaratone, T. Antonova, D. D. Goldbeck, H. M. Thomas, and G. E. Morfill, Plasma Physics and Controlled Fusion 46, B495 (2004).
- (46) S. Kading and A. Melzer, Physics of Plasmas 13, 090701 (2006).
- (47) M. Chaudhuri, V. Nosenko, C. Knapek, U. Konopka, A. V. Ivlev, H. M. Thomas, and G. E. Morfill, Applied Physics Letters 100, 264101 (2012).
- (48) M. Maeda, T. Kawaguchi, and K. Hishida, Meas. Sci. Technol. 11, L13 (2000).
- (49) H. V. de Hulst, Light scattering by small particles (Wiley, 1957).
- (50) C. Mounmim-Rousselle and O. Pajot, Optical Technology in Fluid, Thermal and Combustion III 3172, 700 (1997).
- (51) M. Golombok,V. Morin, and C. Mounaim-Rousselle, J. Phys. D: Applied Physics 31, pL59 (1998)