Very high energy Fermi/LAT detection of HESS J0632+057
Abstract
We report on the results of yrs of the very-high energy (10-600 GeV) observations of HESS J0632+057 with Fermi/LAT. In the highest energy band, GeV, the source is clearly detected with the statistical significance at orbital phases and at which HESS J0632+057 is known to demonstrate enhanced emission in TeV energy band. The analysis did not reveal the emission from HESS J0632+057 at lower energies and different orbital phases. Using the upper limits on source’s flux we locate the break of the spectrum to GeV and low-energy slope ( statistical significance).
1 Introduction
HESS J0632+057 is a rare representative of a TeV binary class. All five known binaries of this class host either O-type main sequence star or a Be star with a circumstellar disk and belong to the broad high-mass X-ray binary (HMXB) population. Peculiarly the spectral energy distribution in these systems is similar and dominating by the emission at GeV-TeV energies. The nature of this peculiarity is not completely understood, but allow to suggest the similar for all systems geometry and the nature of compact object, see Dubus (2013) for the review. At least one of system, PSR B1259-63 is known to be powered by a young pulsar (Johnston et al., 1992) and for several others the same type of compact object was suggested (Neronov & Chernyakova, 2008; Torres et al., 2010; Zdziarski, Neronov & Chernyakova, 2010; Durant et al., 2011; Moritani et al., 2015).
Among the TeV binaries HESS J0632+057 is the only source which was not detected at GeV energies so far, which may indicate the system somewhat differs from another TeV binaries. Discovered in 2007 during HESS observations of Monoceros region (Aharonian et al., 2007) as an unidentified point source with the galactic coordinates () = (205.67 ; -1.44) it was considered to be TeV binary candidate due to its spatial coincidence with the Be star MWC 148 (Aharonian et al., 2007; Hinton et al., 2009). Later, the system was detected in radio (Skilton et al., 2009), soft X-rays (Falcone et al., 2010) and TeV (VERITAS and MAGIC (Aleksić et al., 2012; Aliu et al., 2014)) energy bands. The observations of HESS J0632+057 by SWIFT taken between 2009 and 2011 allowed to determine the orbital parameters of the system ( d ; ; =MJD 54857.0 ; ), see Bongiorno et al. (2011). The distance to the source was estimated as kpc (Casares et al., 2012).
During the orbital cycle HESS J0632+057 demonstrates in X-rays two clear peaks of the emission at orbital phases and (Bongiorno et al., 2011). Recently, the similar structure of the orbital lightcurve in TeV energy range was reported by Maier et al. (2015). In February 2011 during the orbital phase HESS J0632+057 demonstrated an outburst, detected in X-rays (Falcone et al., 2011) and TeV energies (Ong, 2011; Jogler, 2011; Maier, 2011). During this flare the spectrum of the system remained consistent with a powerlaw of index observed earlier by HESS and MAGIC along the orbit (Aharonian et al., 2007; Aleksić et al., 2012) and the slope at phases and , as seen by VERITAS (Maier et al., 2015).
Despite the significant efforts, HESS J0632+057 was not detected in GeV band (see e.g. Mori et al., 2013; Caliandro et al., 2013; Hill et al., 2013) with the upper limits suggesting turnover in the spectrum at energies GeV (Caliandro et al., 2013). Particularly, the non-detection of the system can be explained by its location in a crowded Monoceros Loop region. For Fermi/LAT with PSF at GeV energy, the emission in HESS J0632+057 vicinity is strongly dominated by the bright -ray pulsar PSR J0633+0632 (3FGL J0633.7+0632), located only away.
In order to minimize the contamination by PSR J0633+0632, the previous studies (Mori et al., 2013; Caliandro et al., 2013; Hill et al., 2013) used for the analysis the data taken during the “off-pulse” phases of this pulsar, reducing the total available exposure on HESS J0632+057 by
Below we present the results of the analysis of the very-high energy (VHE, GeV) Fermi/LAT data on HESS J0632+057, focusing additionally on the orbital phases at which the source is bright in TeV energy band. Due to the presence of the high-energy cut-off in the spectrum of PSR J0633+0632 at 3.2 GeV (Acero et al., 2015), the analysis region was not significantly contaminated by the presence of the pulsar and does not suffer from the loss of the statistic. Such an approach for the first time allowed the detection of HESS J0632+057 with Fermi/LAT.
2 Fermi/LAT data analysis
The Large Area Telescope (LAT) is one of the instrument of Fermi satellite operating since 2008 at energies GeV. It has wide field of view of sr at 1 GeV and observes the entire sky every 3 hours (see full details of the instrumentaion in Atwood et al., 2009)
In our analysis we consider all available Fermi/LAT data on HESS J0632+057 taken during MJD,54682–57328 (2008 Aug. 04 – 2015 Nov. 02). The data were processed with the standard LAT analysis software (v10r0p5) and analysed with P8R2 response functions (CLEAN class photons). We have applied the standard cleaning to suppress the effect of the Earth albedo background, excluding time intervals with the Earth in the field of view (FoV; when its centre was from the zenith), and those in which a part of the FoV was observed with the zenith angle .
Additionally we explicitly limit our analysis for energies GeV in order to reduce the contamination on HESS J0632+057 by the bright nearby pulsar LAT PSR J0633+0632. For the region of radius around HESS J0632+057 we perform binned likelihood analysis, based on a fitting of a model of the region to the data. The spatial model includes diffuse Galactic and extragalactic backgrounds (gll_iem_v06.fits and iso_P8R2_CLEAN_V6_v06.txt templates) and the sources from the 4 years (3FGL) Fermi catalog (Acero et al., 2015). We split the whole energy range into narrow energy bins, performing the fitting procedure in each bin separately. In each bin, the spectral shapes of all sources are assumed to have power law spectral shape with . The spectral shapes of diffuse Galactic and extragalactic backgrounds are given by the corresponding templates. The normalisations of the fluxes of all sources and the diffuse background are treated as free parameters during the fitting. The analysis is performed with the python tools111fermi.gsfc.nasa.gov/ssc/data/analysis/scitools/python_tutorial.html provided by Fermi/LAT collaboration. The upper limits are calculated with the UpperLimits python module provided with the Fermi/LAT software and correspond to the 95 per cent () false-chance probability.
The likelihood-ratio test statistic (TS) is employed to evaluate the significance of each model source. The TS value of the source S is defined to be
where is likelihood function maximized during the fitting of the model with and without corresponding source, see e.g. Mattox et al. (1996). The TS value for the source with the -parametric spectral model follows distribution with N degrees of freedom (Wilks, 1938), which allows to estimate the significance of added source. For the source modelled with the powerlaw spectrum (2 d.o.f.) this results in the significance with the precision better than 10% for .
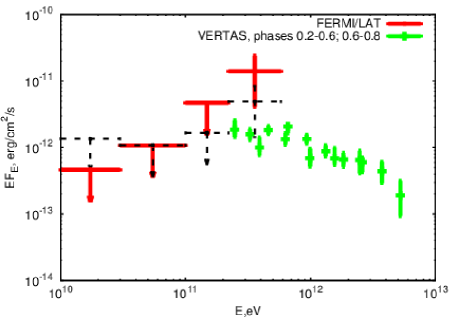
Following VERITAS detection of the outbursts from the source at orbital phases 0.2-0.4 and 0.6-0.8, we initially constrain the spectral analysis only to these parts of the orbit. The spectrum of HESS J0632+057 obtained in such a way is shown in Fig. 1, left (red solid points). At the highest energy bin (200-600 GeV) the test-statistic value of the detection of point-like source at the position of HESS J0632+057 is , which implies detection significance. The observed in this band energy flux is erg/cm2/s (assuming spectrum).
The averaged over all orbital phases spectrum is shown in Fig. 1 with the black dashed points. The non-detection of the source at orbital phases other than and together with the assumption of the constant over time flux implies in this case somewhat lower flux at 200-600 GeV energies erg/cm2/s and
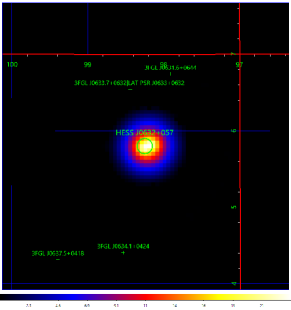
In order to further localise the source we build the TS map of the vicinity of HESS J0632+057. The Fig. 1, right shows the significance of adding a point source to the described region’s model (with removed HESS J0632+057 source) during the orbital phases and . The position of the source was found to be consistent with the position of HESS J0632+057 within the uncertainty found with gtfindsrc tool (, similar to the Fermi/LAT PSF at energies GeV).
3 Discussion and conclusions
Despite high formal significance of the detection of HESS J0632+057 by Fermi/LAT at VHE energies, the total amount of the detected photons is rather small. Namely, during the time periods which correspond to the increased TeV flux in VERITAS observations, Fermi detected 2 photons with energies GeV and GeV.
We verify, that the formal significance obtained by the Fermi software is consistent with the following conservative estimate. The considered region of contains in total 35 photons from which 2 (attributed to HESS J0632+057 source) are within from HESS J0632+057 position. The statistical false-chance of the later event is or .
The detected photons arrived in two consequent orbits (MJD 55404 (2010, Jul. 27) and MJD 55934 (2012, Jan. 27). Together with somewhat higher flux comparing to VERITAS (Maier et al., 2015) yrs mean orbital phases 0.2-0.4 and 0.6-0.8 flux, see Fig. 1 this may indicate the detection of HESS J0632+057 during its increased activity period, seen by MAGIC and VERITAS in Feb. 2011, Aleksić et al. (2012); Aliu et al. (2014).
The poor photon statistics does not allow also to determine the slope of the source’s spectrum in 200–600 GeV energy band . However, the absence of the photons at 10-200 GeV energies allow to put constraints on the position of the break in the spectrum and the corresponding low-energy slope.
Despite the strong flaring of HESS J0632+057 in TeV energy band the slope of the observed spectrum remained constant. In what follow we additionally assume, that the GeV slope of the spectrum also remains constant over all time intervals corresponding to orbital phases and used in further analysis.
Fig. 2 shows the change of the best-fit log-likelihood of the model in which HESS J0632+057 source was modelled with the broken powerlaw with corresponding low energy slope and the break position at . The slope at energies was fixed to best-fit value observed by HESS and VERITAS (Aharonian et al., 2007; Maier et al., 2015). The flux of the source at 200 GeV was additionally constrained not to be lower than the flux observed by Maier et al. (2015).
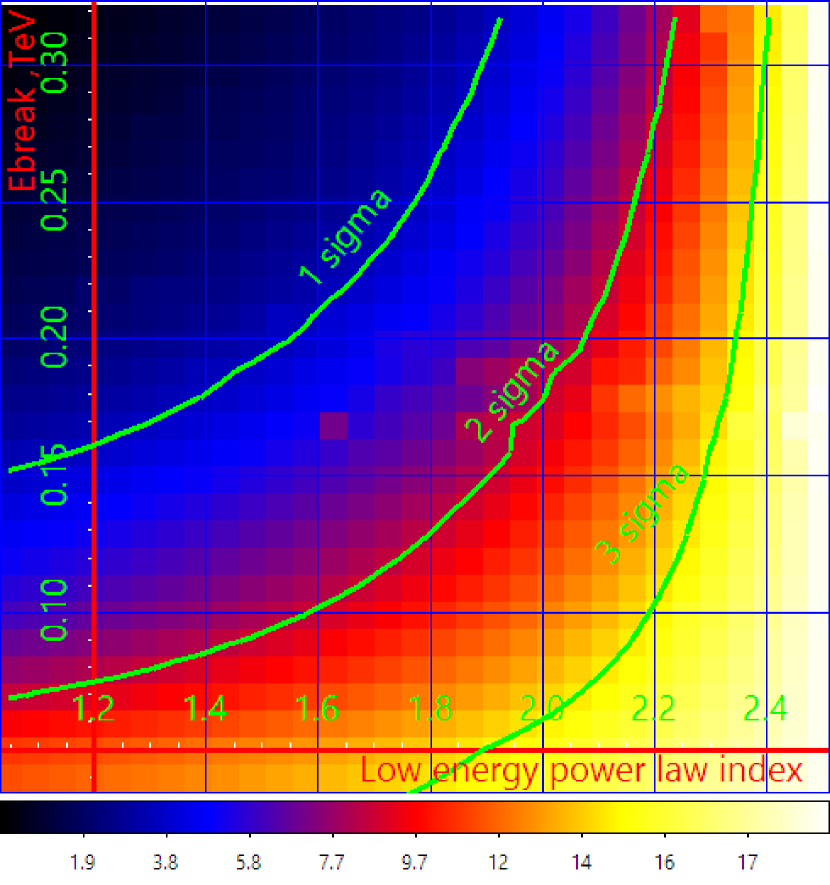
The change of the log-likelihood with adding N-parametric component to the model follows distribution with N degrees of freedom (Wilks, 1938). Correspondingly, , and allowed parameter’s range for HESS J0632+057 spectrum result from the change of the log-likelihood by ; and (3 added degrees of freedom) and are shown with green contours in Fig 2.
At () confidence the position of the break can be constrained as GeV ( GeV). Together with the upper limit on the position of the break implied by VERITAS observations (Maier et al., 2015) this allows to estimate the GeV energy slope of HESS J0632+057 to be quite hard ( ; ).
The obtained constraints on HESS J0632+057 flux, the position of the break and 10-100 GeV slope of spectrum are consistent with the predictions from simple one-zone synchrotron self-Compton model proposed by Hinton et al. (2009) and Skilton et al. (2009). In this model electrons injected with the spectrum are cooling in a magnetic mG and radiation ( erg/cm3) fields. The “striped pulsar wind model” proposed by Pétri & Dubus (2011) to explain the emission from PSR B1259-63 could also explain the GeV-TeV observations and can be preferable taking into account recent optical observations suggesting pulsar nature of the compact object in this system (Moritani et al., 2015).
Still, the quality of the analysed Fermi/LAT data does not allow to make firm conclusions on the nature of the emission from HESS J0632+057 but shows the possibility of the Fermi and forthcoming -ray missions to detect this source at least during the increased flux state, similar to one, observed in 2010-12. We encourage a dedicated -ray campaign for observations of this source during the orbital phases and which together with TeV-range observations can clarify the behaviour of the source’s spectrum at lower energies.
Acknowledgements. This work was partially supported by the EU COST Action (COST-STSM-MP1304-28864) “NewCompStar”. The authors thank SFI/HEA Irish Centre for High-End Computing (ICHEC) for the provision of computational facilities and support.
References
- Acero et al. (2015) Acero F. et al., 2015, ApJS, 218, 23
- Aharonian et al. (2007) Aharonian F. A. et al., 2007, A&A, 469, L1
- Aleksić et al. (2012) Aleksić J. et al., 2012, ApJ, 754, L10
- Aliu et al. (2014) Aliu E. et al., 2014, ApJ, 780, 168
- Atwood et al. (2009) Atwood W. B. et al., 2009, ApJ, 697, 1071
- Bongiorno et al. (2011) Bongiorno S. D., Falcone A. D., Stroh M., Holder J., Skilton J. L., Hinton J. A., Gehrels N., Grube J., 2011, ApJ, 737, L11
- Caliandro et al. (2013) Caliandro G. A. et al., 2013, MNRAS, 436, 740
- Casares et al. (2012) Casares J., Ribó M., Ribas I., Paredes J. M., Vilardell F., Negueruela I., 2012, MNRAS, 421, 1103
- Dubus (2013) Dubus G., 2013, A&A Rev., 21, 64
- Durant et al. (2011) Durant M., Kargaltsev O., Pavlov G. G., Chang C., Garmire G. P., 2011, ApJ, 735, 58
- Falcone et al. (2011) Falcone A., Bongiorno S., Stroh M., Holder J., 2011, The Astronomer’s Telegram, 3152
- Falcone et al. (2010) Falcone A. D., Grube J., Hinton J., Holder J., Maier G., Mukherjee R., Skilton J., Stroh M., 2010, ApJ, 708, L52
- Hill et al. (2013) Hill A. B., Caliandro A., Fermi/LAT collaboration, Fermi/LAT collaboration, 2013, ArXiv e-prints
- Hinton et al. (2009) Hinton J. A. et al., 2009, ApJ, 690, L101
- Jogler (2011) Jogler T., 2011, International Cosmic Ray Conference, 7, 170
- Johnston et al. (1992) Johnston S., Manchester R. N., Lyne A. G., Bailes M., Kaspi V. M., Qiao G., D’Amico N., 1992, ApJ, 387, L37
- Maier (2011) Maier G., 2011, International Cosmic Ray Conference, 7, 79
- Maier et al. (2015) Maier G. et al., 2015, ArXiv e-prints
- Mattox et al. (1996) Mattox J. R. et al., 1996, ApJ, 461, 396
- Mori et al. (2013) Mori M., Kawachi A., Nagataki S., Naito T., 2013, ArXiv e-prints
- Moritani et al. (2015) Moritani Y. et al., 2015, ApJ, 804, L32
- Neronov & Chernyakova (2008) Neronov A., Chernyakova M., 2008, ApJ, 672, L123
- Ong (2011) Ong R. A., 2011, The Astronomer’s Telegram, 3153
- Pétri & Dubus (2011) Pétri J., Dubus G., 2011, MNRAS, 417, 532
- Skilton et al. (2009) Skilton J. L. et al., 2009, MNRAS, 399, 317
- Torres et al. (2010) Torres D. F. et al., 2010, ApJ, 719, L104
- Wilks (1938) Wilks S. S., 1938, The Annals of Mathematical Statistics, 9, 60
- Zdziarski, Neronov & Chernyakova (2010) Zdziarski A. A., Neronov A., Chernyakova M., 2010, MNRAS, 403, 1873