Monitoring in the Clouds: Comparison of ECO2Clouds and EXCESS Monitoring Approaches
Abstract
With the increasing adoption of private cloud infrastructures by providers and enterprises, the monitoring of these infrastructures is becoming crucial. The rationale behind monitoring is manifold: reasons include saving energy, lowering costs, and better maintenance. In the e-Science sector, moreover, the collection of infrastructure and application-specific data at high resolutions is immanent. In this paper, we present two monitoring approaches implemented throughout two European projects: ECO2Clouds and EXCESS. The ECO2Clouds project aims to minimize emissions caused by the execution of applications on the cloud infrastructure. In order to allow for eco-aware deployment and scheduling of applications, the ECO2Clouds monitoring framework provides the necessary set of metrics on different layers including physical, virtual and application layer. In turn, the EXCESS project introduces new energy-aware execution models that improve energy-efficiency on a software level. Having in-depth knowledge about the energy consumption and overall behavior of applications on a given infrastructure, subsequent executions can be optimized to save energy. To achieve this goal, the EXCESS monitoring framework provides APIs allowing developers to collect application-specific data in addition to infrastructure data at run-time. We perform a comparative analysis of both monitoring approaches, and highlighting use cases including a hybrid approach which benefits from both monitoring solutions.
Index Terms:
Cloud computing, metrics, performance, eco-awareness, deployment, schedulingI Introduction
Private cloud infrastructures are being increasingly adopted by providers and enterprises. They include heterogeneous computing, storage and networking resources, which are utilized by the variety of applications with diverse requirements. Thus, the monitoring of these infrastructures is becoming important. The reasons for sophisticated and timely monitoring include not only maintenance-related technical parameters, but also the analysis of advanced metrics which indicate how to utilize the infrastructure in order to save energy, lower costs and reduce emissions. At the same time, cloud infrastructures are often used in terms of e-Science research [1], which deals with sophisticated computer simulations and Big Data use cases. In such cases, the collection of infrastructure and application-specific data at high resolution is immanent.
Energy-awareness in cloud computing and HPC and embedded systems has become a priority in recent years [2]. Although performance keeps to be the topmost objective for companies, data centers have shown a high interest in reducing their energy consumption that continues to increase due to several reasons [3, 4, 5]: reasons include the advancement of Big Data, Fast Data (i.e., Big Data sets, which have to be processed in real-time), the Internet of Things (IoT), and the recent trend of employing Graphical Processing Units (GPUs) in order to speed up execution of compute-intensive scientific applications. The need for monitoring in high performance computing, in particular in cloud computing is driven by resource planning and management, data center management, SLA administration, billing, and performance management [6]. Aceto et al. [6] highlight that energy-efficiency is “a major driver of monitoring data analysis for planning, provisioning and management of resources”. Since increased energy consumption leads to extra operational costs, reducing energy is a driving factor for data centers [2].
In this paper, we present two different monitoring approaches focusing on energy-efficiency, which were implemented throughout European projects ECO2Clouds and EXCESS respectively.
The ECO2Clouds project aims to minimize emissions caused by the execution of applications on the cloud infrastructure. In order to allow for eco-aware deployment and scheduling of applications, the ECO2Clouds monitoring framework provides the necessary set of metrics on different layers including physical, virtual and application layers. The basic feature allowing for minimizing the emissions is the detailed mix of energy sources which cloud provider sites EPCC (Edinburgh Parallel Computing Centre), INRIA (French Institute for Research in Computer Science and Automation) and HLRS (High Performance Computing Center Stuttgart) are able to support. In addition to the installed power distribution units (PDUs) measuring the power consumption of physical nodes, the emissions size was computed. The difference between the energy mix of each site, as well as the heterogeneity of the computing resources within sites, allows for such a scheduling of applications execution that the overall carbon footprint (i.e., emissions) of an application is minimized.
Another implementation of a monitoring framework aiming at energy efficiency is proposed in the EU-funded project EXCESS (Execution Models for Energy-Efficient Computing Systems) [7]. Optimizing the energy consumption on an application level requires a deep understanding of the runtime behavior of applications. The EXCESS project introduces new energy-aware execution models that improve energy-efficiency. The validation and verification of the execution models is needed based on real monitoring data. The rationale behind the monitoring solution developed in the EXCESS project is to raise energy-awareness relevant for software developers. Having in-depth knowledge about the energy consumption and overall behavior of their applications on a given infrastructure, subsequent executions can be optimized to save energy. To achieve this goal, the EXCESS monitoring framework provides APIs allowing developers to collect application-specific data in addition to infrastructure data at run-time. The EXCESS monitoring framework provides fine-granular monitoring information without introducing extra costs on performance that interfere with the application. EXCESS is concerned with a holistic analysis of systems including the application, system software and hardware stack in order to detect preventable energy dissipation. The EXCESS monitoring framework enables improving the energy-efficiency in high performance computing and embedded systems, as well as in cloud computing.
In this paper, we perform a comparative analysis of the ECO2Clouds and EXCESS monitoring approaches We highlight the target use cases including a hybrid approach which benefits from both monitoring solutions.
The rest of this paper is structured as follows: we make an overview of the related work in Section II. In Sections III and IV, we describe the ECO2Clouds and EXCESS approaches, respectively. In Section V, we compare the presented approaches and discuss their suitable use cases. Finally, we conclude the paper in Section VI.
II Related Work
Next, we provide a brief overview about existing frameworks for monitoring in computing systems.
Existing systems for monitoring can be distinguished along three dimensions: agent-less, agent-based, and hybrid [8]. Agent-based monitoring systems have a client-server architecture. Prior to monitoring a component, agents, often light-weight applications, are installed remotely on target computers. Each agent then collects specific metric data such as the CPU usage over time. Periodically, collected data is sent to a monitoring server for storage and analysis. This approach is crucial for supporting custom, non-standard metrics such as the amount of time a server needs to respond to a request. Agent-less monitoring systems, by contrast, do not deploy agents on target computers to collect data; the data is rather gathered through remote calls, e.g., via the Simple Network Management Protocol (SNMP). As a consequence, this monitoring strategy is limited to basic hardware information available on all platforms by default. The advantage of such an approach is that no initial software has to be deployed on target computers and the following low impact on system performance at run-time. Hybrid solutions, finally, support both agent-based and agent-less monitoring. The ATOM framework of the EXCESS project follows an agent-based architecture in order to support application-specific metrics. In turn, the ECO2Clouds monitoring framework relies on the Zabbix-based agents.
Aside from the architecture, monitoring frameworks can be classified via the following nine key properties: scalability, non-intrusiveness, timeliness, granularity, extensibility, data storage, visualization, adaptability, and predictability and advanced metrics [6, 9, 10]. The meanings of these properties are listed below.
-
•
Architecture: agent-based (producer-consumer principle), agent-less or hybrid;
-
•
Non-Intrusiveness: low to very low impact on the system at run-time;
-
•
Scalability: high update frequencies of metrics while being low-intrusive;
-
•
Timeliness: near-real time update rates of metrics; allowing for “snapshots” at a given point in time;
-
•
Granularity: profile different levels of granularity (e.g., functions);
-
•
Extensibility: provide a plug-in system to add extra metrics; enable application-specific metric support; language-independent interface to transfer data;
-
•
Data Storage: low-intrusive, efficient data storage at run-time; data export using common formats (e.g., CSV or JSON); allow for filtering the data based on time intervals;
-
•
Visualization: provide basic visualization functionality;
-
•
Adaptability: enable/disable profiling of specific components configuration of plug-ins at run-time;
-
•
Predictability: predictors via extensions (e.g., prediction);
-
•
Metrics: non-standard metrics need to be supported; external measurements to increase data accuracy; profiling of specialized hardware.
These demands, in particular the latter one, are not easy to be met by existing monitoring frameworks such as Ganglia, Lattice, Nagios, Open-NMS, Zenoss, or Zabbix. For example, key requirements that need to be satisfied by a monitoring framework in case of the EXCESS project include supporting different granularity levels to be profiled, low-intrusiveness of the monitoring, and the possibility of code instrumentation. In case of the ECO2Clouds project, it is required to support non-standard -related metrics, predict the future energy usage and emissions and to provide a data storage for historic monitoring information.
III ECO2Clouds Approach
The major goal of the ECO2Clouds project is to enable such eco-aware automated deployment and execution of applications in the cloud, which optimizes the emissions caused by the physical infrastructure. In order to achieve this goal, the ECO2Clouds project introduces an approach to monitor the eco-metrics of the running applications on the different layers and performs the applications’ scheduling based on the retrieved monitoring values. Next, we describe the monitoring approach developed in the ECO2Clouds project. For more details about the scheduling used in ECO2Clouds, we refer the interested reader to the work of Wajid et al. [11].
III-A Architecture of the ECO2Clouds Monitoring Approach
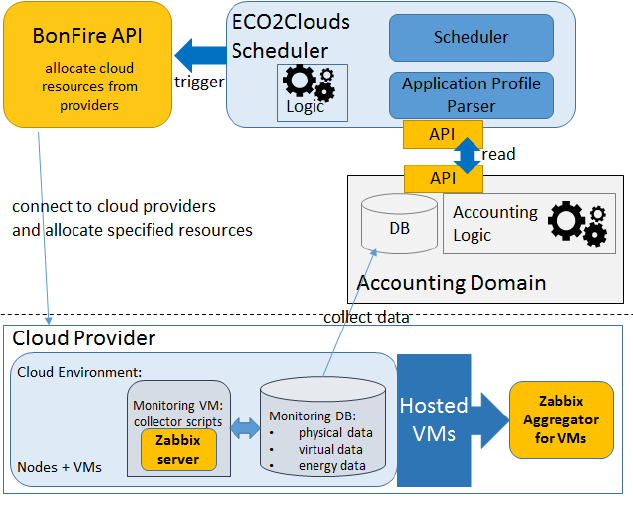
The is ECO2Clouds monitoring system is based on the monitoring framework for federated clouds which was developed during the course of the EU-funded BonFIRE project [12]. The general architecture of the ECO2Clouds monitoring system and its relation to the other project components is depicted in Figure 1 [13]. On the cloud provider side, a Zabbix server [14] running on a dedicated virtual machine (VM) collects the monitoring information from the Zabbix agents installed on physical nodes. The system monitors the metrics from (a) the physical infrastructure, (b) VMs, and (c) applications. The Zabbix monitoring data is gathered and structured in an Accounting SQL database by the Accounting Service which runs on a separate VM. The Accounting DB allows for various combinations of desired experiment, physical host, provider site, VM, and time frame to be specified in the selection queries. The monitoring data from the Accounting DB is then used by the ECO2Clouds Scheduler and Application Controller to provide eco-aware deployment of applications [11]. On the highest level, user manages the experiments (i.e., applications) and the cloud resources by using the RESTful BonFIRE API which is based on HTTP commands [15].
III-B ECO2Clouds Technology for Metrics Collection
The underlying ECO2Clouds solution which enables to consider the eco-aware metrics is equipment of physical hosts with power distribution units (PDUs). PDUs provide monitoring systems with exact values of power consumption measurements, which are later transformed into the carbon footprint (i.e., emissions). The consequent calculation of carbon footprint based on power consumption parameters is possible, since the distribution of power sources are known for each cloud infrastructure provider.
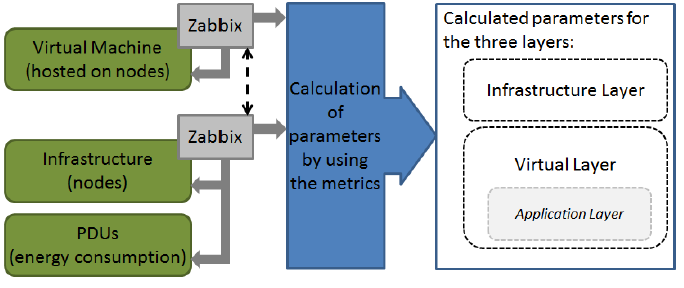
Zabbix clients are installed on each physical node and VMs. They collect the pre-defined metrics including the usual metrics such as memory utilization, I/O throughput and CPU utilization for VMs as well as PDU-based metrics for physical nodes (see Figure 2). The measurement rate differs from 5 to 30 seconds for various metrics, and the resulting data set was observed to add up to 100 Mbytes per day, depending on the number of running experiments. The Zabbix server (i.e., metrics aggregator) installed on a dedicated VM (one per each experiment) gathers all the metrics information from the Zabbix clients within a given experiment.
Different hardware configurations and different conditions regarding the used energy mix of the providers (EPCC, INRIA and HLRS) were challenging. In order to adapt the monitoring metrics implementation at all provider sites, Zabbix templates, bash, Python, and Ruby scripts were implemented.
III-C List of ECO2Clouds Metrics
One of the major contributions of the ECO2Clouds approach is calculation of a VM’s power consumption. It is determined through a formula depending on both physical and VM metrics. The metrics required for this include the size of a VM defined through the used memory, the data I/O (i.e., the send and receive activities), the disk activity (i.e., the read and write operations) and the consumed CPU seconds. The list of major ECO2Clouds metrics is presented in Tables I and II. Each metric is marked to indicate whether it is also supported by the EXCESS monitoring framework. We can see that the VM-related metrics are only supported by the ECO2Clouds project, while EXCESS approach provides energy metrics on the physical level. For more details about the ECO2Clouds metrics we refer to our previous work [11]
| Metric and layer | Definition | Unit | Support by MF of EXCESS |
|---|---|---|---|
| Task execution time (app. layer) | Time taken to execute a specific task | s | Yes |
| Application execution time (app. layer) | Time taken to execute whole application | s | Yes |
| Power consumption (app. layer) | Power currently consumed by application. | W | Yes |
| Response time (app. layer) | Average time taken from user request to service response | s | No |
| A-PUE (Application PUE) | Application power usage effectiveness; ratio between total amount of power (P) required by all VMs of application and the power used to execute -th application task | Ratio | No |
| Application Energy Productivity (A-EP) | Application Energy Productivity (A-EP); ratio between number of executions of tasks hosted by all VMs of -the application and total energy for execution of the VM | No | |
| Application Green Efficiency (A-GE) | Share of green energy used to run the -th application | W | No |
| CPU usage (virt. layer) | Processor utilization (inside a VM) for running VM | % | No |
| Storage usage (virt. layer) | Storage utilization on corresponding storage device; the ratio between the used disk space and the allocated disk space | % | Supportable |
| Metric and layer | Definition | Unit | Support by MF of EXCESS |
|---|---|---|---|
| I/O usage (virt. layer) | Percentage of process execution time in which the disk is busy with read/write activity | % | No |
| Memory usage (virt. layer) | Ratio of memory size used by VM to total memory available | % | No |
| Power consumption (virt. layer) | Power currently consumed by the given VM | W | No |
| Disk IOPS | Assessment of I/O operations of a virtual resource | No | |
| Site utilization (infr. layer) | Current utilization of a single site; ratio of available cores to total cores. | % | No |
| Storage utilization (infr. layer) | Percentage of frontend storage used | % | No |
| Availability (infr. layer, site) | Shows whether the OpenNebula OCCI server answers the requests | Bool | No |
| PUE (infr. layer) | Energy efficiency of a site; measured as ratio between total facility power and power used by computing equipment | Ratio | No |
| Power consumption (infr. layer) | Power consumed by given host in given time period | W | Supportable |
| Disk IOPS (infr. layer) | I/O operations of disk within host | IO/s | No |
| CPU utilization (Infr. layer) | Average utilization of CPUs inside host | % | No |
| Availability (infr. layer, host) | Availability of host | Bool | No |
| Green Efficiency Coefficient (GEC) (accounting) | Share of energy consumed by site that is produced by green energy sources | % | No |
| Site Infrastructure Efficiency (SIE) (accounting) | Share of power consumed by information technology equipment power of total facility power | % | No |
| Carbon Usage Effectiveness (CUE) (accounting) | Weighted average of CEFs related to energy sources used in site, where CEF is Carbon Dioxide Emission Factor taken from literature for each energy source | Ratio | No |
IV EXCESS Approach

The key idea behind EXCESS is a holistic system analysis incorporating high performance and embedded computing [7]. The iterative hardware/software co-design process implemented in the EXCESS project is illustrated in Figure 3. This EXCESS system’s major component is ATOM (neAr-real Time mOnitoring fraMework) [16]. ATOM is a monitoring framework which is suitable for both HPC and cloud computing. ATOM tackles the challenge of analyzing the system’s run-time context and overcoming the drawbacks of existing solutions. ATOM is designed to be low-intrusive and flexible, while allowing to collect, visualize, and analyze relevant application and infrastructure data in near-real time. The following items are crucial for optimizing the energy consumption and performance of applications at run-time, as well as improving energy-awareness in software engineering:
The main contributions of ATOM are:
-
•
Low-intrusive, scalable architecture based on open-source tools and libraries: Node.js, Elasticsearch, D3.js, and Kibana.
-
•
Flexible, language-independent plug-in system, which supports collecting specific data including the energy consumption of embedded systems, or connecting to external power measurement devices.
-
•
Light-weight and easy-to-grasp user library that allows code instrumentation in order to gather application-specific data not accessible globally.
-
•
Integration with the PBS resource manager to allow executing and monitoring applications without any prior knowledge by end users or software developers.
-
•
Interactive front-end allowing for near-real time exploration of collected data as well as exporting historical data for further analysis.

IV-A Agent-based Architecture
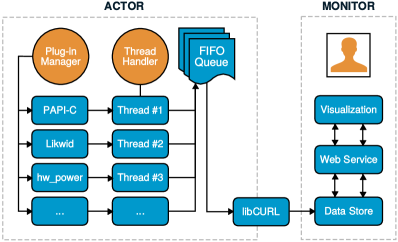
ATOM’s architecture, as depicted in Figure 4, is agent-based. ATOM is composed of two main components: a server (MONITORing server—MONITOR) and multiple, light-weight agents (Atom CollecTORS—ACTORS). The purpose of the ACTORS is to continuously sample node- and application-specific data and send this information to MONITOR using a user-defined update rate (e.g., every 100 milliseconds). MONITOR collects the data being sent by each target node and offers functionalities to query, visualize, and analyze historical data.
The cluster consists of several compute nodes including embedded hardware such as the Movidius Myriad 2 chip. When users start a job on the cluster, an ACTOR is started on each node to monitor relevant data while the job is running. ACTORS then send sampled data at run-time through a high-bandwidth network (InfiniBand) to the MONITOR server. MONITOR manages incoming data, stores it in the database, and also provides a web interface accessible by users.
IV-B ATOM Collectors (ACTORS)
An ACTOR is deployed on each target node. ACTORS have a set of plug-ins that can be implemented in any programming language; the only constraint is on the format used for transferring data to MONITOR. We selected the programming language C for ACTORS and plug-ins. High-level languages such as C++ or Java impose a performance overhead at run-time, and hence being too intrusive. Since ACTORS are by default extensible, developers can add plug-ins with ease in order to sample additional metrics. Plug-ins do not have any limitations on the type of metric to be collected as long as the data is sent to the server via a pre-defined data format; we selected JSON objects to hold metric data.
Figure 5 illustrates the three building blocks of an ACTOR: a plug-in manager, a thread handler, and a data management component in terms of a FIFO queue connected to libCURL. When ACTORS are started, a default or user-defined configuration file is parsed in order to activate/deactivate plug-ins, define the relevant metrics to be collected, and to set the sample rate for each plug-in. During initialization, an execution ID is requested from MONITOR; the execution ID is used to uniquely associate metric data with specific application executions. The thread handling routines then trigger the plug-in discovery and start a thread for each of the plug-ins using the sample rates previously defined in the configuration file. In addition to the threads shown in Figure 5, two extra threads are created: an extra thread aggregates and sends metric data to MONITOR, and another thread checks the configuration file for changes, which allows sample rates to be changed at run-time.
IV-C ATOM Monitoring Server (MONITOR)
The MONITOR server is deployed on a separate node in the EXCESS cluster. As illustrated in Figure 5, MONITOR is composed of three building blocks: a data store, a web service, and a visualization component. As a data storage component, Elasticsearch is used [17]. Elasticsearch is a flexible and powerful open source, real-time search and analytics engine. It provides a distributed, multi-tenant-capable full-text search engine with a RESTful web interface and schema-free JSON documents. As web server, the server-side JavaScript library Node.js is selected [18]. Since Node.js is based on Google’s V8 engine written primarily in C, Node.js qualifies to be used for data-intensive real-time applications that run across distributed devices. Basic visualization functionality is provided via the JavaScript library D3.js. This is a popular data visualization tool [19], which is also used by Datameer, a company concerned with visualization of big data [20].
The benefits of using these frameworks are manifold: Firstly, the common shared data format JSON eases the integration of components. Secondly, employing Elasticsearch as (historical) data storage bypasses a drawback that existing monitoring frameworks such as Nagios or Zabbix impede: They rely on traditional databases such as MySQL that restrict third-party developers in using pre-defined data models, and cannot handle vast amounts of data writes and reads in near-real time. With ATOM, we offer developers the flexibility of selecting their custom JSON objects to store metric data as long as they provide a few mandatory fields (cf. Section IV-D). In addition, NoSQL databases such as Elasticsearch offer a feature called auto-sharding, which distributes data automatically and on-demand across multiple nodes in order to balance query and data load. This feature, among others, makes Elasticsearch an excellent choice to be used in HPC environments.
IV-D Communication Layer
JSON is selected as the primary data format for data exchange between all ATOM components; the actual communication between the ACTORS and MONITOR is realized via HTTP. MONITOR exposes a RESTful interface that each ACTOR can access through simple CURL commands.
IV-E Monitoring Hierarchy
Since EXCESS follows a holistic approach to energy reduction, we are interested in profiling different hierarchy levels of the hardware and software stack: infrastructure, applications, and functions. Profiling functions, in particular, require code instrumentation. Code instrumentation is hardly supported by existing monitoring frameworks, because it introduces an additional performance overhead. Up to date, ATOM supports the following metrics by default: PAPI-C [21], RAPL [22], Likwid [23], /proc/meminfo, iostat, and hw_power [24]. It should be noted that metric support will be extended in the future; current plug-ins were selected, because they represent a minimal set of basic metrics to be considered for profiling.
Infrastructure
ATOM currently includes the following plug-ins in order to monitor the infrastructure. For performance data, we rely on PAPI-C and /proc/meminfo. In order to monitor the energy consumption at run-time, we implemented plug-ins for RAPL and Likwid. An external power measurement system is installed in addition on the EXCESS cluster (cf. Figure 4) to monitor the energy consumption of specific components such as the CPU, the GPU, or the whole computational node with high accuracy.
Applications
In order to profile applications, PAPI-C and iostat can be used to measure performance. Although PAPI-C is a so-called first-person monitoring tool, i.e. it monitors a specific process or thread, we implemented a third-person variant collecting data on a per-core basis. To the best of our knowledge, there exists currently no approach to sample the energy consumption of specific applications or smaller building blocks. We tackle this challenge by monitoring the execution of particular functions by using code instrumentation.
Functions
Performing a thorough analysis of applications requires to monitor the run-time behavior of functions, and to collect additional application-specific metric data that is normally not supported by existing performance or energy measurement tools. Such data includes, for example, the number of user requests to a web service. As a consequence, we have implemented a light-weight library for source code instrumentation, which acts like an extra plug-in loaded by an ACTOR. The library has the following key features:
-
•
sending application-specific data,
-
•
profiling specific code fragments (e.g., monitoring execution times of functions), and
-
•
retrieving historic metric data for code optimization at run-time.
In particular, the last two items are of great interest for EXCESS, because we are interested in optimizing applications in order to yield a better trade-off between energy and performance at run-time. By profiling critical code fragments, and being able to directly get feedback about performance and energy consumption, we can directly use the data as input for optimization of future prediction models.
IV-F Extensibility
Custom plug-ins are language-independent due to the following three reasons: a) the entire communication is based on HTTP, b) the data exchange format is JSON, and c) MONITOR provides a RESTful interface. ACTORS are currently written in C, and plug-ins are loaded via shared objects at run-time. The plug-in for iostat is realized as a Unix shell script using the streaming support of awk to parse the output of iostat in order to continuously send new metric data to MONITOR.
V Comparison and Analysis
Concerning the system architecture, both monitoring frameworks rely on the agent-server architecture. The monitoring agents called ACTOR written in C and utilized in EXCESS, while slower yet more advanced Zabbix agents are used in ECO2Clouds. Next, we consider the major differences between the proposed approaches.
In contrast to the ECO2Clouds project, the EXCESS project is concerned with a holistic analysis of systems including the application, system software, and hardware stack in order to detect preventable energy dissipation (cf. Figure 3). Thus, its first goal is not eco-ware automated deployment, but rather enabling software developers to write energy-efficient applications across different infrastructures. EXCESS sees a need for a sophisticated co-design process between software and hardware while developing.
Optimizing the energy consumption involves a thorough analysis of all layers involved, in particular the hardware and software layer. From a hardware point of view, EXCESS develops new energy-saving components such as the Movidius Myriad 2 platform [25]. On the software side, EXCESS evaluates sophisticated solutions with respect to energy-efficient libraries and algorithms.
The EXCESS approach provides near-real time monitoring: the maximal possible frequency of updates achieves 10 Hz, while the Zabbix system of the ECO2Clouds monitoring framework updates data only once per 5 seconds for the most metrics. As our experiments have shown, the CPU performance overhead of the EXCESS monitoring framework does not exceed 3% assuming that the sampling is not more frequent than one per second. In turn, the CPU overhead caused by the ECO2Clouds Zabbix agents is closer to 10% if the number of monitoring metrics is higher than 15. However, a system based on Zabbix also supports virtual layer metrics in addition to the physical level.
The monitoring server (MONITOR component) of the EXCESS monitoring framework is collecting data, where Elasticsearch database is used in order to store monitoring data. The ECO2Clouds Monitoring component based on a standard Zabbix aggregator relying on MySQL DB is used in the ECO2Clouds monitoring framework, which allows for maintaining more complex data models with interconnected tables.
Definition of custom metrics is possible within EXCESS monitoring framework by simply editing a C configuration file. This is also possible within the ECO2Clouds monitoring framework by using the corresponding functionality of Zabbix and the energy-related values provided by the PDUs.
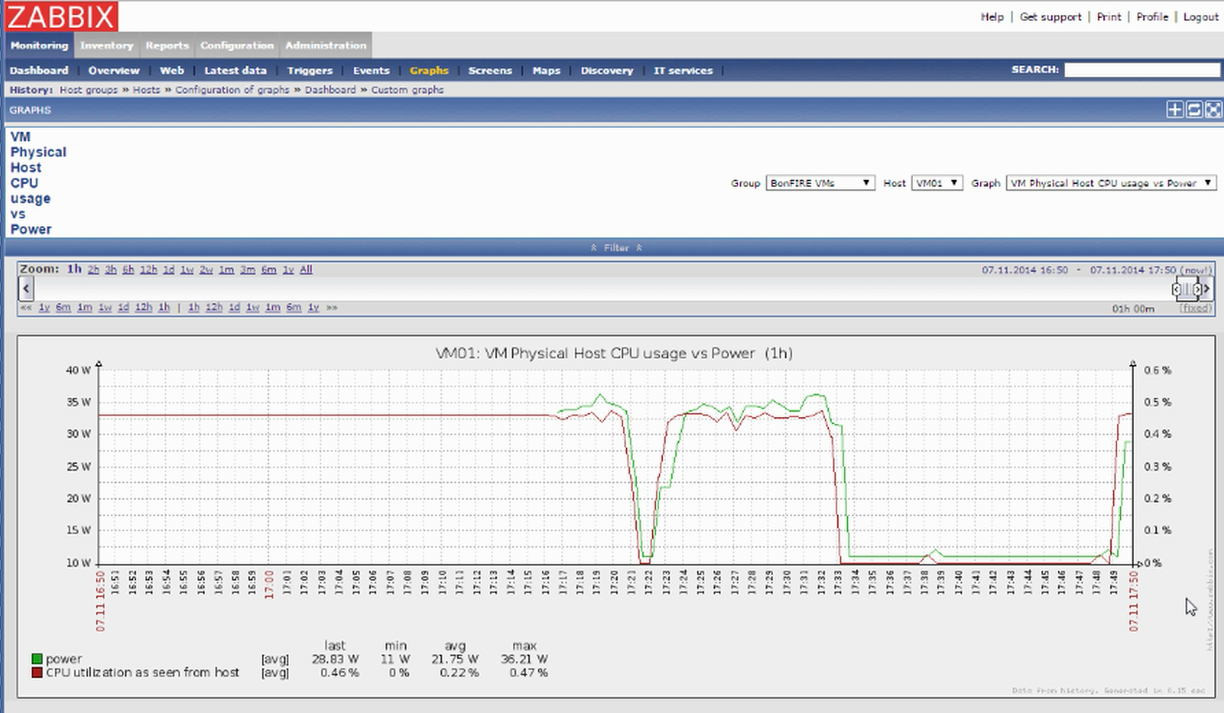
A GUI was developed for the ECO2Clouds approach in order to visualize the predicted emissions of the application and therefore to help user with choosing the optimal deployment (cf. Figure 6). In addition, ECO2Clouds monitoring framework allows for using the standard Zabbix-based visualization of metrics (cf. Figure 7).
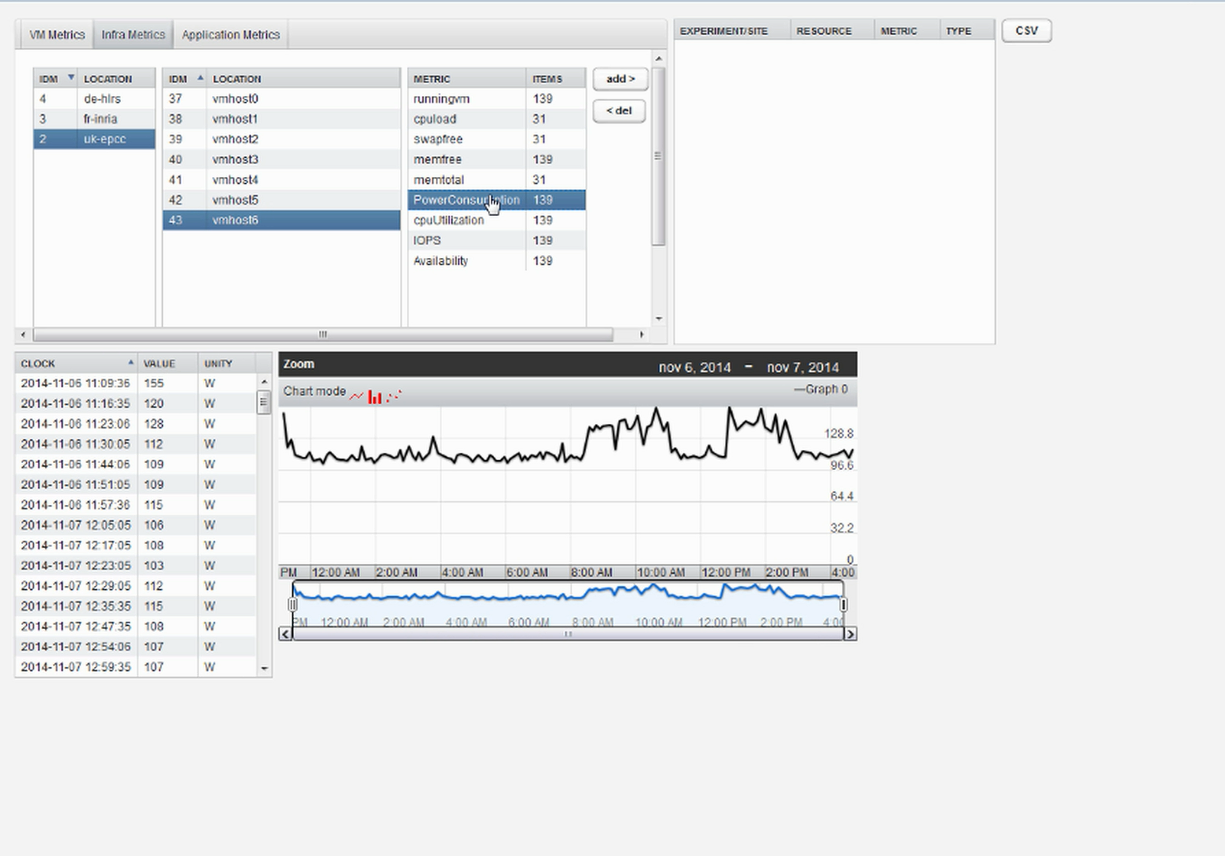
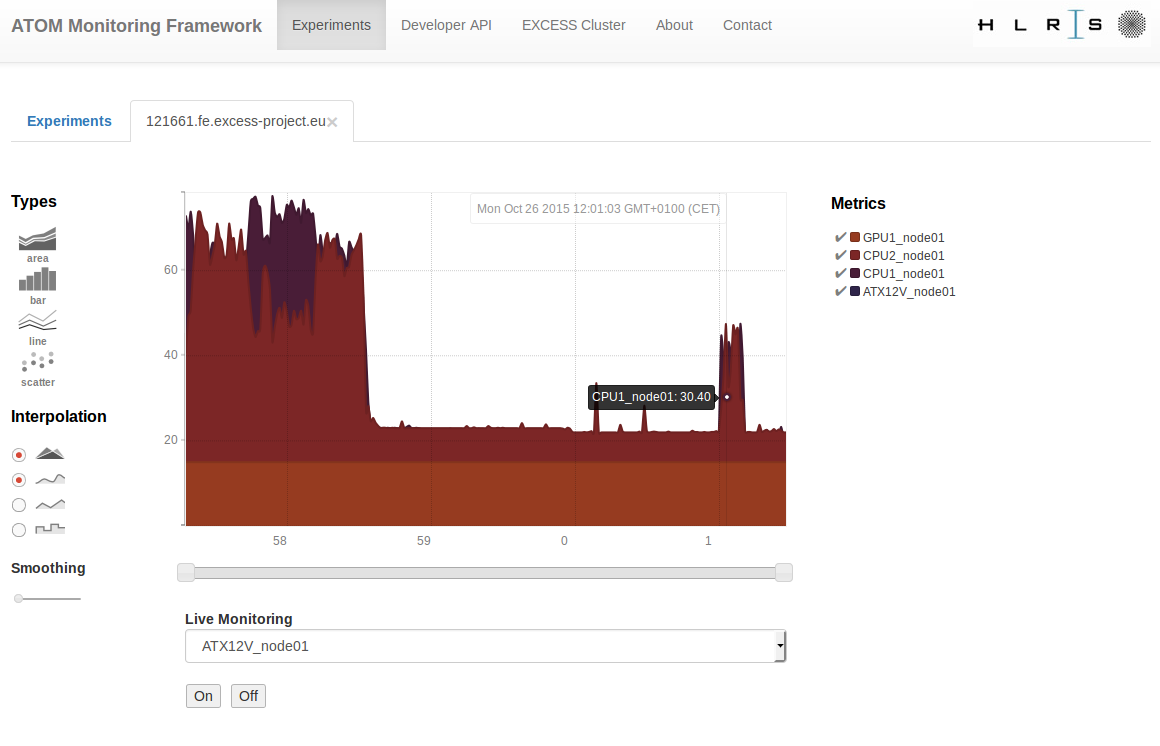
A similar GUI was developed on the top of EXCESS monitoring framework, which shows a diagram for the specified metric values for the given time frame (cf. Figure 8).
To summarize our comparison, we consider the key properties which characterize monitoring frameworks according to the literature [6, 9, 10]. Such properties with respect to the ECO2Clouds and EXCESS monitoring frameworks are listed in Table III. We can conclude that the EXCESS monitoring approach is better suitable for lightweight monitoring of physical hardware, especially if it is required to be conducted in real time, while the ECO2Clouds monitoring approach is better to be used to collect sophisticated user-defined metrics on virtual and application level.
| Key property | ECO2Clouds monitoring framework | EXCESS monitoring framework |
|---|---|---|
| Architecture | agent-based | agent-based |
| Non-intrusiveness | medium | low-intrusive |
| Scalability | low update frequency | high update frequency |
| Timeliness | one update per second | near-real time update |
| Extensibility | extra metrics possible via Zabbix | extra metrics possible via custom plug-ins |
| Data Storage | MySQL DB | Elasticsearch |
| Visualization | Zabbix-based | web-based |
| Adaptability | run-time configuration | run-time configuration |
| Predictability | no | no |
VI Conclusion
In this paper, we described two alternative solutions for monitoring frameworks originated from the ECO2Clouds and EXCESS EU projects.
The EXCESS monitoring framework is well suited for the fine-granular metrics gathering on the physical host level. Relying on agent-based architecture, it provides low-intrusive real-time monitoring.
In turn, the ECO2Clouds monitoring framework provides more advanced energy-aware metrics support on physical, virtual and application level. It allows for the scheduler to optimize the applications deployment between cloud provider sites as well as within a single cloud in order to minimize the resulting emissions.
Acknowledgment
The research leading to these results has received funding from the European Union Seventh Framework Programme (FP7/2007-2013) under the grant agreements 611183 (EXCESS Project) and 318048 (ECO2Clouds Project).
References
- [1] J. Gray, “Jim Gray on e-Science: A Transformed Scientific Method,” NRC-CSTB, Jan. 2007.
- [2] G. Valentini, W. Lassonde, S. U. Khan, N. Min-Allah, S. A. Madani, J. Li, L. Zhang, L. Wang, N. Ghani, J. Kolodziej, H. Li, A. Y. Zomaya, C.-Z. Xu, P. Balaji, A. Vishnu, F. Pinel, J. E. Pecero, D. Kliazovich, and P. Bouvry, “An overview of energy efficiency techniques in cluster computing systems,” Cluster Computing, vol. 16, no. 1, pp. 3–15, 2013.
- [3] R. Basmadjian, H. De Meer, R. Lent, and G. Giuliani, “Cloud Computing and its Interest in Saving Energy: The Use Case of a Private Cloud,” Journal of Cloud Computing, vol. 1, no. 1, pp. 1–25, 2012.
- [4] L. Liu, H. Wang, X. Liu, X. Jin, W. B. He, Q. B. Wang, and Y. Chen, “GreenCloud: A New Architecture for Green Data Center,” in Proceedings of the 6th International Conference Industry Session on Autonomic Computing and Communications Industry Session, ser. ICAC-INDST ’09. New York, NY, USA: ACM, 2009, pp. 29–38.
- [5] M. S. Obaidat, A. Anpalagan, and I. Woungang, Handbook of Green Information and Communication Systems, 1st ed. Academic Press, 2012.
- [6] G. Aceto, A. Botta, W. De Donato, and A. Pescapè, “Cloud Monitoring: A Survey,” Computer Networks, vol. 57, no. 9, pp. 2093–2115, 2013.
- [7] B. Koller, U. Küster, Y. Sandoval, D. Khabi, and M. Gienger, “EXCESS: Execution Models for Energy-Efficient Computing Systems,” inSiDE—Journal of Innovative Supercomputing in Germany, vol. 12, no. 2, 2014.
- [8] up.time Software, “The Truth about Agent vs. Agentless Monitoring,” http://www.uptimesoftware.com/pdfs/TruthAboutAgentVsAgentLess.pdf, accessed: 2015-03-13.
- [9] G. Katsaros, R. Kubert, G. Gallizo, and T. Wang, “Monitoring: A fundamental Process to provide QoS Guarantees in Cloud based Platforms,” in Cloud Computing: Methodology, System, and Applications. CRC Press–Taylor and Francis Group, 2011.
- [10] A. Telesca, F. Carena, W. Carena, S. Chapeland, V. Chibante Barroso, F. Costa, E. Dénes, R. Divià, U. Fuchs, A. Grigore, C. Ionita, C. Delort, G. Simonetti, C. Soós, P. Vande Vyvre, and B. von Haller, “System Performance Monitoring of the ALICE Data Acquisition System with Zabbix,” Journal of Physics: Conference Series, vol. 513, no. 6, Jun. 2014.
- [11] U. Wajid, c. cappiello, P. Plebani, B. Pernici, N. Mehandjiev, M. Vitali, M. Gienger, K. Kavoussanakis, D. Margery, D. Perez, and P. Sampaio, “On achieving energy efficiency and reducing co2 footprint in cloud computing,” Cloud Computing, IEEE Transactions on, vol. PP, no. 99, pp. 1–1, 2015.
- [12] Y. Al-Hazmi, K. Campowsky, and T. Magedanz, “A monitoring system for federated clouds.” in CLOUDNET. IEEE, 2012, pp. 68–74.
- [13] A. Tenschert, P. Skvortsov, and M. Gienger, “Eco-efficient cloud resource monitoring and analysis,” in Joint Workshop Proceedings of the 2nd International Conference on ICT for Sustainability 2014, Stockholm, Sweden, August 24-27, 2014., 2014, pp. 14–17. [Online]. Available: http://ceur-ws.org/Vol-1203/EES-paper4.pdf
- [14] Zabbix, “The enterprise-class monitoring solution,” http://www.zabbix.com/, September 2015.
- [15] B. E. Project, “BonFIRE API Documentation,” http://doc.bonfire-project.eu/R4.0.5/reference/bonfire-api-spec.html, accessed: 2015-11-01.
- [16] D. Hoppe, Y. Sandoval, and M. Gienger, “Atom: A near-real time monitoring framework for hpc and embedded systems,” July 2015.
- [17] Elastic, “Elasticsearch—The Definitive Guide,” http://www.elasticsearch.org/guide/en/elasticsearch/guide/current/, accessed: 2015-10-01.
- [18] The OpenNMS Group, Inc., “The OpenNMS Project,” http://www.opennms.org/, accessed: 2015-03-24.
- [19] M. Bostock, J. Heer, and V. Ogievetsky, “D3.js—Data-Driven Documents,” http://d3js.org/, accessed: 2015-10-01.
- [20] C. Viau, “What’s behind our Business Infographics Designer? D3.js of course.” http://www.datameer.com/blog/uncategorized/whats-behind-our-business-infographics-designer-d3-js-of-course-2.html, accessed: 2015-03-24.
- [21] Dan Terpstra and Heike Jagode and Haihang You and Jack Dongarra, “Collecting Performance Data with PAPI-C,” in Tools for High Performance Computing 2009, M. S. Müller, M. M. Resch, W. E. Nagel, and A. Schulz, Eds. 3rd Parallel Tools Workshop, Dresden, Germany: Springer, 2009, pp. 157–173.
- [22] M. Hähnel, B. Döbel, M. Völp, and H. Härtig, “Measuring Energy Consumption for Short Code Paths Using RAPL,” SIGMETRICS Perform. Eval. Rev., vol. 40, no. 3, pp. 13–17, Jan. 2012.
- [23] J. Treibig, G. Hager, and G. Wellein, “LIKWID: A Lightweight Performance-oriented Tool Suite for x86 Multicore Environments,” in Proceedings of the 1st International Workshop on Parallel Software Tools and Tool Infrastructures, San Diego CA, 2010.
- [24] D. Khabi, “D5.2: Prototype of an Energy-aware System based on Conventional HPC Technology,” The EXCESS Project (FP7/2013-2016 grant agreement no 611183), Public Deliverable, 2014.
- [25] Movidius Ltd., “Myriad 2 Vision Processor,” http://assets5.movidius.com/wp-content/uploads/2014/07/MYRIAD2_MA2100A_ProductBrief.pdf, accessed: 2015-03-30.