The PDS 66 Circumstellar Disk as seen in Polarized Light with the Gemini Planet Imager
Abstract
We present H and K band imaging polarimetry for the PDS 66 circumstellar disk obtained during the commissioning of the Gemini Planet Imager (GPI). Polarization images reveal a clear detection of the disk in to the inner working angle (IWA) in H band, almost 3 times as close to the star as the previous HST observations with NICMOS and STIS ( effective IWA). The centro-symmetric polarization vectors confirm that the bright inner disk detection is due to circumstellar scattered light. A more diffuse disk extends to a bright outer ring centered at 80 AU. We discuss several physical mechanisms capable of producing the observed ring + gap structure. GPI data confirm enhanced scattering on the East side of the disk which is inferred to be nearer to us. We also detect a lateral asymmetry in the South possibly due to shadowing from material within the inner working angle. This likely corresponds to a temporally variable azimuthal asymmetry observed in HST/STIS coronagraphic imaging.
Subject headings:
instrumentation: adaptive optics, protoplanetary disks, stars: individual (PDS 66), techniques: high angular resolution, techniques: polarimetricSIXtablenumtablenum
1. Introduction
Classical T Tauri stars (cTTS) with optically-thick, gas-rich protoplanetary disks provide valuable knowledge of the precedent conditions for planet formation. By comparing the observed intensity in scattered light to radiative transfer models, we can infer the grain properties (size, density, composition) and the geometry at the surface of the disk (e.g. Graham et al., 2007; Murakawa, 2010).
| Exp. | # of | Coronagraph | Field | ||||
|---|---|---|---|---|---|---|---|
| Date | Mode | Band | Time (s) | Exposures | Spot Size (”) | Rotation () | Notes |
| 2014 May 14 | Spectral | 59.6 | 10 | 0.246 | 3.5 | 0.5 – 0.8 seeing, high winds | |
| 2014 May 15 | Polarization | 59.6 | 32 | 0.246 | 13.3 | 0.7 – 1.0 seeing | |
| 2014 May 15 | Polarization | 59.6 | 16 | 0.306 | 11.4 | 0.7 – 1.0 seeing |
The Gemini Planet Imager (GPI) was designed to overcome the contrast problem inherent in the detection of circumstellar material within from their host stars. GPI combines an advanced adaptive optics (AO) system, an apodized coronagraph, and an IR integral field spectrograph with both spectral and polarimetric modes (Macintosh et al., 2014; Larkin et al., 2014; Perrin et al., 2015).
PDS 66 (MP Muscae) is one of the closest T Tauri stars. It was identified as part of the Pico Dos Dias Survey (Gregorio-Hetem et al., 1992). Mamajek et al. (2002) classified PDS 66 as a member of the Lower Centaurus Crux (LCC) subgroup with a mean age of Myrs. Mamajek et al. (2002) list PDS 66 as a K1 spectral type star with a kinematic parallax distance of pc and age estimates ranging from 7 – 17 Myrs. PDS 66 was the only cTTS found in their sample of over 100 pre-main-sequence stars. Torres et al. (2008) first suggested that PDS 66 is more likely a member of the Cha Association. Murphy, Lawson, & Bessell (2013) reinvestigated the membership of PDS 66 and found that the proper motion is more consistent with Cha (age: 5 – 7 Myrs, kinematic distance: pc). The membership of PDS 66 remains somewhat uncertain between LCC and Cha. Given that the disk properties of PDS 66 appear to be inconsistent with the LCC, and the younger age of Cha is below the typical disk dissipation timescale of 10 Myr (Haisch et al., 2001), in this paper, we adopt the age and distance appropriate for eps Cha.
The PDS 66 disk is in an interesting evolutionary stage. The spectral energy distribution (SED) lacks signs of large-scale evolution or an inner clearing. Based on the 1.2 mm continuum flux Carpenter et al. (2005) estimated a total dust mass of . Schütz et al. (2005) modeled the PDS 66 mid-infrared spectra and SED and infer an inner disk radius consistent with the dust sublimation radius of 0.1 AU. However, Cortes et al. (2009) compare the PDS 66 SED to the median Taurus SED and find a flux decrement between 4-20 microns, indicating a partial clearing of material in the disk. CO measurements by Kastner et al. (2010) show a molecular gas disk extending out to 120 AU with a lower limit for the gas mass of . Although uncertain, this suggests a lower gas-to-dust ratio limit of . Even though the accretion rate inferred for PDS 66 is small for a cTTS (estimates range from to Pascucci et al., 2007; Ingleby et al., 2013), the implied accretion timescale is short, yrs. (based on the disk mass inferred from CO).
The PDS 66 circumstellar disk was first resolved in HST/NICMOS imaging by Cortes et al. (2009). They detected a disk with an outer radius of 170 AU, and an inclination of . The authors also provide evidence for grain growth through an analysis of the spectral energy distribution. Likewise, Bouwman et al. (2008) obtained Spitzer spectroscopy () and found that the dust grain properties are well fit by a model consisting of amorphous olivine and pyroxene with average particle sizes of a few microns. Schneider et al. (2014) obtained deep HST/STIS coronagraphy showing consistent geometry, albeit with detection of faint halo extending out to beyond 520 AU.
PDS 66 was observed during the commissioning of GPI to test instrument performance on a typical bright, nearby disk. Our GPI observations are described in Section 2. The morphology of the PDS 66 disk as seen in polarized light with GPI is discussed in Section 3. We place limits on our sensitivity to planetary companions in Section 4. Section 5 discusses the results.
2. Observations
Coronagraphic imaging polarimetry and spectroscopy of PDS 66 were obtained in 2014 May (Table 1). The GPI Integral Field Spectograph (IFS) has a plate scale of arcseconds/pixel, a FOV of 2.8 X 2.8 arcsec2, and an angular resolution of in H band (Macintosh et al., 2014; Larkin et al., 2014). Data were reduced using the GPI Data Reduction Pipeline; see Perrin et al. (2014) and references therein. Data were obtained in high wind conditions with the AO system operating at 500Hz. For the spectral mode data, the raw frames were dark subtracted, corrected for bad pixels, destriped to correct for variations across read-out channels, and Fourier filtered to remove microphonics noise. A wavelength calibration using arc lamp data taken before the sequence is used to convert the raw images to 3D spectral datacubes (Wolff et al., 2014). The location of the star behind the coronagraphic mask was measured from the satellite spots (Sivaramakrishnan & Oppenheimer, 2006; Wang et al., 2014) and the data were corrected for spatial distortion.
In polarimetry mode, frames are taken in sets of four different half-wave plate rotations and combined to form Stokes cubes with slices I, Q, U, and V. Data are dark subtracted, destriped, and a thermal sky background is subtracted (in K1 band only). The individual frames are converted into two orthogonal polarization states using a spot location calibration file that has been corrected for elevation-induced flexure. Each cube is divided by a low pass filtered flat field to correct for low frequency variations (Millar-Blanchaer et al., 2015). The mean stellar polarization and instrumental polarization are subtracted and the polarization pairs are cleaned via a double difference algorithm (Perrin et al., 2015). The satellite spots are again used to determine the location of the occulted star and to calibrate the flux of the disk using a conversion factor of ADU coadd-1 s mJy arcsec-2 in H band and mJy arcsec-2 in K1 band (Hung et al., 2015).
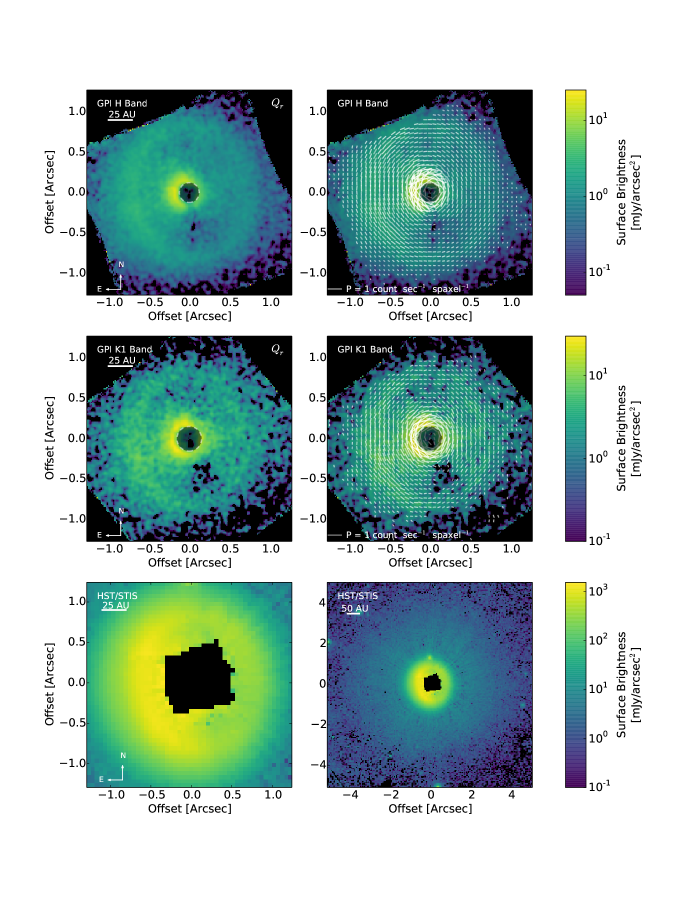
Figure 1 shows the H and K1 band polarimetry for PDS 66 with the Stokes vectors giving the orientation. Here the Stokes parameters have been transformed to radial Stokes parameters (Schmid et al., 2006). The image contains the polarization oriented in the tangential direction in the disk, contains the radial polarization and contains the polarization oriented from . For an optically thin disk, the image should contain no polarized flux from the disk and can be treated as a noise map. For an optically thick disk like PDS 66, multiple scattering events can result in non-negligible brightness, at a few % of the signal for low-inclination disks (Canovas et al., 2015). Given this small amplitude, we adopt the channel as a measure of our errors, recognizing that the contribution of both noise and potential signal renders it a conservative estimate.
The spectral mode data were PSF-subtracted using the pyKLIP software (Wang et al., 2015)111https://bitbucket.org/pyKLIP/pyklip. pyKLIP combines both Spectral Differential Imaging (SDI: for spectral mode data) and Angular Differential Imaging (ADI) using the Karhunen-Loeve Image Projection (KLIP) algorithm (Soummer et al., 2012). Due to the face-on nature of the disk, recovery of the total intensity is difficult via ADI. We leave forward modeling of the disk’s total intensity surface brightness, and calculation of the polarization fraction, to future work.
3. Disk Morphology
The GPI data reveal a bright disk interior to a more diffuse disk extending to an outer ring, and an azimuthal asymmetry indicative of interesting structure close in to the central star (Figure 1). We also show the STIS data provided by Schneider et al. (2014) to illustrate the fainter outer halo outside the field of view of GPI. The inner disk likely extends from the sublimation radius to the change in the power law slope at 45 AU. The region between the inner disk and outer ring (45 – 80 AU) is not entirely cleared, as evidenced by the azimuthal orientation of the polarization vectors.
We fit an ellipse to the brightness contours in the outer disk ring using the constrained, linear, least squares method described in Fitzgibbon et al. (1996). We find a position angle for the disk major axis of E of N, an axial ratio of , and a disk inclination of from a face on viewing geometry. These values agree well with the STIS results (minor:major axial ratio , inclination degrees: Schneider et al., 2014). We measure no stellocentric offset to within 30mas, consistent within errors with the offset in the STIS observations of mas (Schneider et al., 2014). Low SNR in the satellite spots of these observations limits our knowledge of the obscured star’s location to within pixels.
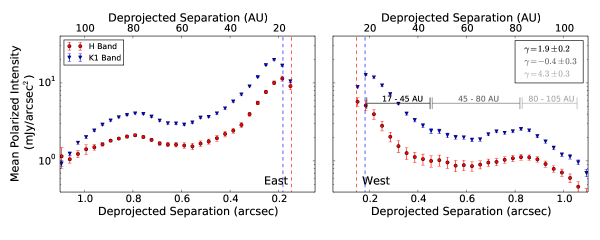
We deproject the disk and calculate a radial brightness profile (Figure 2) separately for the East and West sides of the disk. Note that the peak in surface brightness is slightly offset from the edge of the coronagraphic mask. This is likely due to a lower throughput from an instrumental effect rather than a decrease in the surface density of the disk (See also Rapson et al., 2015). The East side of the disk is brighter in both total intensity (STIS/NICMOS) and polarized intensity (GPI). Since we expect the dust particles in the disk to be predominately forward scattering, we conclude that the East side is the nearer side. We fit power laws to the surface brightness profile in the inner disk, the central region, and the outer ring (see Figure 2). The power law slope in the inner disk is consistent with an optically thick, gas-rich disk. For the outer component (80 – 105 AU), the GPI power law fit agrees well with the STIS and NICMOS result (Cortes et al., 2009).
After correcting for extinction ( mag; Cortes et al. (2009)) and stellar color (assuming a K1 spectral type with intrinsic H-K = 0.14), the azimuthally-averaged apparent color of the disk is H-K in polarized intensity, implying that the dust in the disk is 50% more effective at reflecting K1 band light than H band light. In H band, the East side of the disk is 2.1 times brighter than the West side, while the East side is only 1.6 times brighter than the West in K1 band. The E/W flux ratio is much lower than seen in total intensity in the visible (Schneider et al., 2014), which suggests either more isotropic scattering and/or a high polarization fraction on the (fainter) W side.
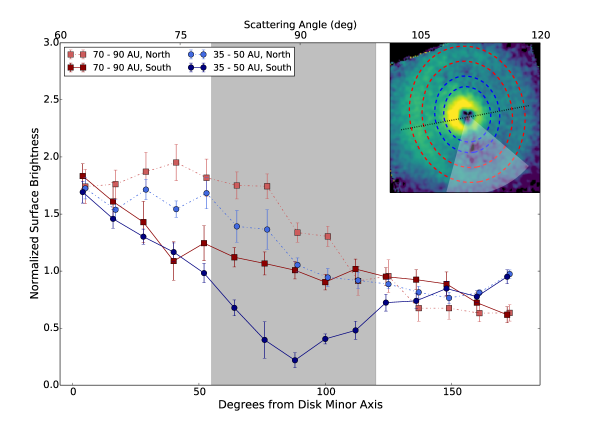
A region within the south side of the disk appears depleted in polarized intensity in both H and K1 bands. Figure 3 shows the azimuthal brightness variations for two disk annuli (35 – 50 AU and 70 – 90 AU) computed from the mean and standard deviation in wedges. In the 35 to 50 AU region, there is a 35 % decrease in the surface brightness from PA (measured E from N). Schneider et al. (2014) also saw brightness asymmetries of 30% between two epochs of data spaced three months apart. Though at a different parallactic angle, the drop in brightness subtends approximately the same angular fraction of the disk.
4. Planetary Companion Limits
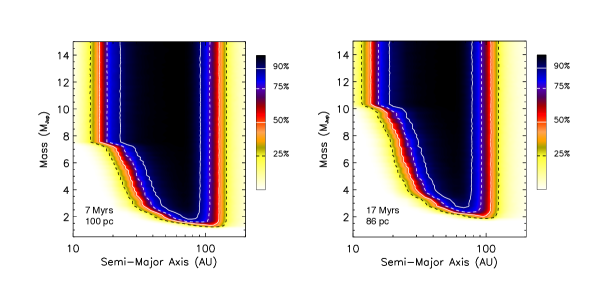
Our spectral data constrain planetary companions of a given mass and age. We compute a contrast curve assuming a methane dominated planetary spectrum. We achieve a contrast of outside of 0.3 and outside of 0.4. We detect no planetary candidates, but we recover a bright source in the north at 50, which was previously confirmed as a background source (Schneider et al., 2014; Cortes et al., 2009).
Planet sensitivities are calculated following Nielsen & Close (2010) and Nielsen et al. (2008) (Figure 4). The contrast curve is used to set companion brightness limits with radius. The brightness of a planet with a given mass and age are set by the hot start evolutionary tracks of Baraffe et al. (2003). For an age of 7 Myr and a distance of 100 pc ( Cha membership) there is a 90 % confidence that we would have detected a 8 planet at 20 AU or a 3 planet outside of 40 AU. At 17 Myrs and 86 pc (LCC membership), the 90 % confidence limits increase to a 10 planet at 20 AU. Planetary companions may exist, but lack a methane absorption feature, or could be low-mass enough to remain hidden below the opaque disk surface.
5. Discussion
PDS 66 joins the class of pre-transitional disks (Espaillat et al., 2010) with an optically thick inner disk separated from an outer disk by a dip in surface brightness around that could indicate a partial clearing of the disk. The gap/ring structure observed in our GPI data, combined with the detection of orbiting CO (Kastner et al., 2010) confirm that PDS 66 closely resembles the V4046 Sgr and TW Hya systems. All are nearby cTTS that have retained their molecular gas to late ages and show multi-ringed structures. GPI polarimetry was used to confirm the presence of scattering dust in the gaps of the V4046 Sgr multi-ringed structure (Rapson et al., 2015a). TW Hya is multi-ringed with partially filled gaps as well (Debes et al., 2013; 2015arXiv151201865R).
If the disk is optically thick, the ring/gap structure is a result of a variation in the disk surface that could be caused by a change in the surface density, the local scale height, or the dust properties of the sub-micron sized grains in the disk. Here we discuss possible sources for a change in the disk surface properties:
-
(a)
Gap Opening Planets: A planet/(s) in the low surface brightness region could induce a gap in the dust disk and deplete the gas (Dong et al., 2015). Dust filtration is efficient at piling up larger dust particles (mm-sized) into a ring at the pressure bump outside of a gas gap (Zhang et al., 2015), while smaller grains (responsible for scattered light) could still populate the gap. Given the observed width ( AU) and the shallow depth (ring:gap = 1.4), this is most likely a planetary system with several sub-jupiter mass planets.
-
(b)
Disk Shadowing: A scale height enhancement in the inner part of the disk shadows the outer disk, until the flaring of the disk eventually brings the disk surface above the penumbra. Dong (2015) find that a puffed up inner wall can create a three part broken power law in the radial brightness profile, as seen in the GPI data. A shadow cast out to 80 AU would require a flat disk and/or a low flaring exponent.
-
(c)
Dust Particle Properties: A localized change in the dust properties would change the opacity of the disk. Dust settling due to grain growth could induce a change in the scale height, which would change the height of the scattering surface relative to the disk midplane, producing the bright ring. Gaps in the HL Tau disk have been ascribed to the effects of snowlines (Zhang et al., 2015). However, given the large radius of the observed ring (80 AU), this seems unlikely.
For an inclined disk that is optically thick vertically and axisymmetric, a ring with a higher surface height would appear as an offset structure relative to the central star (Lagage et al., 2006). Combining the offset measured in the STIS image with the ring radius, we infer that the scattering in the ring occurs 4 AU above the disk midplane. The expected scale height for gas in vertical hydrostatic equilibrium at the location of the ring is about 4–5 AU (assuming K, and K), i.e. similar to the height where scattering occurs. In optically thick disks, the disk surface is typically located 2–4 times higher than the gas scale height (e.g., D’Alessio et al., 1999). This suggests that the PDS 66 disk is flatter and/or less flared than primordial disks, i.e., possibly significantly settled as was originally suggested by Cortes et al. (2009). A flattened disk could favor the ”shadowing” scenario above, but only a more complete SED+image modeling effort can confirm this.
From this dataset, no clear conclusions can be drawn on the origin of the gap + ring structure. ALMA dust continuum observations would help distringuish between the scenarios above. For scenario (a), we would expect to see a significant pile up of mm-sized grains right outside the NIR ring, due to the dust filtration effect, which would generate at least a factor of or higher in continuum flux. In scenario (b), the shadowed region would have a slightly lower temperature, which would result in less flux in the optically-thin mm continuum as well, though only on the order of %. ALMA gas observations may be able to detect gas depletion in the scenario (a), however given the shallowness of the gap this may not provide sufficient contrast between shadowed and unshadowed regions.
We detect an azimuthal departure from axisymmetry, seen as a dimmer region in the disk’s southern side at around a 40 AU radius. Schneider et al. (2014) observed that the east/west asymmetry of the disk is variable on timescales as short as three months (Schneider et al., 2014). Since this is much shorter than the dynamical timescales at the relevant orbital separations, Schneider et al. (2014) hypothesized that the changes could be due to either time-variable shadowing from material in the inner disk hidden behind the coronagraphic mask, or localized accretion hot spots on the stellar photosphere. It is possible that the azimuthal asymmetry seen in the GPI data (at 40 AU) is due to such an effect, rotated around to affect the illumination over a different range of position angles. Density enhancements in the disk caused by accreting protoplanets might cast shadows on the outer regions of the disk, though the shadowed areas predicted by simulations for planets as massive as 50 are only (Jang-Condell, 2009). Alternatively, cold spots on the stellar surface which are darker due to magnetic suppression of convection typically cover 5 - 30% of the stellar surface and could cause an azimuthal modulation of the stellar illumination incident on the outer disk on stellar rotation timescales (Venuti et al., 2015).
If the azimuthally variable disk surface brightness distribution is due to nonuniform brightness on the stellar surface, it will change on timescales of the rotation period (5 days). If instead it is due to material orbiting at the estimated inner radius (10.5 days at 0.1 AU) or embedded in the bright inner ring the shadowing will vary over a longer period. More data is needed to elucidate the timescales of the azimuthally variable disk surface brightness.
Acknowledgements: We thank the referee, Joel Kastner, for his advice that helped strengthen this paper. We acknowledge financial support of Gemini Observatory, the NSF Center for Adaptive Optics at UC Santa Cruz, the NSF (AST-0909188; AST-1211562; AST-1413718), NASA Origins (NNX11AD21G; NNX10AH31G), the University of California Office of the President (LFRP-118057), and the Dunlap Institute, University of Toronto. This work is supported by the National Science Foundation Graduate Research Fellowship under Grant No. DGE-1232825. Portions of this work were performed under the auspices of the U.S. Department of Energy by Lawrence Livermore National Laboratory under Contract DEAC52-07NA27344 and under contract with the California Institute of Technology/Jet Propulsion Laboratory funded by NASA through the Sagan Fellowship Program executed by the NASA Exoplanet Science Institute. This study is based in part on observations made with the NASA/ESA Hubble Space Telescope (program GO 12228), obtained at the Space Telescope Science Institute, which is operated by the Association of Universities for Research in Astronomy, Inc., under NASA contract NAS 5 26555. Based on observations obtained at the Gemini Observatory.
References
- Baraffe et al. (2003) Baraffe, I., Chabrier, G., Barman, T. S., Allard, F., & Hauschildt, P. H. 2003, A&A, 402, 701
- Bouwman et al. (2008) Bouwman, J., Henning, T., Hillenbrand, L. A., et al. 2008, ApJ, 683, 479
- Canovas et al. (2015) Canovas, H., Ménard, F., de Boer, J., et al. 2015, A&A, 582, L7
- Carpenter et al. (2008) Carpenter, J. M., Bouwman, J., Silverstone, M. D., et al. 2008, ApJS, 179, 423
- Carpenter et al. (2005) Carpenter, J. M., Wolf, S., Schreyer, K., Launhardt, R., & Henning, T. 2005, AJ, 129, 1049
- Cortes et al. (2009) Cortes, S. R., Meyer, M. R., Carpenter, J. M., et al. 2009, ApJ, 697, 1305
- D’Alessio et al. (1999) D’Alessio, P., Calvet, N., Hartmann, L., Lizano, S., & Cantó, J. 1999, ApJ, 527, 893
- Debes et al. (2013) Debes, J. H., Jang-Condell, H., Weinberger, A. J., Roberge, A., & Schneider, G. 2013, ApJ, 771, 45
- de Juan Ovelar et al. (2013) de Juan Ovelar, M., Min, M., Dominik, C., et al. 2013, A&A, 560, A111
- Dong et al. (2015) Dong, R., Zhu, Z., & Whitney, B. 2015, ApJ, 809, 93
- Dong (2015) Dong, R. 2015, ApJ, 810, 6
- Espaillat et al. (2010) Espaillat, C., D’Alessio, P., Hernández, J., et al. 2010, ApJ, 717, 441
- Fitzgibbon et al. (1996) Fitzgibbon, A. W., Pilu, M., and Fischer R. B., 1996, Proc. of the 13th Internation Conference on Pattern Recognition, 253
- Gräfe & Wolf (2013) Gräfe, C., & Wolf, S. 2013, A&A, 552, A88
- Graham et al. (2007) Graham, J. R., Kalas, P. G., & Matthews, B. C. 2007, ApJ, 654, 595
- Gregorio-Hetem et al. (1992) Gregorio-Hetem, J., Lepine, J. R. D., Quast, G. R., Torres, C. A. O., & de La Reza, R. 1992, AJ, 103, 549
- Haisch et al. (2001) Haisch, K. E., Jr., Lada, E. A., & Lada, C. J. 2001, ApJ, 553, L153
- Hung et al. (2015) Hung, L.-W., Duchêne, G., Arriaga, P., et al. 2015, ApJ, 815, L14
- Ingleby et al. (2013) Ingleby, L., Calvet, N., Herczeg, G., et al. 2013, ApJ, 767, 112
- Jang-Condell (2009) Jang-Condell, H. 2009, ApJ, 700, 820
- Kastner et al. (2010) Kastner, J. H., Hily-Blant, P., Sacco, G. G., Forveille, T., & Zuckerman, B. 2010, ApJ, 723, L248
- Lagage et al. (2006) Lagage, P.-O., Doucet, C., Pantin, E., et al. 2006, Science, 314, 621
- Larkin et al. (2014) Larkin, J. E., Chilcote, J. K., Aliado, T., et al. 2014, Proc. SPIE, 9147, 91471K
- Macintosh et al. (2014) Macintosh, B., Graham, J. R., Ingraham, P., et al. 2014, Proceedings of the National Academy of Science, 111, 12661
- Mamajek et al. (2002) Mamajek, E. E., Meyer, M. R., & Liebert, J. 2002, AJ, 124, 1670
- Millar-Blanchaer et al. (2015) Millar-Blanchaer, M. A., Graham, J. R., Pueyo, L., et al. 2015, arXiv:1508.04787
- Murakawa (2010) Murakawa, K. 2010, A&A, 518, A63
- Nielsen & Close (2010) Nielsen, E. L., & Close, L. M. 2010, ApJ, 717, 878
- Nielsen et al. (2008) Nielsen, E. L., Close, L. M., Biller, B. A., Masciadri, E., & Lenzen, R. 2008, ApJ, 674, 466
- Murphy, Lawson, & Bessell (2013) Murphy S. J., Lawson W. A., Bessell M. S., 2013, MNRAS, 435, 1325
- Pascucci et al. (2007) Pascucci, I., Hollenbach, D., Najita, J., et al. 2007, ApJ, 663, 383
- Pecaut et al. (2012) Pecaut, M. J., Mamajek, E. E., & Bubar, E. J. 2012, ApJ, 746, 154
- Perrin et al. (2015) Perrin, M. D., Duchene, G., Millar-Blanchaer, M., et al. 2015, ApJ, 799, 182
- Perrin et al. (2014) Perrin, M. D., Maire, J., Ingraham, P., et al. 2014, Proc. SPIE, 9147, 91473J
- Rapson et al. (2015a) Rapson, V. A., Kastner, J. H., Andrews, S. M., et al. 2015, ApJ, 803, L10
- Rapson et al. (2015) Rapson, V. A., Kastner, J. H., Millar-Blanchaer, M. A., & Dong, R. 2015, ApJ, 815, L26
- Schmid et al. (2006) Schmid, H. M., Joos, F., & Tschan, D. 2006, A&A, 452, 657
- Schneider et al. (2014) Schneider, G., Grady, C. A., Hines, D. C., et al. 2014, AJ, 148, 59
- Schütz et al. (2005) Schütz, O., Meeus, G., & Sterzik, M. F. 2005, A&A, 431, 165
- Silverstone et al. (2006) Silverstone, M. D., Meyer, M. R., Mamajek, E. E., et al. 2006, ApJ, 639, 1138
- Sivaramakrishnan & Oppenheimer (2006) Sivaramakrishnan, A., & Oppenheimer, B. R. 2006, ApJ, 647, 620
- Soummer et al. (2012) Soummer, R., Pueyo, L., & Larkin, J. 2012, ApJ, 755, L28
- Torres et al. (2008) Torres, C. A. O., Quast, G. R., Melo, C. H. F., & Sterzik, M. F. 2008, Handbook of Star Forming Regions, Volume II, 5, 757
- Venuti et al. (2015) Venuti, L., Bouvier, J., Irwin, J., et al. 2015, A&A, 581, A66
- Wang et al. (2014) Wang, J. J., Rajan, A., Graham, J. R., et al. 2014, Proc. SPIE, 9147, 914755
- Wang et al. (2015) Wang, J. J., Ruffio, J.-B., De Rosa, R. J., et al. 2015, Astrophysics Source Code Library, record ascl:1506.001
- Wolff et al. (2014) Wolff, S. G., Perrin, M. D., Maire, J., et al. 2014, Proc. SPIE, 9147, 91477H
- Zhang et al. (2015) Zhang, K., Blake, G. A., & Bergin, E. A. 2015, ApJ, 806, L7