Exploring small energy scales with x-ray absorption and dichroism
Abstract
Soft x-ray linear and circular dichroism (XLD, XMCD) experiments at the Ce M4,5 edges are being used to determine the energy scales characterizing the Ce degrees of freedom in the ultrathin ordered surface intermetallic CeAgx/Ag(111). We find that all relevant interactions, i. e. Kondo scattering, crystal field splitting and magnetic exchange coupling occur on small scales. Our study demonstrates the usefulness of combining x-ray absorption experiments probing linear and circular dichroism owing to their strong sensitivity for anisotropies in both charge distribution and paramagnetic response, respectively.
pacs:
Rare earth intermetallic compounds display a rich phenomenology of physical properties, encompassing very different kinds of ground states, such as magnetic order, unconventional superconductivity and paramagnetic heavy fermion liquids Gegenwart et al. (2008, 2015). The interaction of localized electrons with itinerant electronic degrees of freedom may result in the emergence of small characteristic energy scales which produce nontrivial macroscopic behavior at low temperature and complex phase diagrams with competing interactions and orders Grewe and Steglich (1991); von Löhneysen et al. (2007); Gegenwart et al. (2008, 2015); Yang et al. (2008). In a solid environment, the degeneracy of the rare earth ground configuration is lifted by the crystal field in general, causing both an anisotropic charge distribution and, in conjunction with spin orbit coupling, (single ion) magnetic anisotropy. Unraveling the crystal field induced level structure thus constitutes an essential part of understanding the low temperature physics and of establishing correlations between local symmetry at low temperature on the one hand and macroscopic ground state properties on the other.
In this respect, the usefulness of probing the configuration with linear polarized soft x-rays Sacchi et al. (1992) has been demonstrated for a variety of Ce compounds in recent years Hansmann et al. (2008); Willers et al. (2009, 2010, 2011, 2012a, 2012b); Strigari et al. (2012); Willers et al. (2015), allowing to settle several open issues, where other experiments left room for diverging interpretations. Its magnetic variants, x-ray magnetic linear and circular dichroism (XMLD, XMCD) constitute sensitive element and orbital specific probes of magnetic polarization and anisotropy Schütz et al. (1987); van der Laan et al. (1986); Chen et al. (1995); Stöhr (1999); van Elp and Searle (1997); van der Laan et al. (2008). XMCD was successfully utilized to reveal the presence of magnetic Kondo screening in CePt5/Pt(111) Praetorius et al. (2015).
In the present letter we demonstrate that the combined use of linear and magnetic circular dichroism allows us to determine the crystal field structure without recourse to e. g. inelastic neutron scattering, as in some previous work Hansmann et al. (2008); Willers et al. (2009, 2010). Our chosen example of an ultrathin Ce-Ag surface intermetallic furthermore highlights a threefold advantage of this approach. First, linear and circular dichroism experiments are frequently both feasible with the same installation and therefore can be performed in situ within a single experimental run. Second, the splittings turn out to be of the order of meV only, making their discrimination from quasi-elastic scattering a difficult task. Last but not least, the sample volume is so small that most alternative methods would face serious sensitivity challenges.
The formation of an ordered intermetallic phase upon depositing minute amounts of Ce onto Ag(111) held at elevated temperature has been reported before Schwab et al. (2012). In the preparation of our specimens we have adopted a similar procedure. In brief, clean Ag(111) was prepared by cycles of Ar+ ion sputtering (: 1 keV) and subsequent annealing to K. The crystal was then held at K while a Ce dose of approx. atoms/cm2 was deposited onto it from a thoroughly outgassed W crucible mounted in a commercial electron beam evaporator.
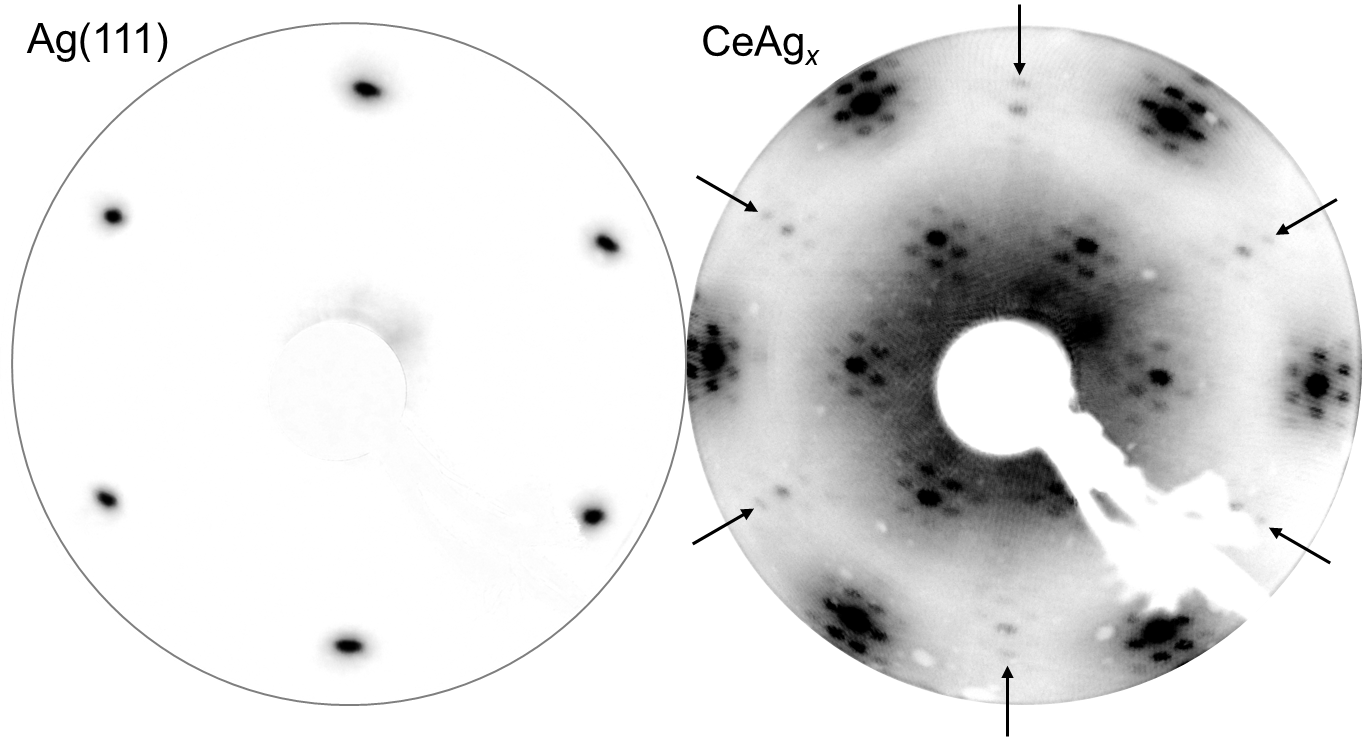
Fig. 1 displays a LEED pattern of a CeAgx specimen characteristic of this range of Ce coverage next to the one of pristine Ag(111), taken at the same electron kinetic energy. The diffraction pattern is very much reminiscent of our earlier observations for CePt5/Pt(111) at similar Ce dose Kemmer et al. (2014); Praetorius et al. (2015). It reveals a combination of two superstructures on two different length scales. The main diffraction features may be attributed to an intermetallic surface reconstruction, whereas the satellites indicate the formation of a longer range surface corrugation of character with respect to this intermetallic phase. This corresponds to a hexagonal surface corrugation in rotational alignment with the substrate lattice and a periodicity of approx. nm. As indicated by arrows in Fig. 1 the Ag(111) first order diffraction beams superimpose with the outermost satellite reflections surrounding the spots of the surface intermetallic. Like in CePt5 the satellite intensities strongly loose intensity as the initial Ce coverage is increased Schwab et al. (2012); Zinner et al. . Despite the obvious similarities between both systems, there are also some differences. We have so far been unable to determine the exact composition and structure of this ordered Ce-Ag phase which we therefore label as CeAgx. A more extensive account of the properties of CeAgx/Ag(111) and their dependence on Ce coverage shall be given in a separate publication Zinner et al. .
For the purpose of this letter it is sufficient to recognize the formation of a hexagonal structure and we shall therefore analyze our results by assuming sixfold rotational symmetry about the Ce sites. It is a fundamental property of hexagonal crystal fields (CF) to split the atomic Ce configuration () into three Kramers doublets of pure character. Unlike in cubic or tetragonal symmetry Hansmann et al. (2008); Willers et al. (2012a, b) the CF is therefore fully specified by level splittings and ordering. We denote the CF splittings as and and determine their magnitude and sign from linear and magnetic circular dichroism measurements at the soft x-ray Ce M4,5 edges in what follows.
All soft x-ray absorption experiments were carried out at the PM3 bending magnet beamline of BESSY-II, Berlin, using circular polarization () Kachel et al. (2015). X-ray absorption was measured in the total electron yield (TEY) mode and normalized by the TEY captured from a gold mesh. Although with reduced amplitude, linear dichroism can nevertheless be observed by variation of the x-ray angle of incidence . The polarization averaged, so-called isotropic spectrum is well approximated by oblique incidence data taken at in the present work. Its line shape is independent of the thermal occupation of the CF states, since it is identical for all initial states. In contrast, spectra measured at normal incidence (NI, i.e. along the hexagonal symmetry axis) do exhibit temperature dependent line shapes, determined by the fractional occupation of the CF split states. Introducing the Boltzmann weights , the NI spectrum is given by
| (1) |
where is the partition function. Evidently, in the limit the line shape observed at NI converges to the isotropic one. The two experimental spectra displayed in Fig. 2a) demonstrate that this condition is fulfilled in our CeAgx/Ag(111) specimens. The NI spectrum () measured at K is hardly distinguishable from the isotropic spectrum.
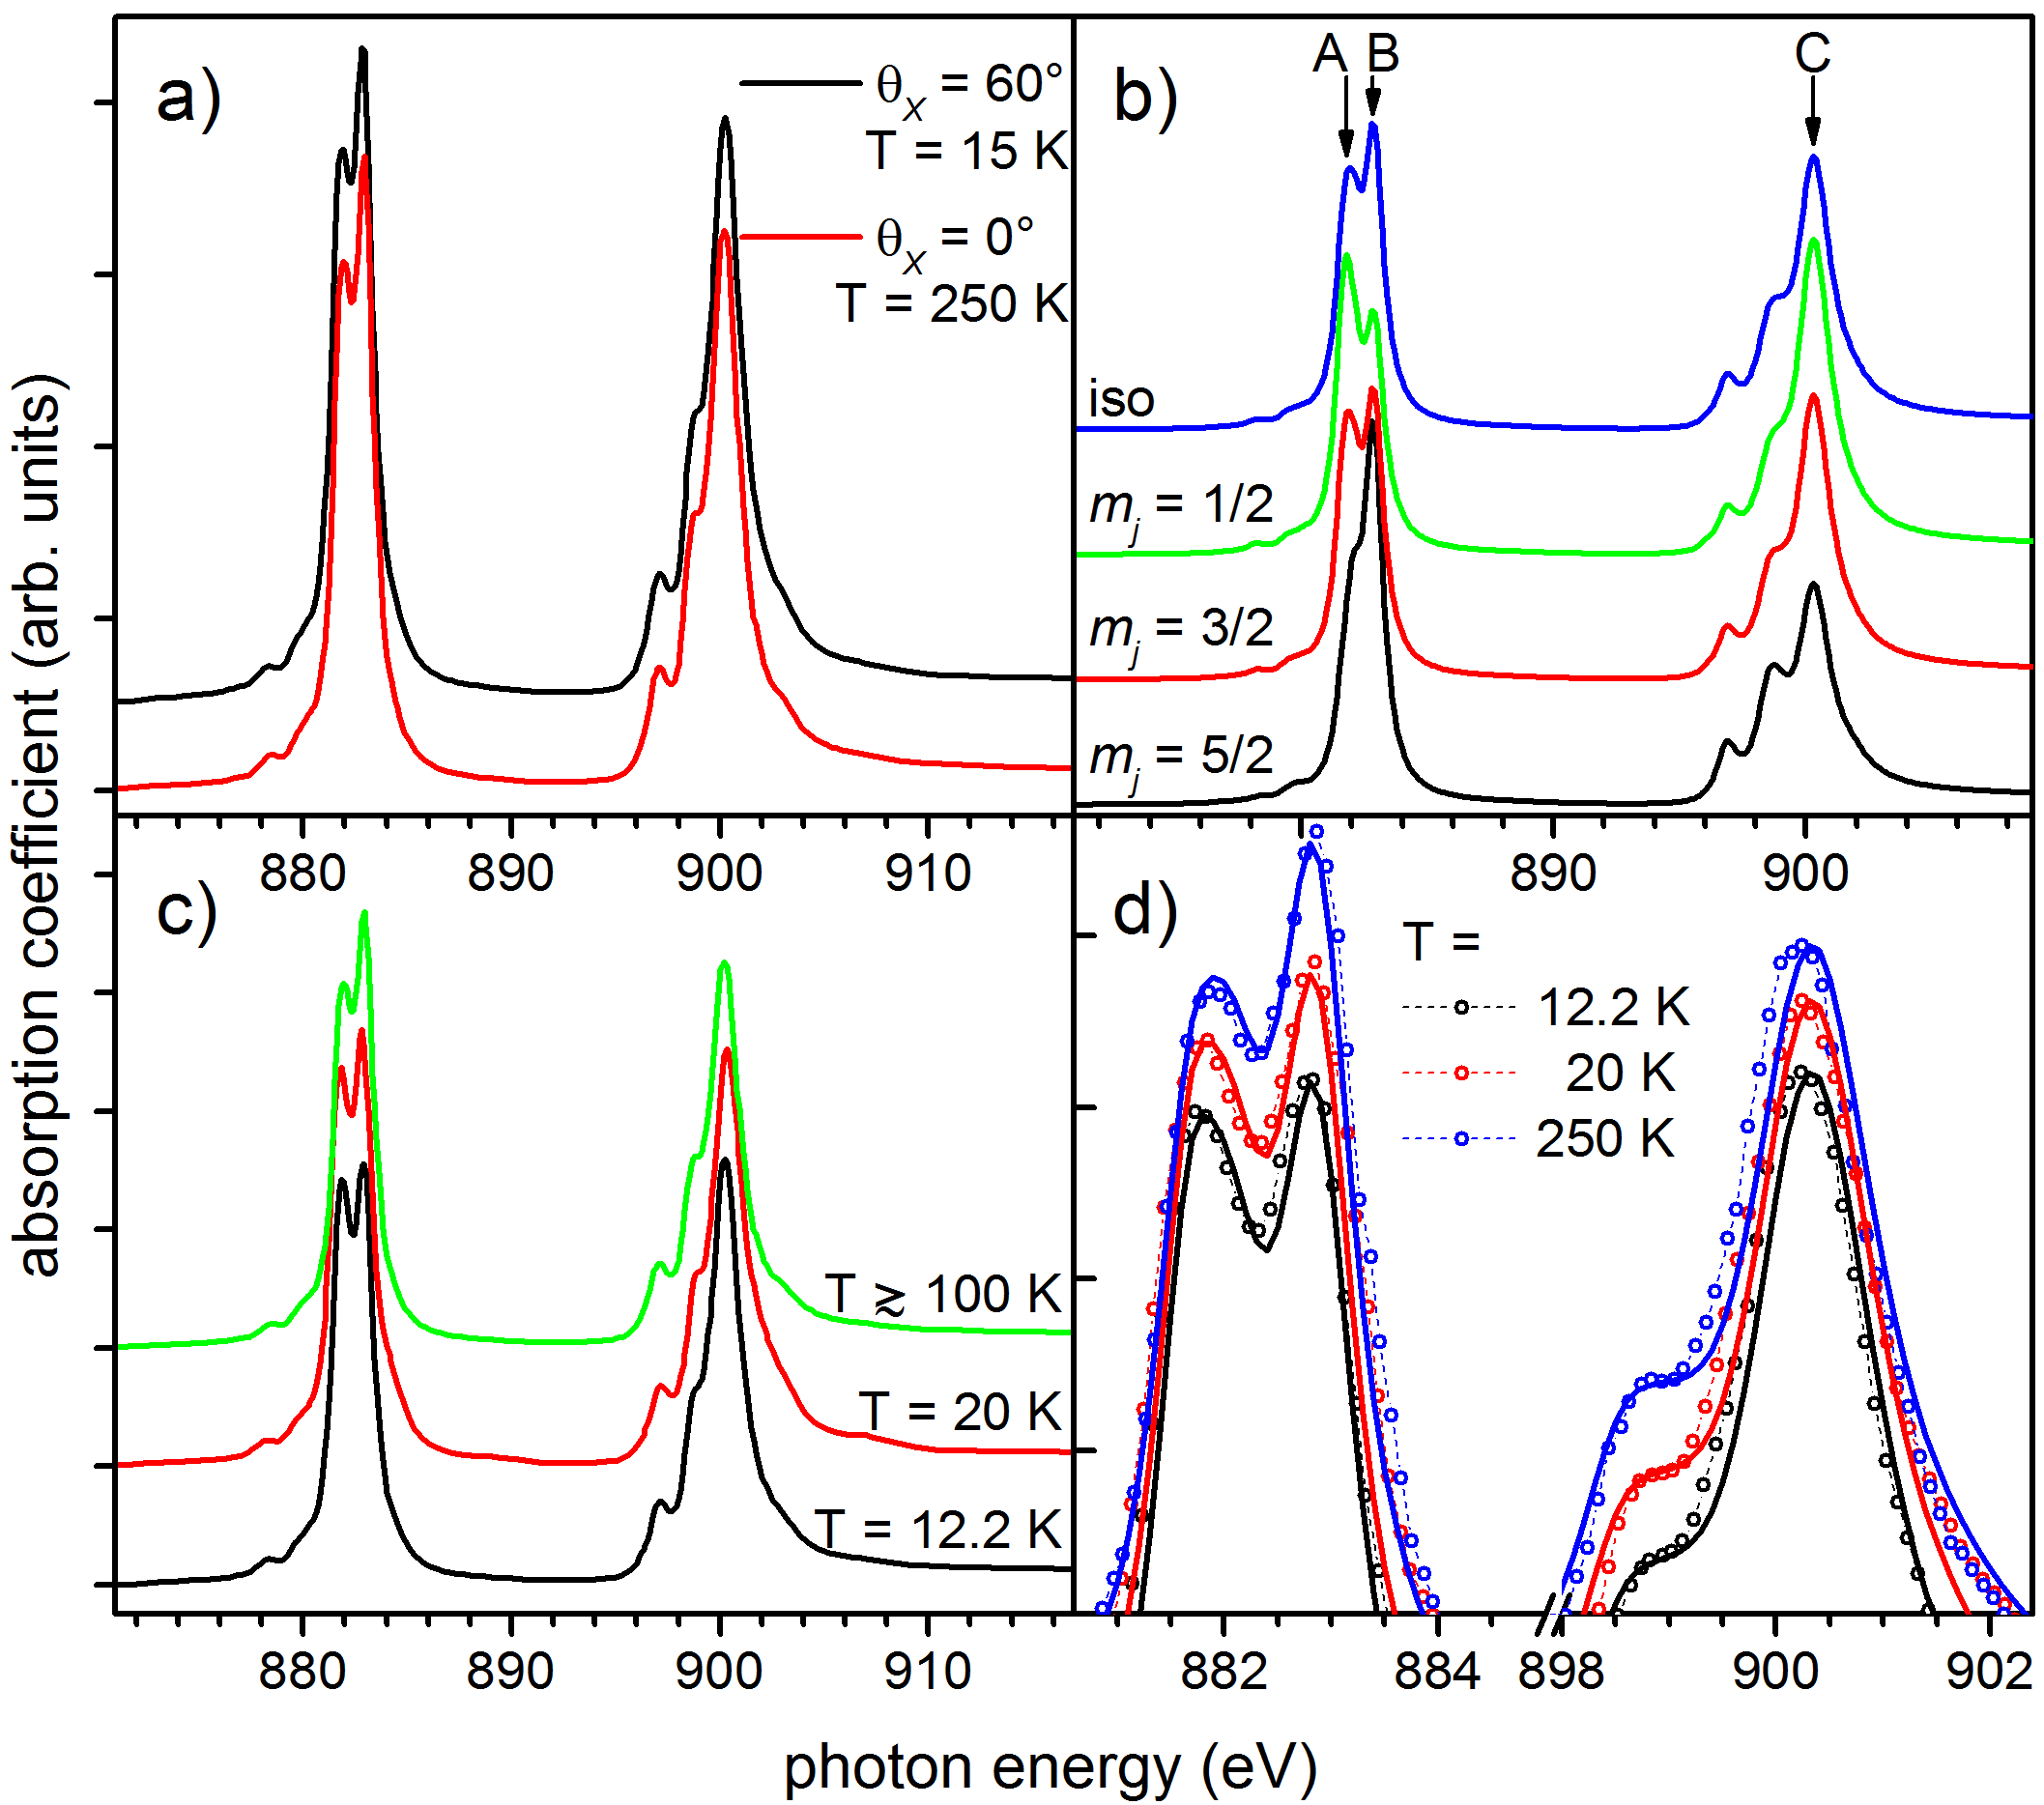
In our analysis we make use of simulated absorption spectra to trace the experimental temperature dependences. These simulations were obtained from full atomic multiplet calculations as implemented in the Quanty Package Haverkort et al. (2012); Haverkort et al. . To obtain the best match between calculated and experimental isotropic spectra, the Slater Integrals were reduced by 42.5% (17.5%) from their respective Hartree-Fock values, well in accordance with previous work Hansmann et al. (2008); Willers et al. (2010, 2012a); Strigari et al. (2013); Willers et al. (2015). In addition, the Ce core hole spin orbit coupling constant was slightly readjusted to reproduce the experimental separation between the M4 and M5 edges. Theoretical line spectra were convoluted with a Gaussian (FWHM eV) representing the experimental energy resolution as well as with Lorentzian contributions to account for the lifetime of the core excited states. Since the spectral shape of the M4 edge is affected by autoionization decay Thole et al. (1985), its lifetime broadening was calculated by convolution with a Fano profile () Schippers (2011) rather than a Lorentzian.
The resulting Ce M4,5 absorption spectra are displayed in Fig. 2b). While the overall agreement of the isotropic spectrum with measured data is very good we note that not all multiplet terms can simultaneously be made to coincide with the experimental features when applying universal scaling factors to the Slater Integrals. This is most apparent for the weak shoulder at eV, which is not discernible in the calculated spectra since its separation from the main M4 peak (feature C) is too small.
The remaining spectra in Fig. 2b) demonstrate the different spectral shapes owing to the anisotropic charge distribution in the states. In particular, their most prominent peaks (A, B & C) feature considerable variations in their relative intensities.
Experimental NI data acquired at K display variations which cannot be resolved on the scale of Fig. 2c). In comparison to the isotropic spectra, they nevertheless systematically exhibit a slightly larger (-) C/B peak intensity ratio. Referring to the specific spectra of Fig. 2b) this observation immediately reveals that must be an excited state. As the temperature is lowered, the C/B peak intensity ratio is further enhanced, but in addition the M5 line shape now acquires a noticeable change in spectral appearance. The observed spectral variations restrict the parameter to a relatively narrow energy window of meV. The determination of the other CF parameter () on the basis of NI XAS data alone is less obvious. Scenarios with meV meV can be made to satisfactorily match the sequence of experimental spectra. This is largely owed to the smallness of the linear dichroism associated with the fraction of the initial state. The choice of parameters and for the simulations in Fig. 2d) therefore already accounts for the information gained from considering the XMCD signal which we shall discuss next.
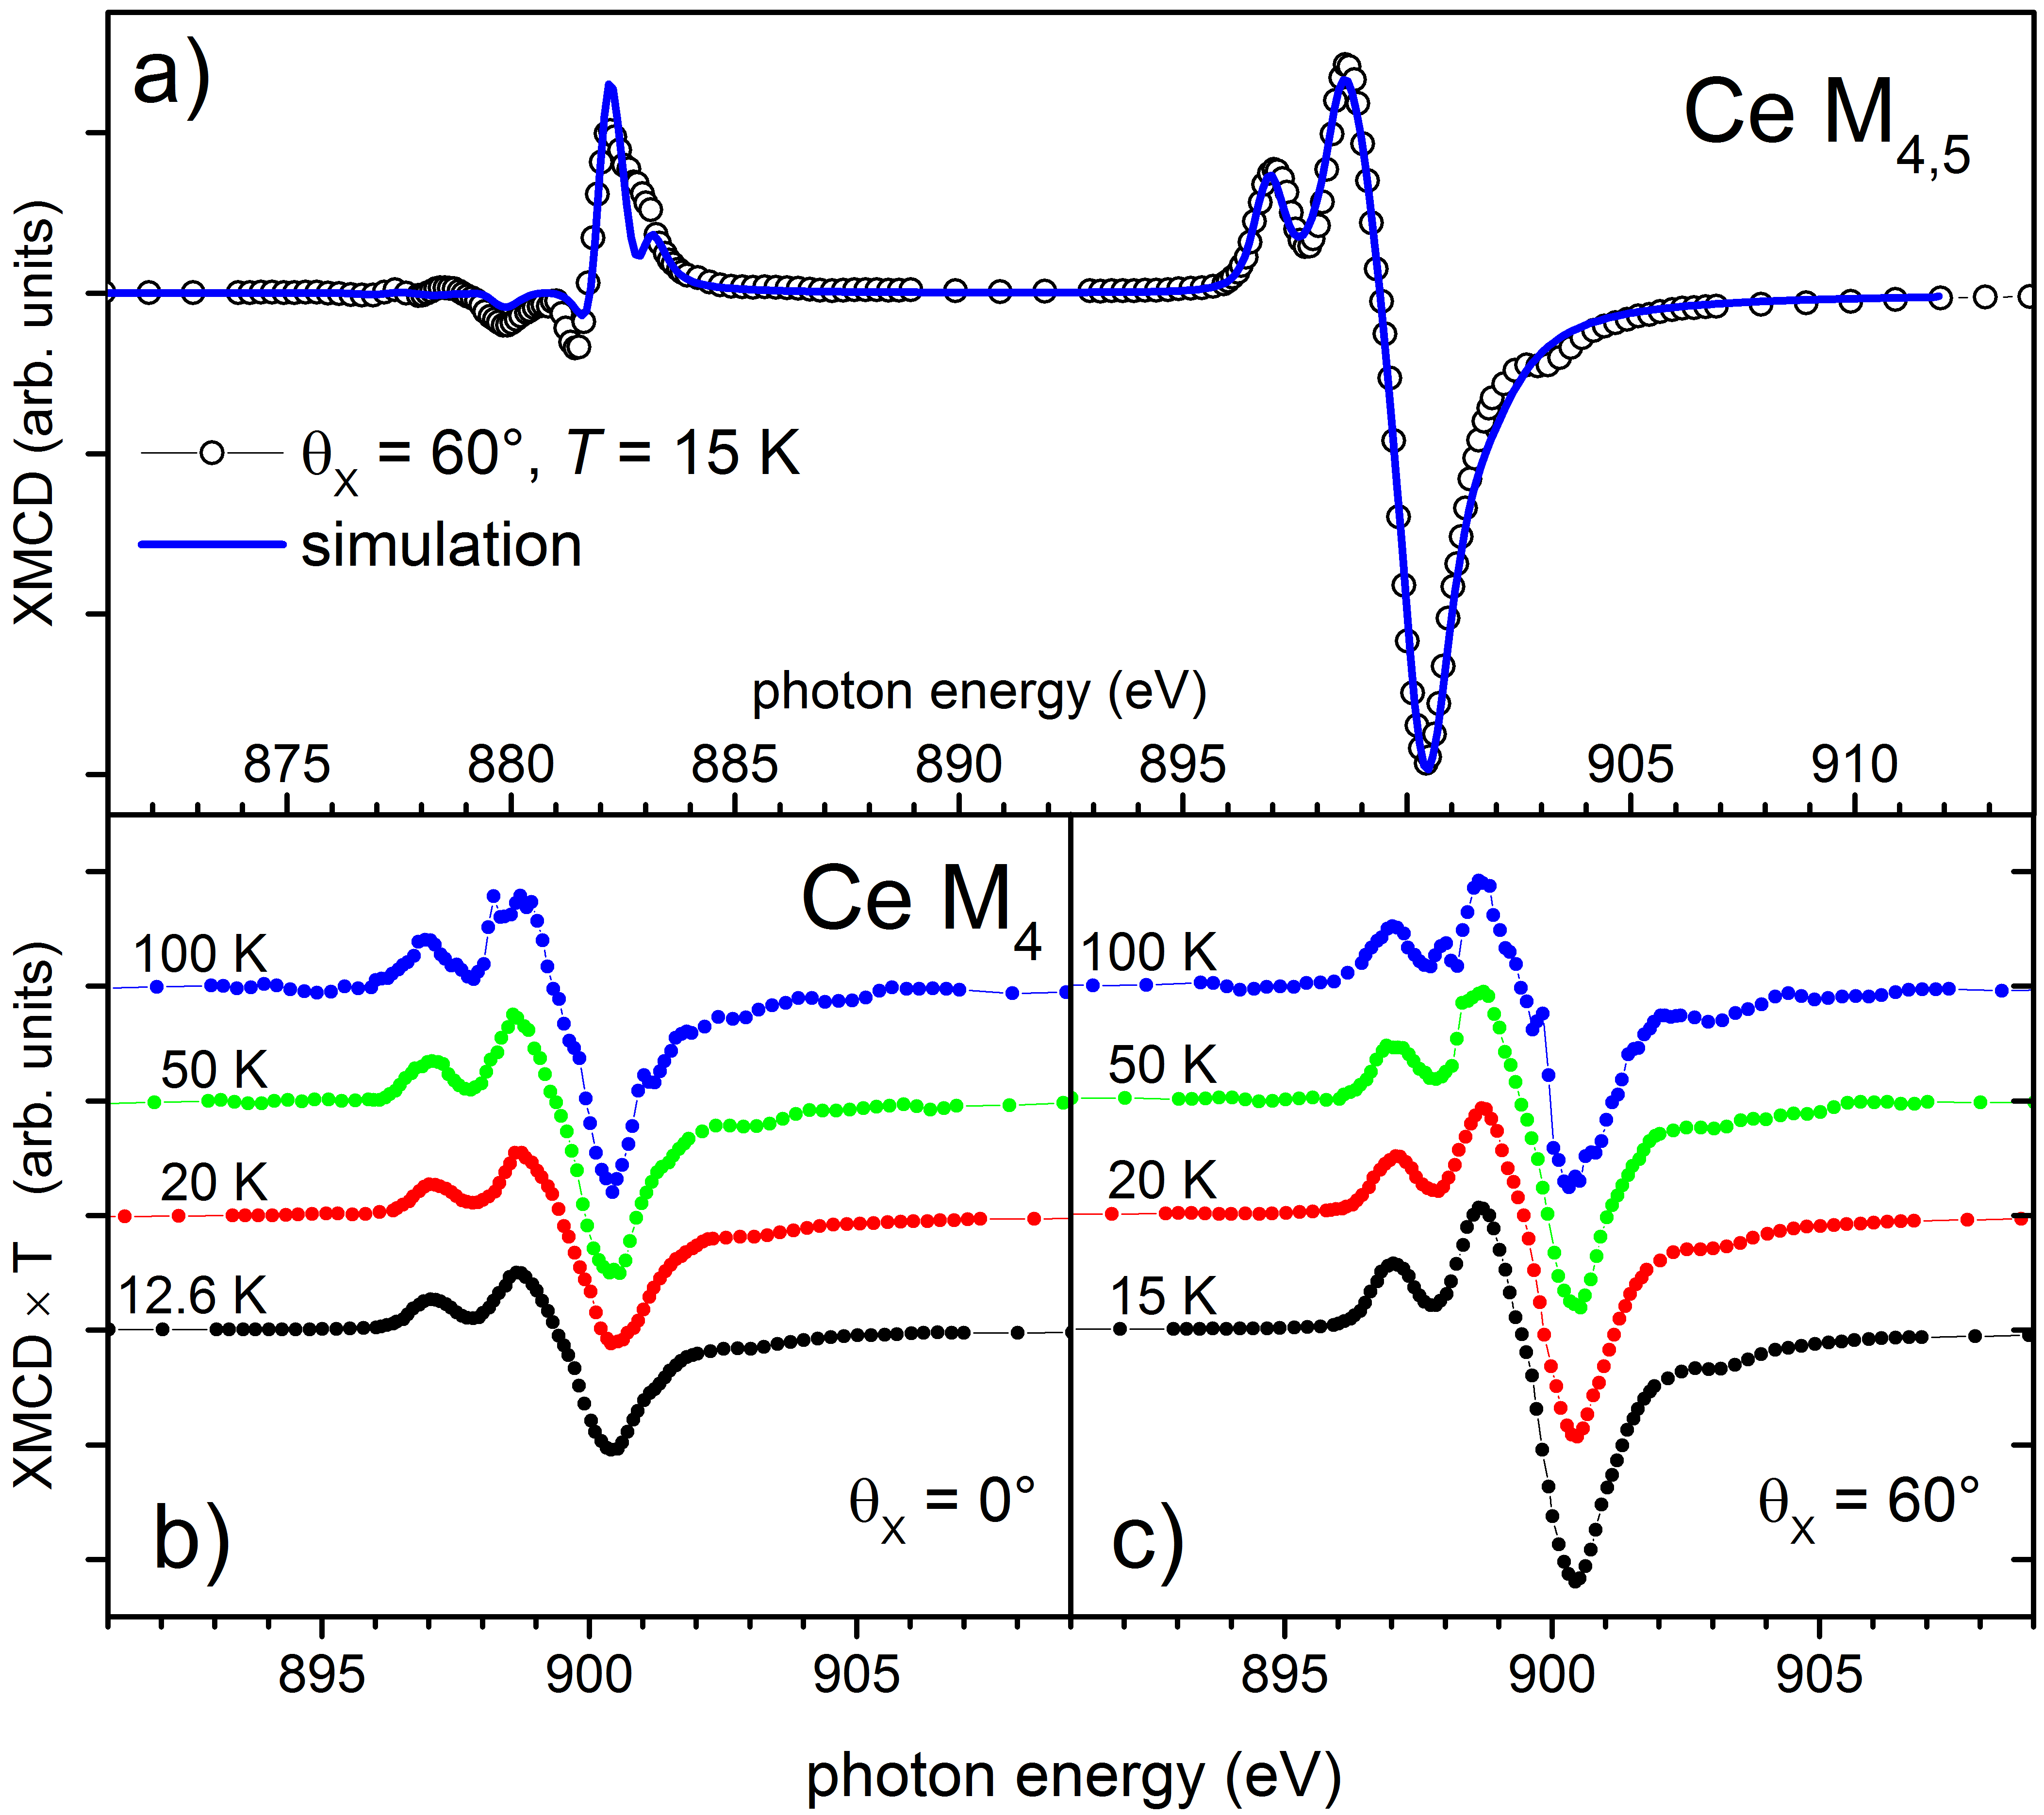
The paramagnetic Ce response was probed in an applied magnetic field of T. While sufficiently small to warrant linear response, it causes an XMCD signal which can reliably be measured over a considerable temperature range. Fig. 3a) displays the dichroic spectrum for the case of largest magnetic polarization obtained in the present work, alongside with the simulated XMCD spectrum. We notice that the spectral appearance of the XMCD is well accounted for by the atomic calculations, which were solely optimized to match the isotropic spectrum. A notable exception is once again the spectral feature at eV, which produces a small but distinct contribution to magnetic dichroism in the experiment, but is buried in the dichroism produced by the main M4 peak in the calculation. As in our previous work Praetorius et al. (2015), we determine the Ce polarization by applying the orbital moment XMCD sum rule Thole et al. (1992) and assuming the atomic relation between spin and orbital contributions to the total magnetic moment to hold. In the case of Fig. 3a), the Ce polarization amounts to approx. /atom. The corresponding asymmetry in the XA spectra is largest at the M4 edge and amounts to about % of the TEY signal.
The temperature dependence of the magnetic response at normal and oblique incidence, respectively, is shown in Fig. 3b) and c). Each dichroic spectrum is multiplied by the value of the temperature at which it was obtained. In this way, perfect Curie behavior would be reflected by a constant XMCD magnitude in the plots. At low temperature in particular, the occurrence of single ion magnetic anisotropy is obvious. Its sign and magnitude are directly related to the crystal field splitting scheme. XMCD data therefore provide an independent probe of the CF scheme within the same set of experiments.
A more quantitative evaluation can be performed after extracting the temperature dependent Ce susceptibilities from the XMCD data Praetorius et al. (2015). To second order they are given Mader and Swift (1968); Lueken et al. (1979) by the following expressions for the magnetic field applied along () and perpendicular () to the hexagonal axis, respectively:
| (2) | |||||
| (3) | |||||
At an intermediate angle the susceptibility reads
| (4) |
where we have additionally allowed for magnetic coupling between Ce sites at the mean field level ().
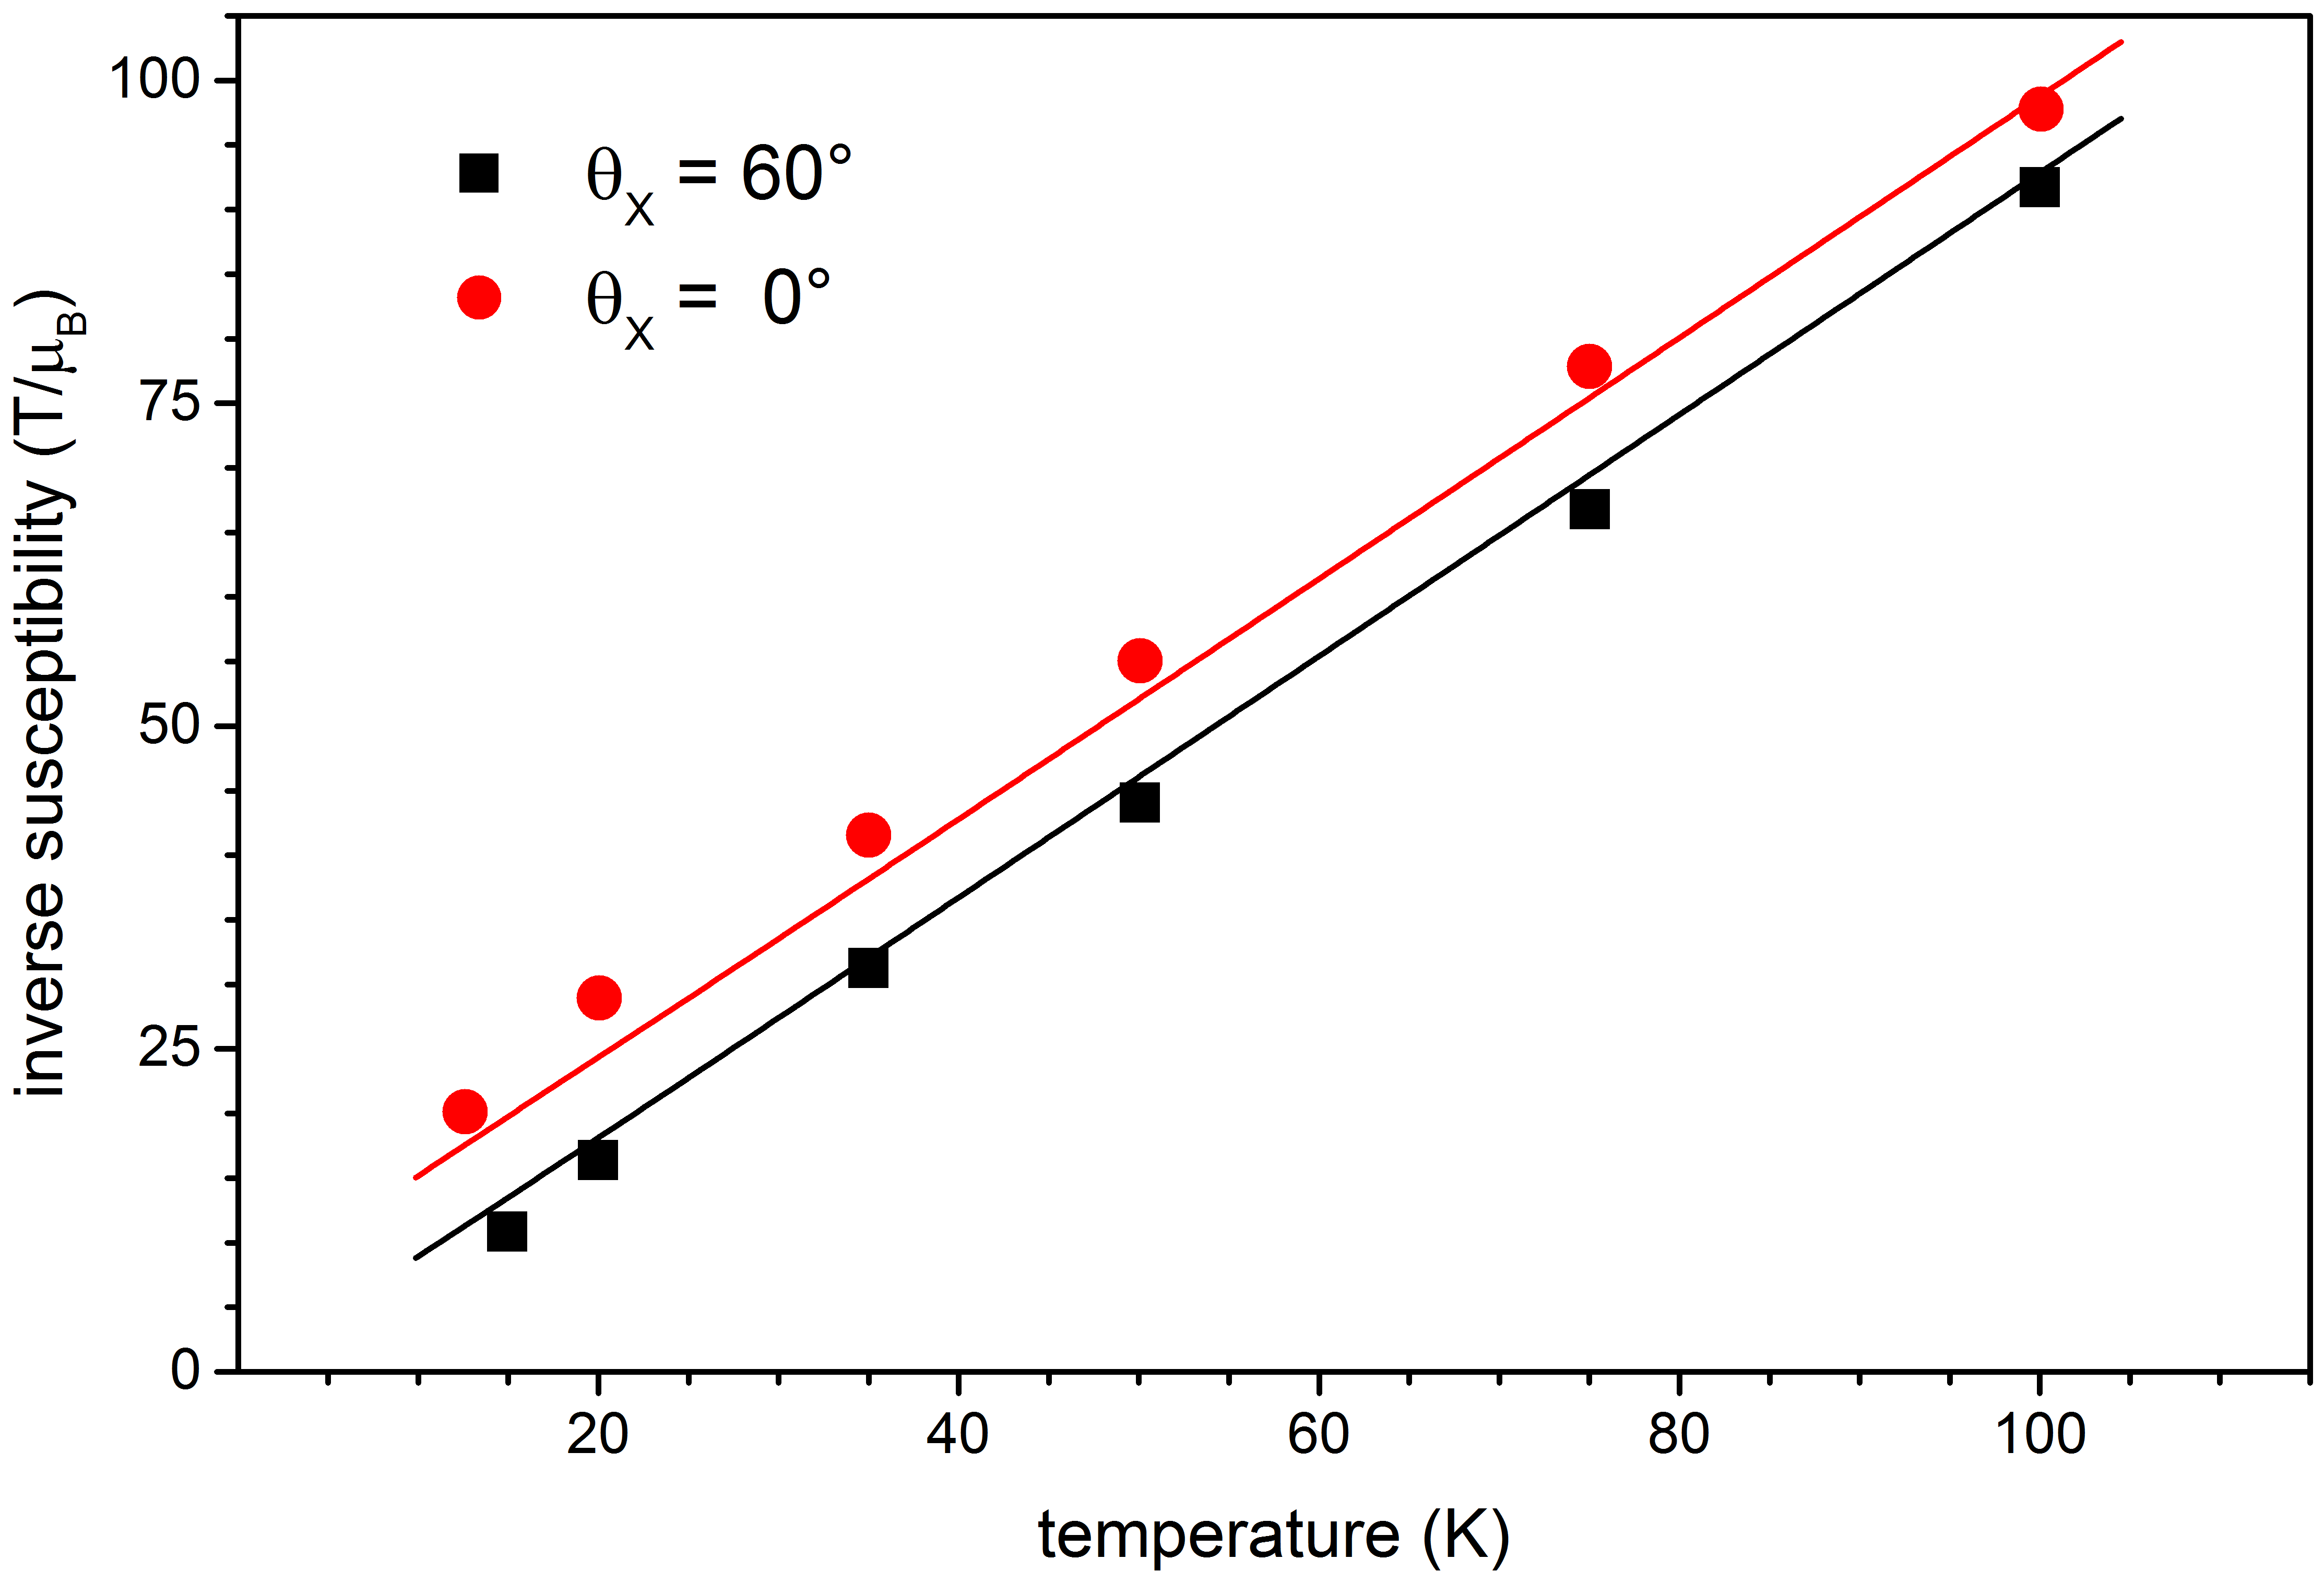
In Fig. 4 we show the temperature dependence of the inverse Ce susceptibilities. The crystal field splitting induced anisotropy leads to an offset between and which is nearly constant in the temperature range spanned by our experiments. It is notably well perceptible up to high temperatures, where the precise determination of linear dichroism in our experiment is quite challenging. The magnitude of this offset sensitively depends on the CF excitation energies and . Nevertheless, the magnetic response in this temperature range is not sufficient to pinpoint the numerical values of , and . In conjunction with the restrictions on from above, however, we can determine the combination of parameters which produces the best simultaneous agreement with both linear and circular dichroism.
The outcome of the parameter optimization is displayed in both Fig. 2d) and Fig. 4 for the thermal evolution of the NI XAS and the inverse susceptibilities, respectively. We obtain meV, meV and an insignificantly small mean field coupling . These are the parameter values used for the simulations displayed in Figs. 2d) and 4.
The correct slopes in in Fig. 4 are only obtained by allowing for an overall reduction of the Ce magnetic moment by about 13% compared to the value expected for free Ce3+ ions, however. From numerical simulations within the simplified NCA scheme proposed by Zwicknagl et al. Zwicknagl et al. (1990) we estimate that a Kondo temperature of K would be required to produce this reduction by Kondo screening. Such a high value for appears quite unlikely, though, considering the small hybridization found in the XA spectra and the photoemission results by Schwab et al. Schwab et al. (2012). It is most likely, therefore, that the discrepancy is mostly due to an underestimation of the Ce orbital moment in the sum rule evaluation.
In conclusion, we have presented a soft x-ray absorption study of an ultrathin, ordered intermetallic phase induced by alloying a sub-monolayer quantity of Ce into the surface of Ag(111). Exploring the temperature dependences of both, linear and circular x-ray dichroism, we show that it is possible to explore the energy scales which characterize this material. In addition to the smallness of Schwab et al. (2012), we find that both CF splittings and magnetic exchange coupling occur on energy scales of about 1 meV and below. Our findings highlight both the enormous sensitivity of soft x-ray absorption and the usefulness of scheduling XMCD experiments when characterizing rare earth systems with soft x-rays. This extension comes at little cost, since many soft x-ray end stations provide the means to perform both linear and circular dichroism measurements.
Acknowledgements.
We wish to thank H. Schwab and F. Reinert for helpful discussions as well as H. Kießling and B. Münzing for assistance with experiments. This work was funded by the Deutsche Forschungsgemeinschaft through FOR1162. Access to synchrotron radiation was partially granted by HZB. We also gratefully acknowledge HZB staff for their support during beam time.References
- Gegenwart et al. (2008) P. Gegenwart, Q. Si, and F. Steglich, Nat. Phys. 4, 186 (2008).
- Gegenwart et al. (2015) P. Gegenwart, F. Steglich, C. Geibel, and M. Brando, Eur. Phys. J. Special Topics 224, 975 (2015).
- Grewe and Steglich (1991) N. Grewe and F. Steglich, in Handbook on the Physics and Chemistry of Rare Earths, Vol. 14, edited by K. A. Gschneider, Jr. and L. Eyring (Elsevier, Amsterdam, 1991) p. 343.
- von Löhneysen et al. (2007) H. von Löhneysen, A. Rosch, M. Vojta, and P. Wölfle, Rev. Mod. Phys. 79, 1015 (2007).
- Yang et al. (2008) Y. Yang, Z. Fisk, H.-O. Lee, J. D. Thompson, and D. Pines, Nature 454, 611 (2008).
- Sacchi et al. (1992) M. Sacchi, F. Sirotti, and G. Rossi, Solid State Commun. 81, 977 (1992).
- Hansmann et al. (2008) P. Hansmann, A. Severing, Z. Hu, M. W. Haverkort, C. F. Chang, S. Klein, A. Tanaka, H. H. Hsieh, H. J. Lin, C. T. Chen, B. Fak, P. Lejay, and L. H. Tjeng, Phys. Rev. Lett. 100, 066405 (2008).
- Willers et al. (2009) T. Willers, B. Fak, N. Hollmann, P. O. Körner, Z. Hu, A. Tanaka, D. Schmitz, M. Enderle, G. Lapertot, L. H. Tjeng, and A. Severing, Phys. Rev. B 80, 115106 (2009).
- Willers et al. (2010) T. Willers, Z. Hu, N. Hollmann, P. O. Körner, J. Gegner, T. Burnus, H. Fujiwara, A. Tanaka, D. Schmitz, H. H. Hsieh, H.-J. Lin, C. T. Chen, E. D. Bauer, J. L. Sarrao, E. Goremychkin, M. Koza, L. H. Tjeng, and A. Severing, Phys. Rev. B 81, 195114 (2010).
- Willers et al. (2011) T. Willers, J. C. Cezar, N. B. Brookes, Z. Hu, F. Strigari, P. Körner, N. Hollmann, D. Schmitz, A. Bianchi, Z. Fisk, A. Tanaka, L. H. Tjeng, and A. Severing, Phys. Rev. Lett. 107, 236402 (2011).
- Willers et al. (2012a) T. Willers, D. T. Adroja, B. D. Rainford, Z. Hu, N. Hollmann, P. O. Körner, Y.-Y. Chin, D. Schmitz, H. H. Hsieh, H.-J. Lin, C. T. Chen, E. D. Bauer, J. L. Sarrao, K. J. McClellan, D. Byler, C. Geibel, F. Steglich, H. Aoki, P. Lejay, A. Tanaka, L. H. Tjeng, and A. Severing, Phys. Rev. B 85, 035117 (2012a).
- Willers et al. (2012b) T. Willers, F. Strigari, N. Hiraoka, Y. Q. Cai, M. W. Haverkort, K.-D. Tsuei, Y. F. Liao, S. Seiro, C. Geibel, F. Steglich, L. H. Tjeng, and A. Severing, Phys. Rev. Lett. 109, 046401 (2012b).
- Strigari et al. (2012) F. Strigari, T. Willers, Y. Muro, K. Yutani, T. Takabatake, Z. Hu, Y.-Y. Chin, S. Agrestini, H.-J. Lin, C. T. Chen, A. Tanaka, M. W. Haverkort, L. H. Tjeng, and A. Severing, Phys. Rev. B 86, 081105 (2012).
- Willers et al. (2015) T. Willers, F. Strigari, Z. Hu, V. Sessi, N. B. Brookes, E. D. Bauer, J. L. Sarrao, J. D. Thompson, A. Tanaka, S. Wirth, L. H. Tjeng, and A. Severing, Proceedings of the National Academy of Sciences 112, 2384 (2015), http://www.pnas.org/content/112/8/2384.full.pdf .
- Schütz et al. (1987) G. Schütz, W. Wagner, W. Wilhelm, P. Kienle, R. Zeller, R. Frahm, and G. Materlik, Phys. Rev. Lett. 58, 737 (1987).
- van der Laan et al. (1986) G. van der Laan, B. T. Thole, G. A. Sawatzky, J. B. Goedkoop, J. C. Fuggle, J.-M. Esteva, R. Karnatak, J. P. Remeika, and H. A. Dabkowska, Phys. Rev. B 34, 6529 (1986).
- Chen et al. (1995) C. T. Chen, Y. U. Idzerda, H.-J. Lin, N. V. Smith, G. Meigs, E. Chaban, G. H. Ho, E. Pellegrin, and F. Sette, Phys. Rev. Lett. 75, 152 (1995).
- Stöhr (1999) J. Stöhr, Journal of Magnetism and Magnetic Materials 200, 470 (1999).
- van Elp and Searle (1997) J. van Elp and B. Searle, J. Electron Spectrosc. Relat. Phenom. 86, 93 (1997).
- van der Laan et al. (2008) G. van der Laan, E. Arenholz, A. Schmehl, and D. G. Schlom, Phys. Rev. Lett. 100, 067403 (2008).
- Praetorius et al. (2015) C. Praetorius, M. Zinner, A. Köhl, H. Kießling, S. Brück, B. Muenzing, M. Kamp, T. Kachel, F. Choueikani, P. Ohresser, F. Wilhelm, A. Rogalev, and K. Fauth, Phys. Rev. B 92, 045116 (2015).
- Schwab et al. (2012) H. Schwab, M. Mulazzi, J. Jiang, H. Hayashi, T. Habuchi, D. Hirayama, H. Iwasawa, K. Shimada, and F. Reinert, Phys. Rev. B 85, 125130 (2012).
- Kemmer et al. (2014) J. Kemmer, C. Praetorius, A. Krönlein, P.-J. Hsu, K. Fauth, and M. Bode, Phys. Rev. B 90, 195401 (2014).
- (24) M. Zinner et al., Unpublished results.
- Kachel et al. (2015) T. Kachel, F. Eggenstein, and R. Follath, Journal of Synchrotron Radiation 22, 1301 (2015).
- Haverkort et al. (2012) M. W. Haverkort, M. Zwierzycki, and O. K. Andersen, Phys. Rev. B 85, 165113 (2012).
- (27) M. W. Haverkort et al., http://www.quanty.org.
- Strigari et al. (2013) F. Strigari, T. Willers, Y. Muro, K. Yutani, T. Takabatake, Z. Hu, S. Agrestini, C.-Y. Kuo, Y.-Y. Chin, H.-J. Lin, T. W. Pi, C. T. Chen, E. Weschke, E. Schierle, A. Tanaka, M. W. Haverkort, L. H. Tjeng, and A. Severing, Phys. Rev. B 87, 125119 (2013).
- Thole et al. (1985) B. T. Thole, G. van der Laan, J. C. Fuggle, G. A. Sawatzky, R. C. Karnatak, and J. M. Esteva, Phys. Rev. B 32, 5107 (1985).
- Schippers (2011) S. Schippers, Int. Rev. At. Mol. Phys. 2, 151 (2011).
- Thole et al. (1992) B. T. Thole, P. Carra, F. Sette, and G. van der Laan, Phys. Rev. Lett. 68, 1943 (1992).
- Mader and Swift (1968) K. H. Mader and M. W. Swift, J. Phys. Chem. Solids 29, 1759 (1968).
- Lueken et al. (1979) H. Lueken, M. Meier, G. Klessen, W. Bronger, and J. Fleischhauer, J. Less-Comm. Met. 63, P35 (1979).
- Zwicknagl et al. (1990) G. Zwicknagl, V. Zevin, and P. Fulde, Z. Phys. B 79, 365 (1990).