]http://www.uni-leipzig.de/ physik/mona
Thermo-osmotic flow in thin films
Abstract
We report on the first micro-scale observation of the velocity field imposed by a non-uniform heat content along the solid/liquid boundary. We determine both radial and vertical velocity components of this thermo-osmotic flow field by tracking single tracer nanoparticles. The measured flow profiles are compared to an approximate analytical theory and to numerical calculations. From the measured slip velocity we deduce the thermo-osmotic coefficient for both bare glass and Pluronic F-127 covered surfaces. The value for Pluronic F-127 agrees well with Soret data for polyethylene glycol, whereas that for glass differs from literature values and indicates the complex boundary layer thermodynamics of glass-water interfaces.
Osmosis is the passage of a liquid through a semipermeable membrane, towards a higher concentration of a molecular solute or salt. Osmotic processes are fundamental for life, for example in selective transport through cell membranes, and for applications such as desalination of seawater and power generation from the salinity difference with river water Log12 . In physical terms, osmosis is driven by the gain in mixing entropy and requires to impede solute diffusion.
Thermo-osmosis relies on the same principle, albeit with a liquid of non-uniform heat content instead of a non-uniform solute concentration; accordingly, the underlying thermodynamic force is the temperature gradient rather than a concentration gradient. Since there are no heat-selective membranes, thermo-osmosis occurs in open geometries only, where heat and liquid flow in opposite directions along a solid boundary, similarly to electro-osmosis in capillaries or nanofluidic diodes Pic13 . Water flow due to a temperature gradient was first observed by Derjaguin and Sidorenkov through porous glass from a hot to a cold reservoir Der41 .
In the last decade thermal gradients have become a versatile means of manipulating colloidal dispersions, e.g., self-propulsion of metal-capped Janus particles Jia10 ; But12 , cluster formation through hydrodynamic interactions Wei08 ; Leo09 , force-free steering through dynamical feedback Bre14 ; Qia13 , sieving by size and stretching macromolecules Duh06 ; Mae11 ; Ped14 , dynamical trapping of nano-particles Bra13 ; Bra15 , and detection of DNA through functionalized gold particles Yu15 . In all these examples, the motion arises from a superposition of thermo-osmosis and molecular osmosis Wue10 : The temperature gradient induces heat flow along the colloidal surface, whereas its companion fields, e.g. composition But12 ; Wue15 and ion concentration Esl14 ; Bro14 ; Vig10 ; Rei14 , drive molecular currents. Finally we note that thermo-osmotic flow could be relevant for particle motion through hot nanostructures, in addition to thermophoresis and thermoconvectionChen15 ; Cuche13 .
Here we report on the first micro-scale observation of the velocity field imposed by thermo-osmosis along the solid boundary. Both radial and vertical velocity components are determined by tracking single tracer nanoparticles. The measured flow profiles are compared to an approximate analytical theory and to numerical calculations.
Thermo-osmotic slip velocity.
A bulk liquid in a temperature gradient reaches a non-equilibrium stationary state, with a steady non-uniform composition but zero matter flow. A solid boundary, however, exerts additional forces on the liquid; the corresponding excess (or defect) specific enthalpy in the boundary layer results in a creep flow parallel to the surface, with the effective slip velocity Der87
| (1) |
where is the viscosity. An enthalpy excess in the boundary layer, , leads to a negative and liquid flow towards the cold side, as observed for glass capillaries, clays, and silica gels Der41 ; Der87 , whereas a negative enthalpy drives the liquid towards the hot, e.g., through various synthetic membranes Kim09 ; Vil06 .
In terms of Onsager’s reciprocal relations, is the mechano-caloric cross-coefficient, which describes equally well the excess heat carried by liquid flow at constant temperature Der87 . Its explicit form can also be derived from the principles of non-equilibrium thermodynamics Gro62 : A solid boundary modifies the specific chemical potential within an interaction length . Plugging the thermodynamic force in Stokes’ equation and using the Gibbs-Helmholtz relation , one readily obtains eq. 1. Since the specific chemical potential is usually constant perpendicular to the surface, the excess enthalpy in the boundary layer is identical to the entropic term, . This relates the slip velocity to the “entropy of transport” .
Experimental
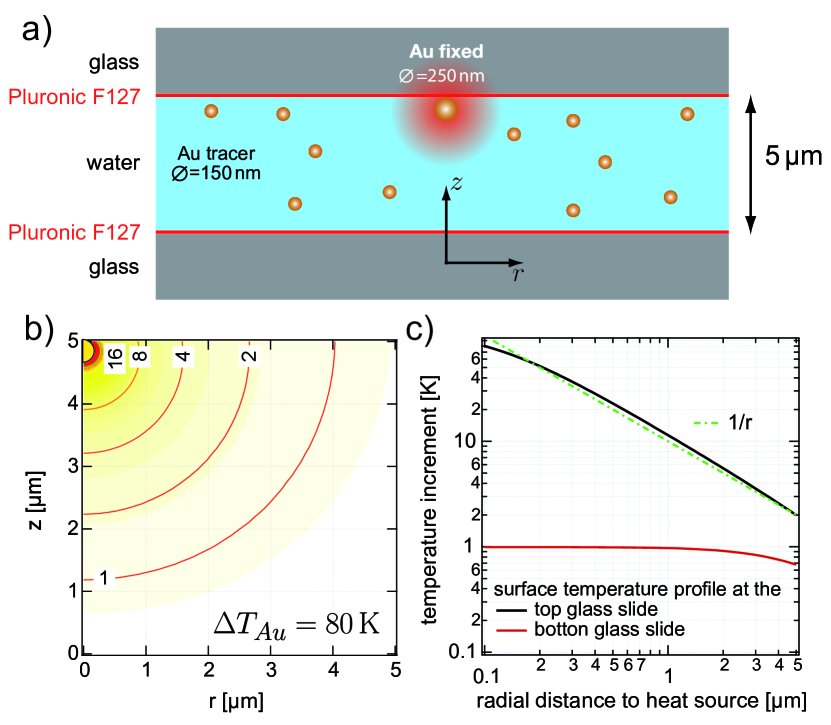
To measure the thermo-osmotic flow field we have constructed a sample cell that consists of two glass cover slides (Roth) enclosing a water film of about thickness (Fig. 2a). Both slides were either used untreated or covered with Pluronic F-127 (see supplementary material for detailsSI ). A gold particle of radius is used as a heat source to generate a well defined temperature gradient along the glass/water (polymer/water) interface (eq. 2). The gold particle was immobilized at the upper glass surface to avoid convection.
| (2) |
The gold particle is heated with a laser at a power of . The temperature increment of the gold particle was estimated with the help of a separate experiment SI . Fig. 2 c) displays the expected temperature profiles at the liquid/solid interface corresponding to this nanoparticle temperature at the upper slide (black curve) and at the lower slide (red curve). The velocity field is measured by tracking single gold nano-particles of a radius . Because of its high thermal conductivity, the particle is almost isothermal and thus does not migrate in the temperature gradient. As the sample cell is thicker than the focal depth () of the microscopy setup, the scattering intensity of the tracers varies with the position. Selecting only the brightest particles for the analysis for example allows access to the velocity field close to the solid boundary.
Velocity field at the boundary
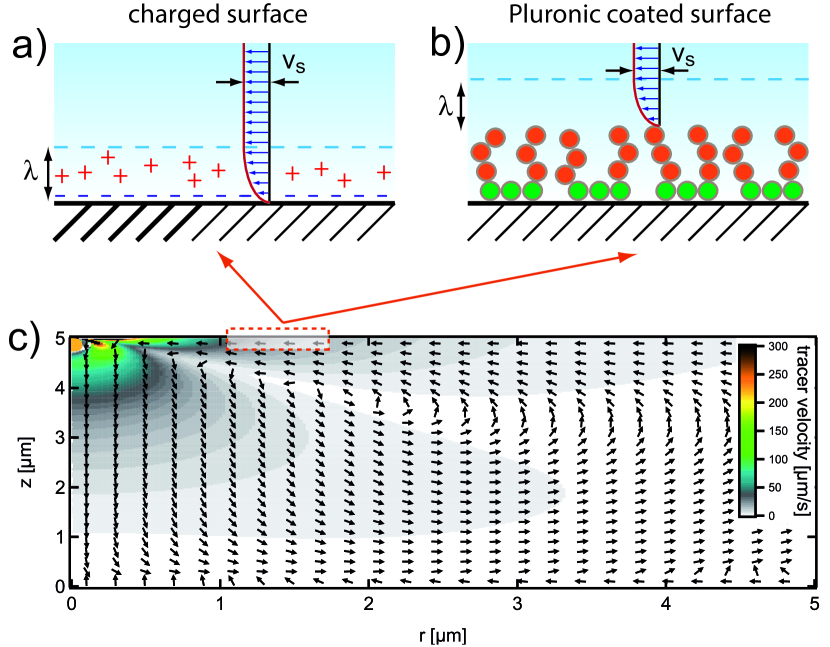
Fig. 1a,b) give a schematic view of the velocity profile which saturates at distances beyond in the effective slip velocity (eq. 1). As the temperature gradient in our setup is not constant along the solid boundary one expects that the slip velocity along the upper plate decreases with the inverse square of the radius,
| (3) |
For the surface flow is oriented towards the origin. A corresponding but considerably weaker surface flow () is also present at the other glass cover slide. These surface flows induce a radially symmetric volume flow , which is traced by the gold nano particles.
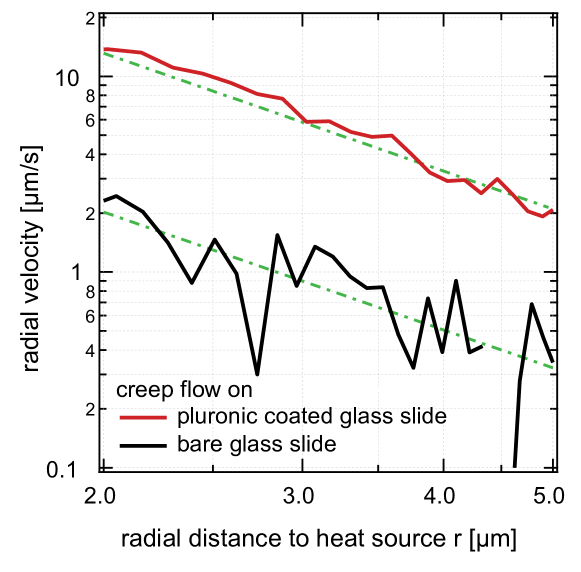
In Fig. 3 we plot the experimentally obtained velocity of the tracers close to the upper boundary of the liquid film as a function of the radial distance from the heated gold nanoparticle. The velocity profile has been measured for a bare glass plate (black curve) and one coated with Pluronic F-127 (red curve). At distances larger than 2 microns from the heat source, both agree well with the power law (indicated by the green dashed lines). For both systems, the flow is towards higher temperatures. The measured velocities differ by a factor of 7.5 where the larger one is found for the Pluronic F-127 coated surface. This suggests that the mobility parameter is considerably stronger for the non-ionic block-copolymer as compared to the charged bare glass surface. A value for the thermo-osmotic surface velocity can be extracted when considering that the tracers velocity represents an average over twice the diffusion length () during the exposure time (see SISI for details of the averaging). According to this we find a maximum velocity of and
Thermo-osmotic coefficient .
The surface velocities and the temperature increments yield the thermo-osmotic coefficients. Table 1 compares the coefficient obtained for the Pluronic coated and bare glass slides, with previously reported thermo-osmotic data and the reduced thermophoretic mobility of colloidal suspensions. For large particles the coefficients are related through And89 , whereas for small particles and polymers one rather has .
Pluronic F-127 is a non-ionic triblock copolymer consisting of a central hydrophobic block of polypropylene glycol (PPG, 56 repeat units, bright yellow in Fig. 1 b) and two hydrophilic blocks of poly-ethylene glycol (PEG, 101 units, dark red). Both molecules show complex thermodynamic behavior in water; PEG is soluble under the present conditions, whereas PPG is not Kje81 . Thus the PPG block is assumed to stick to the glass slides, whereas the more hydrophilic PEG parts form a molecular brush, as illustrated in Fig. 1 b). As a consequence, there is no well defined plane-of-shear.
| (m2/s) | this work | theory | prev. work | |
|---|---|---|---|---|
| Pluronic F-127 | 13 | 15 Cha03 ; Kit04 | ||
| Glass | 1.8 | Der87 | Nin08 |
Since the water-polymer interface consists essentially of hydrophilic blocks, one expects the parameter to be mainly determined by the PEG properties. The excess enthalpy of PEG in water results from the balance of the hydrogen bridging of the oxygen () and the opposite hydrophobic effect of the poly-ethylene. The measured enthalpy of mixing at low PEG content is J per monomer Mal57 . Taking the polymer as a rod of radius and unit length , and assuming that the enthalpy density is constant within the interaction length and zero beyond, we obtain and a thermo-osmotic coefficient
| (4) |
with and the numerical value Å. This estimate agrees well with the present measurement and previous thermophoresis data for PEG.
The situation is less clear concerning thermo-osmosis on a bare glass surface. Our experiment shows a slip velocity towards the heated spot, implying a negative enthalpy , and the analysis of the experimental data gives . Previous works, however, reported the opposite effect: In their thermo-osmosis experiments on porous glass, Derjaguin et al. found Der87 , and the Soret data of Rusconi et al. on Ludox particles provided a positive thermophoretic mobility Nin08 .
The excess enthalpy in the vicinity of a glass surface is a complex quantity. Besides electrostatic and van der Waals forces, structuration of water seems to play a major role Der80 . The latter results in an increase of enthalpy (), whereas the electric-double layer contribution is negative. This would suggest that the positive coefficient of the present experiment results from surface charges, and that previous findings are dominated by a strong structuration contribution (). This is supported by the temperature dependence of Derjaguin’s data Der87 : The negative thermo-osmotic coefficient has a large positive derivative ; this is expected for the structuration of water which is strong at low temperatures yet weakens at higher . On the other hand, the dependence of on salinity and pH reported in Nin08 , indicates a significant electrostatic contribution, in addition to the dominant structuration effect.
The above discussion suggests that the present data () are related to the electrostatic contribution. Glass in contact with water in general carries surface charges, which give rise to an electric double layer with Debye screening length , as sketched in Fig. 1. The electric-double layer enthalpy is negative and thus results in a flow towards the heat source (). In the Debye-Hückel approximation one has , where is the permittivity and the surface potential, resulting in
| (5) |
With , one finds , which agrees with both the sign and the order of magnitude of the measured value.
Bulk velocity field
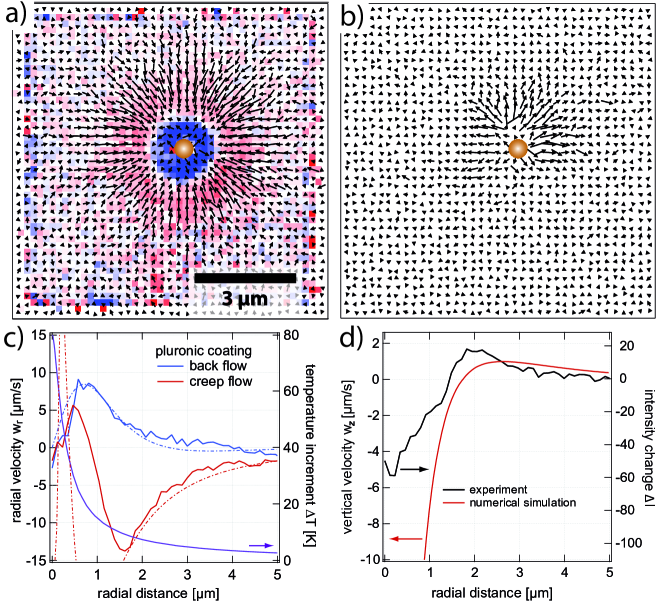
In order to fully characterize the thermo-osmotic flow field, we measured both radial and vertical components and of the bulk velocity field and compare it to numerical results using finite element simulations (COMSOL)SI . The vertical separation is achieved by collecting signals of different intensity, which correspond to tracer particles at different . Figure 4 a) depicts the flow field detected for the brightest tracer particles at the interface, which is directed towards the heat source. At intermediate intensities the flow is directed away from the heat source (Fig. 4 b). This reversal of the flow direction is obvious from the mass conservation; the inward slip velocity at the boundaries requires an outward flow in the center of the liquid film. The corresponding radial dependencies are plotted in Fig. 4 c) and agree well with the dependence expected from eq. 3 at distances beyond . At shorter distances, the velocity profile reveals a vertical component . This vertical component, averaged over the complete film thickness, is detected by counting the number of particles which decrease or increase their scattering intensity within neighboring frames. A decrease in intensity corresponds to a downward motion of the particles, away from the heat source, while an increase intensity reveals an upward motion. Figure 4 a) depicts in the color underlay that close to heat source particles on average move vertically away from the heat source (blue). At about distance from the heat source a motion in the opposite direction is observed, while even farther away no net transport in the vertical direction is found. The corresponding intensity changes are plotted in Figure 4 d). This detected vertical flow can only be due to the thermo-osmosis as convection is in the used sample geometry absent. Further, the radiation pressure acting in the region of the heating laser is pointing against the detected vertical flow. The complete calculated flow field is depicted in Fig. 1 c).
Summary
We have measured the velocity field caused by thermo-osmosis due to a heated gold nanoparticle fixed at the surface of a glass slide. The inferred interfacial flow velocities reach values of up to and set up a parabolic flow field in the water film at large distances from the heat source. The slip velocities are found much stronger at interfaces covered with non-ionic block-copolymers as compared to bare charged glass interfaces. The good agreement of the numbers gathered in Table 1 leads us to the conclusion that the slip velocity on a Pluronic-coated surface is driven by thermo-osmosis on the PEG-water interface. More generally, they confirm the role of the interaction enthalpy for the thermal separation of molecular mixtures Wue14 and suggest that simple models such as eq. 4 provide a good description for Soret data of polymers. Regarding the thermo-osmosis on a glass surface, our findings differ from previous results. The discrepancy probably results from the competition of electric-double layer forces and structuration of water; their contributions to the excess enthalpy are of opposite sign and thus may result in a positive or negative slip velocity. Our results further suggest that thermo-osmotic flows along solid/liquid interfaces may contribute considerably to thermophoretic measurements in thin film geometries and may be harnessed for microfluidic applications.
The authors acknowledge financial support by Sonderforschungsbereich TRR 102, the DFG priority program 1726 ”Microswimmers”, the Sächsische Forschergruppe FOR 877, the DFG the joint DFG/ANR project ”Thermoelectric effects at the nanoscale” and Leibniz Program at the Universität Leipzig.
References
- (1) B.E. Logan, M. Elimelech, Nature 488, 313 (2012).
- (2) C.B. Picallo, S. Gravelle, L. Joly, E. Charlaix, L. Bocquet, Phys. Rev. Lett. 111, 244501 (2013).
- (3) B.V. Derjaguin,. G.P. Sidorenkov, Doklady Akad. Nauk. SSSR 32, 622 (1941).
- (4) H.-R. Jiang, N. Yoshinaga, M. Sano, Phys. Rev. Lett. 105, 268302 (2010).
- (5) I. Buttinoni, G. Volpe, F. Kümmel, G. Volpe, C. Bechinger, J. Phys.: Condens. Matter 24, 284129 (2012).
- (6) B. Qian, D. Montiel, A. Bregulla, F. Cichos, H. Yang, Chem. Sci. 4, 1420 (2013).
- (7) F. Weinert, D. Braun, Phys. Rev. Lett. Phys. Rev. Lett. 101, 168301 (2008).
- (8) R. Di Leonardo, F. Ianni, G. Ruocco, Langmuir 25, 4247 (2009).
- (9) A. Bregulla, H. Yang, F. Cichos, ACS Nano 8, 6542 (2014).
- (10) S. Duhr and D. Braun, Phys. Rev. Lett. 97, 038103 (2006).
- (11) Y.T. Maeda, A. Buguin, A. Libchaber, Phys. Rev.Lett. 107, 038301 (2011).
- (12) J.N. Pedersen, C.J. Löscher, R. Marie, L.H. Thamdrup, A. Kristensen, H. Flyvbjerg, Phys. Rev. Lett. 113, 268301 (2014).
- (13) M. Braun, F. Cichos, ACS Nano 7, 11200 (2013).
- (14) M. Braun,A. Bregulla, K. Günther, M. Mertig, F. Cichos, Nano Lett. 15, 5499 (2015).
- (15) L.-H. Yu, Y.-F. Chen, Anal. Chem. 87, 2845 (2015).
- (16) A. Würger, Rep. Prog. Phys. 73, 126601(2010).
- (17) A. Würger, Phys. Rev. Lett. 115, 188304 (2015).
- (18) K.A. Eslahian, A. Majee, M. Maskos, A. Würger, Soft Matter 10, 1931 (2014).
- (19) D. Vigolo, S. Buzzaccaro and R. Piazza, Langmuir 26, 7792 (2010).
- (20) A. Brown, W. Poon, Soft Matter 10, 4016 (2014).
- (21) M. Reichl, M. Herzog, A. Götz, D. Braun, Phys. Rev. Lett. 112, 198101 (2014).
- (22) J. Chen, Z. Kang, S.K. Kong, H.-P. Ho, Opt. Lett. 40, 3926 (2015).
- (23) A. Cuche, A. Canaguier-Durand, E. Devaux, J.A. Hutchison, C. Genet, T.W. Ebbesen, Nano Lett. 13, 4230 (2013).
- (24) B.V. Derjaguin, N.V. Churaev, V.M. Muller, Surfaceforces Plenum New York (1987).
- (25) J.P.G. Villaluenga, B. Seoane, V.M. Barragán, C. Ruiz-Bauzá, J. Membrane Sci. 274, 116 (2006).
- (26) S. Kim, M.M. Mench, J. Membrane Sci. 328, 113 (2009).
- (27) S.R. de Groot, P. Mazur, Non-equlibrium Thermodynamics, North Holland Publishing, Amsterdam (1962).
- (28) See Supplemental Material
- (29) J.L. Anderson, Ann. Rev. Fluid Mech. 21, 61 (1989).
- (30) R. Kjellander, E. Florin, J. Chem. Soc., Faraday Trans. 1 24, 2053 (1981).
- (31) G.N. Malcolm, J.S. Rowlinson, Trans. Faraday Soc. 53, 921 (1957).
- (32) J. Chan, J. Popov, S. Kolisnek-Kehl, D. Leaist, J. Solut.Chem. 32, 197 (2003).
- (33) R. Kita, S. Wiegand, Jutta Luettmer-Strathmann,J. Chem. Phys. 121, 3874 (2004).
- (34) R. Rusconi, L. Isa, and R. Piazza, J. Opt. Soc. Am. B 21, 605 (2004).
- (35) B.V. Derjaguin, Pure Appl. Chem. 52, 1163 (1987).
- (36) A. Würger, J. Phys. Condens. Matt. 26, 035105 (2014).