Pluto’s atmosphere from the 29 June 2015 ground-based stellar occultation at the time of the New Horizons flyby111Partly based on observations made with the ESO WFI camera at the 2.2 m Telescope (La Silla), under program ID 079.A-9202(A) within the agreement between the ON/MCTI and the Max Planck Society, with the ESO camera NACO at the Very Large Telescope (Paranal), under program ID 089.C-0314(C), and at the Pico dos Dias Observatory/LNA, Brazil.
Abstract
We present results from a multi-chord Pluto stellar occultation observed on 29 June 2015 from New Zealand and Australia. This occurred only two weeks before the NASA New Horizons flyby of the Pluto system and serves as a useful comparison between ground-based and space results. We find that Pluto’s atmosphere is still expanding, with a significant pressure increase of 52% since 2013 and a factor of almost three since 1988. This trend rules out, as of today, an atmospheric collapse associated with Pluto’s recession from the Sun. A central flash, a rare occurrence, was observed from several sites in New Zealand. The flash shape and amplitude are compatible with a spherical and transparent atmospheric layer of roughly 3 km in thickness whose base lies at about 4 km above Pluto’s surface, and where an average thermal gradient of about 5 K km-1 prevails. We discuss the possibility that small departures between the observed and modeled flash are caused by local topographic features (mountains) along Pluto’s limb that block the stellar light. Finally, using two possible temperature profiles, and extrapolating our pressure profile from our deepest accessible level down to the surface, we obtain a possible range of 11.9-13.7 bar for the surface pressure.
1 Introduction
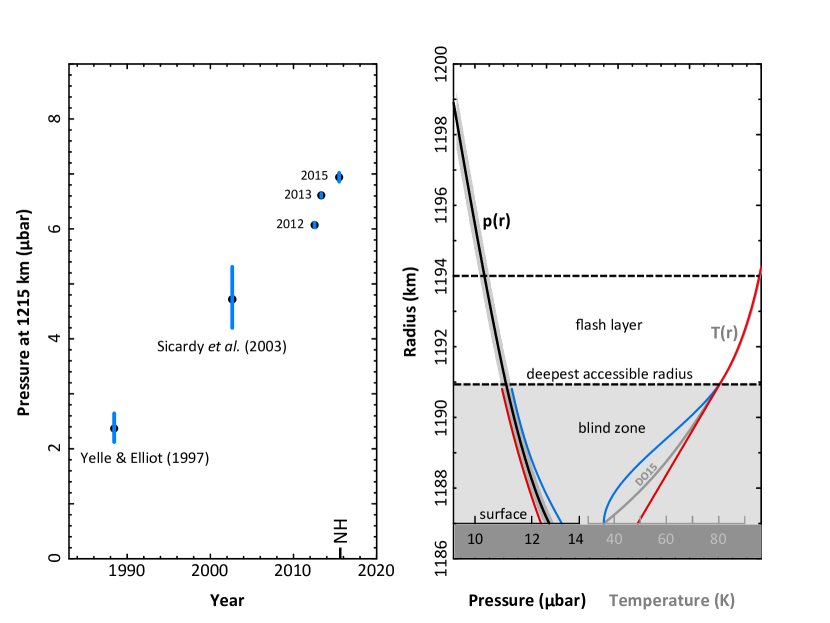
Ground-based stellar occultations probe Pluto’s atmosphere at radii ranging from km from the planet center (pressure bar) up to km ( bar). In a previous work (Dias-Oliveira et al., 2015, DO15 hereafter), we analyzed high signal-to-noise-ratio occultations observed in 2012 and 2013, and derived stringent constraints on Pluto’s atmospheric profiles (density, pressure and temperature profiles). and on Pluto’s radius ( km, assuming no troposphere). We also found a pressure increase of % between 2012 and 2013.
Here we analyze a stellar occultation, observed on 29 June 2015 from Australia and New Zealand, which occurred two weeks before the NASA New Horizons (NH hereafter) flyby of the Pluto system. Our goals are: (1) assess further pressure changes between 2013 and 2015 (eventually providing useful constraints on Pluto’s seasonal models); (2) analyze the central flash that was detected for the first time ever from multiple stations. It constrains the thermal structure of a layer immediately above Pluto’s surface, its possible departure from sphericity and/or presence of hazes; and (3) constrain the pressure at Pluto’s surface. Besides serving as a useful comparison with the NH results, our work is one more benchmark in the long-term survey of Pluto’s atmosphere over the forthcoming years.
2 The 29 June 2015 occultation
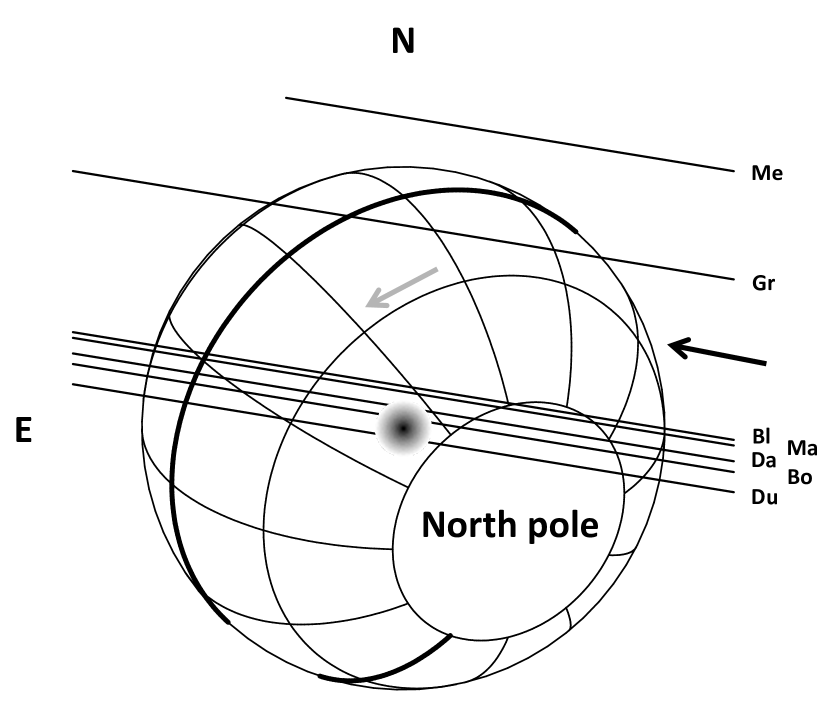
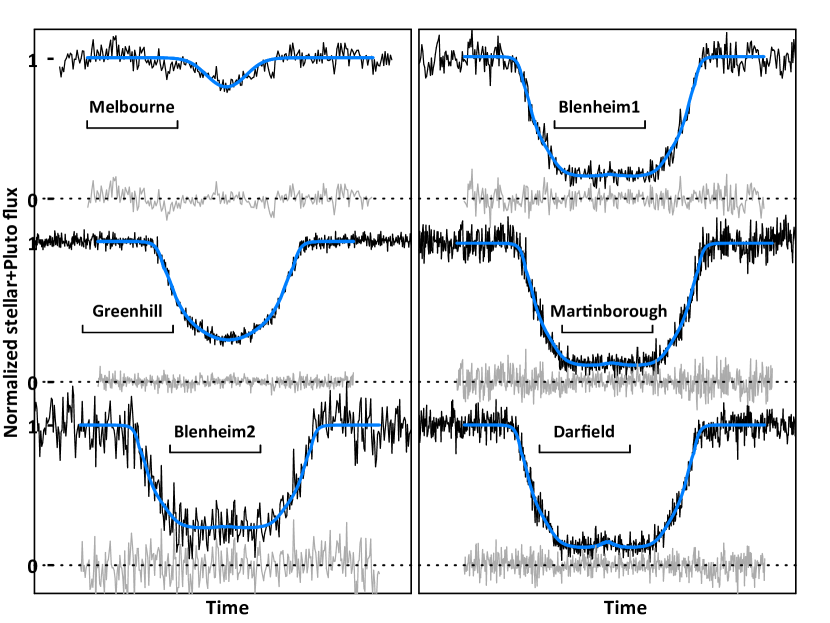
The prediction procedures are described in DO15, Assafin et al. (2010) and Benedetti-Rossi et al. (2014). The event was monitored from Australia and New Zealand (Table 1), from which we obtained eight occultation detections. The reconstructed occultation geometry is displayed in Fig. 1, see also Table 2. The light-curves were obtained from classical aperture photometry, after correction of low frequency variations (caused by changing sky conditions) by means of nearby reference stars, when available. The resulting light-curves give the total flux from the star and Pluto’s system, normalized to unity outside the occultation, as a function of time (Fig. 2). The observed flux can be written:
| (1) |
where is the (useful) stellar flux alone, normalized between zero and unity. Thus, and are the contributions of Pluto’s system and the unocculted stellar flux to , respectively.
The quantity is in principle measured independently when Pluto and the occulted star are angularly resolved, providing . It is difficult in practice and requires high photometric accuracy on the star, Pluto and nearby reference stars hours or days away from the event. During that time, sky and instrument conditions may vary. Moreover, for data taken without a filter (broadband), chromatic dependence of the extinction adds further systematic biases, especially if calibrations are not made at the same airmass.
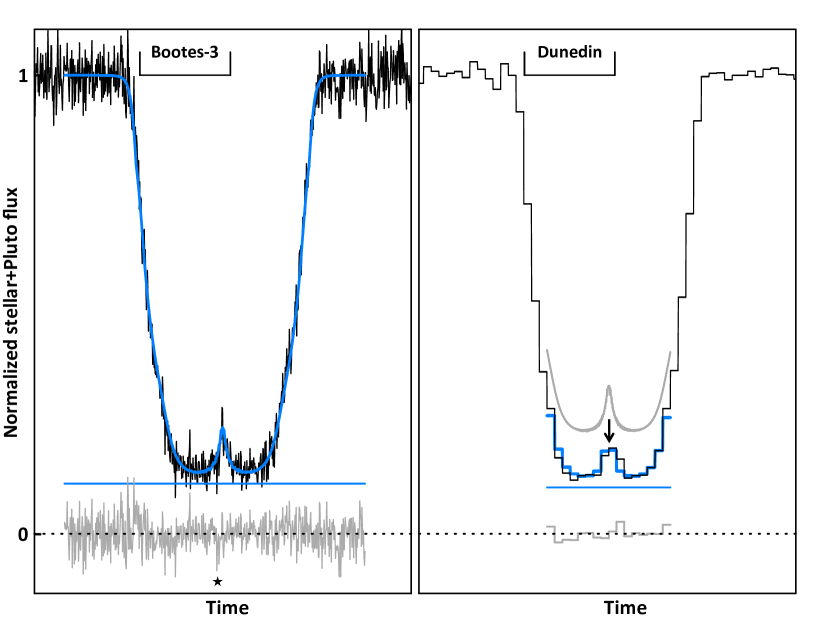
One station that went deep into Pluto’s shadow (BOOTES-3, broadband, Castro-Tirado et al. 2012) obtained calibration images hours before the event, as the star and Pluto were marginally resolved. However, the overlap of the star and Pluto images prevents the useful determination of the Pluto/star ratio at the required accuracy (1% or better). Moreover the airmass variation (1.1 during calibration vs. 1.6 during the occultation) introduces unmodeled chromatic effects due to color differences between the star and Pluto. More images taken the following night at very high airmass (3.6) do not provide further constraints on .
One light-curve (Dunedin) was affected by non-linearity caused by a so-called “ factor” (Poynton, 1997) that modified the pixel values to increase the image dynamical range . The (supposedly) reverse transformation provides an event that is globally not deep enough considering its duration, indicating residual non-linearities. Thus, for this station, we only used the bottom part of the light-curve (Fig. 2), assuming that in this range, the retrieved flux is an affine function of the stellar flux, .
In spite of the lack of accurate measurements for , the amplifying effect of the central flash still constrains the thermal structure of Pluto’s deepest atmospheric layers (see Section 4).
3 Pressure evolution
The DO15 model uses the simplest possible hypotheses, i.e. Pluto’s atmosphere (1) is pure nitrogen (N2), (2) is spherically symmetric, (3) has a time-independent thermal structure, derived itself from the light-curves, and (4) is transparent (haze-free). The validity of hypotheses (1)-(3) is discussed in DO15. Hypothesis (4) is discussed later in view of the NH results. Adjusting the pressure at a reference radius (for a given event) uniquely defines the molecular density profile , from which synthetic light-curves are generated and compared to the data. Note that monitors the evolution of Pluto’s atmospheric pressure as a whole. In practice, most of the contribution to the fits comes from the half-light level (, km, bar), with a tapering off above km (, bar) and below km (, bar).
The parameters of our model are listed in Table 2 and our simultaneous fits are displayed in Fig. 2. They have per degree of freedom close to unity, indicating satisfactory fits. Two minor modifications were introduced, relative to the DO15 model. First, we updated for consistency Pluto’s mass factor to m3 s-2 (Stern et al., 2015), instead of m3 s-2, causing negligible changes at our accuracy level. Second, we use the NH-derived Pluto radius ( km) as a boundary condition for the DO15 model. This new value modifies (at a few percent level) the retrieved pressure at a given radius compared to DO15. Moreover, changing translates vertically all the profiles near the surface by an equivalent amount. In other words, all the quantities of interest (pressure, density, temperature) are well defined in terms of altitude above the surface, if not in absolute radius.
The pressures at km and km are given in Table 2. They are useful benchmarks, respectively corresponding to the stratopause (maximum temperature of 110 K), and the half-light level layer. Fig. 3 displays the pressure evolution over 2012-2015. The formal error bars assume an invariant temperature profile, but this assumption should not affect the relative pressure changes in 2012-2015. Relaxing that constraint, we can retrieve by inverting individual light-curves and testing the effects of the inversion parameters. This yields possible biases estimated to and bar in 2012, 2013 and 2015, respectively. We have added for comparison occultation results from 1988 (Yelle & Elliot, 1997) and 2002 (Sicardy et al., 2003). They stem from different analyses and may also be affected by biases. However, Fig. 3 should capture the main trend of Pluto’s atmosphere, i.e. a monotonic increase of pressure since 1988.
4 Central flash
Nearly diametric occultation light-curves (but still avoiding the central flash) have flat bottoms (Fig. 2). Our ray tracing code shows that near the shadow center, the stellar rays come from a “flash layer” about 3 km in thickness just above km, thus sitting 4 km on top of the assumed surface ( km, Fig. 3).
Let us denote by a model for the stellar flux (distinguishing it from the observed flux ). Deep inside Pluto’s shadow, is roughly proportional to the local density scale-height, , where is the molecular weight, is the acceleration of gravity and is Boltzmann’s constant (DO15). For a spherical atmosphere, we have also , where is the distance to the shadow center. Writing , where is the closest approach distance to the shadow center and is the distance traveled from that point, we obtain:
| (2) |
For an approximatively pure N2 atmosphere ( kg), we obtain K km-1. As the thermal gradient is several degrees per kilometer at the flash layer (see below), the flash amplitude is significantly controlled by .
Our best model minimizes , where is the variance of associated with the noise for the data point. As we do not measure , we considered it as a free, adjustable parameter. Among the data sets analyzed by DO15, only one had sufficient quality - from the 18 July 2012 ESO Very Large Telescope - to permit a measurement of and thus constrain in the deepest accessible layer. It showed that the residual stellar flux, , at the bottom part of the light-curve lay in the range 0.010-0.031, thus imposing a thermal gradient near the surface (and imposing for the other light-curves). Since was determined to within a factor of three, a large error bar on deep in Pluto’s atmosphere was obtained, causing difficulties when extrapolating the pressure down to the surface. In doing so, we obtained a possible range 10-12 bar for the surface pressure in 2012, estimated at km.
As is roughly constant at the bottom of occultation light-curves (far from the flash), there is a degeneracy between and : higher values of can be accommodated by smaller values of , i.e. smaller . This is not true anymore within the flash, as suffers significant variations. The -minimization provides both and through and . Although our ray tracing code generates exact values of for a given model, it is convenient here (for sake of illustration) to note that is essentially proportional to (Eq. 2), so that . Detailed calculations show that at minimum , we have for , where is the variance of (the bars denoting average values) and is the number of data points. Thus, the relative error bar on the scale-height is , which is small if the flash (and then ) is large.
Since increases as increases or decreases, and are correlated. However, the full width at half maximum (FWHM) of the flash is proportional to , while controls homogeneously the flash amplitude, keeping its FWHM constant. This disentangles the effects of and . More importantly, the BOOTES-3 and Dunedin stations exhibit flashes with similar amplitudes (Fig. 2). This robustly forces the two stations to be symmetrically placed with respect to the shadow center (Fig. 1), thus imposing km for both stations, independently of (Table 2).
The -value is minimized for K km-1 at 1191 km in our model. This particular value must be considered with caution, as it is not representative of the entire flash layer. Due to the functional dependence of (a branch of hyperbola, DO15), the gradient varies rapidly around 1191 km. The average thermal gradient in the flash layer is in fact 5 K km-1, consistent with a previous flash analysis (Olkin et al., 2014). Besides, it is typical of what is expected from the heating by methane (D. Strobel 2015, private communication). Other functional forms of could be tested, but this remains outside the scope of this paper. We note in passing that our best 2015 fit implies a residual stellar flux (Fig. 2) that is compatible with the possible range (0.010-0.031) mentioned earlier for 2012.
Our spherical, transparent atmospheric model essentially captures the correct shape and height of the central flash (Fig. 2). A closer examination of that figure reveals a small flux deficit (relative to the model) at the left side of the BOOTES-3 flash. It remains marginal, however, considering the general noise level. This said, it could be caused by an unmodeled departure of the flash layer from sphericity, but this is not anticipated. An atmosphere of radius rotating at angular velocity has an expected oblateness for a rotation period of 6.4 days, km and Pluto’s . Such oblateness causes a diamond-shaped caustic (Elliot et al., 1977) with a span of km in the shadow plane. This is negligible considering the closest approach distances involved here (45 km). Moreover, expected zonal winds of less than a few meters per second near 1191 km (Vangvichith, 2013; Zalucha & Michaels, 2013) would have even smaller effects. More complex distortions may arise, as varying thermal conditions along Pluto’s limb may slightly tilt the local iso-density layer, but its modeling remains outside the scope of this paper.
A possible explanation of the small discrepancy is that the primary and/or secondary stellar images hit topographic features while moving around Pluto’s limb. Curvature effects strongly stretch the images parallel to the limb during the central flash, by a ratio equal to the flash layer radius (1191 km) divided by the closest approach distance, about 45 km. From the star magnitudes (Table 2 and Kervella et al. 2004), we estimate its diameter as 33 as, or 0.76 km projected at Pluto. The length of the stellar image is then km. It moves at about 4 km above the surface, which is comparable to the local topographic features reported from NH (Stern et al., 2015). It is thus possible that part of the stellar flux was partially blocked by mountains, causing small observed drop. This can be tested by studying the topography derived from NH, noting that the primary and secondary stellar images at BOOTES-3 probed regions near longitude 190∘E and latitude 20∘S, and 10∘E and 20∘N, respectively, during the flash.
5 Surface pressure
Fig. 3 displays our best pressure profile, with bar at the deepest accessible level. To estimate the surface pressure, we need to extrapolate into the blind zone. Two possible temperature profiles are considered, beside the DO15 model (Fig. 3). One has a temperature gradient in the blind zone that tends to zero at the surface, where bar and K. This describes a shallow troposphere that is in vapor pressure equilibrium with the surface, an example of a locally sublimating N2 frost layer. The other profile has a constant gradient of 8.5 K km-1, with bar and K. Such warmer regions are indeed observed on Pluto (Lellouch et al., 2000), and they do not sublimate due to the absence of free N2 frost. Considering the formal error bar bar on , we obtain a range of 12.4-13.2 bar for the surface pressure under hypotheses (1)-(4) of Section 3, and 11.9-13.7 bar accounting for the already dicussed possible bias of bar. Other thermal profiles should be considered at this point, but they would not change significantly our result due to the proximity (4 km) of our deepest accessible level to the surface, leaving little freedom for .
6 Conclusions
The 29 June 2015 stellar occultation provided a snapshot of Pluto’s atmosphere, after years of similar observations. Moreover, this was the first event with multi-chord cuts into the central flash. Assuming a spherical and transparent atmosphere as in DO15, we satisfactorily fit all the light-curves, including the central flash part (Fig. 2).
We find that Pluto’s atmospheric pressure has been increasing monotonically since 1988, with an augmentation of % between 2013 and 2015, and an overall factor of almost three between 1988 and 2015 (Fig. 3). This trend between 1988 and 2013 was confirmed by independent works by Elliot et al. (2003); Pasachoff et al. (2005); Person et al. (2013); Young (2013); Bosh et al. (2015). It is now extended to 2015 and rules out an ongoing atmospheric collapse associated with Pluto’s recession from the Sun. This is consistent with high thermal inertia models with a permanent N2 ice cap over Pluto’s north pole, that preclude such collapse (Olkin et al., 2015). Other possible models where N2 condenses on an unlit cap might announce a pressure decrease in the forthcoming years (Hansen et al., 2015). Further monitoring with occultations and a detailed analysis of the NH data will allow discrimination between those scenarios.
The central flash comes from a 3-km-thick layer whose base is 4 km on top of Pluto’s surface. The amplitude of the flash is consistent with an average thermal gradient of 5 K km-1 in that layer. Small departures from the model might be caused by topographic features along Pluto’s limb that block the stellar images.
Extrapolating possible temperature profiles down to the surface, we find a possible range of 11.9-13.7 bar for the surface pressure. This is larger than, but compatible with the entry value bar derived from the NH radio occultation experiment (Hinson et al., 2015; Gladstone et al., 2016). At this stage, more detailed investigations of both techniques should be undertaken to see if this difference is significant, or the result of unaccounted effects. In any case, the two techniques validate each other, an excellent prospect for future monitoring of Pluto’s atmosphere from ground-based occultations.
References
- Assafin et al. (2010) Assafin, M., Camargo, J. I. B., Vieira Martins, R., et al. 2010, Astron. Astrophys., 515, A32
- Benedetti-Rossi et al. (2014) Benedetti-Rossi, G., Vieira Martins, R., Camargo, J. I. B., Assafin, M., & Braga-Ribas, F. 2014, Astron. Astrophys., 570, A86
- Bosh et al. (2015) Bosh, A. S., Person, M. J., Levine, S. E., et al. 2015, Icarus, 246, 237
- Castro-Tirado et al. (2012) Castro-Tirado, A. J., Jelínek, M., Gorosabel, J., et al. 2012, in Astronomical Society of India Conference Series, Vol. 7, Astronomical Society of India Conference Series, 313–320
- Cutri (2012) Cutri, R. M. 2012, VizieR Online Data Catalog, 2311
- Cutri et al. (2003) Cutri, R. M., Skrutskie, M. F., van Dyk, S., et al. 2003, VizieR Online Data Catalog, 2246
- Dias-Oliveira et al. (2015) Dias-Oliveira, A., Sicardy, B., Lellouch, E., et al. 2015, ApJ, 811, 53
- Elliot et al. (1977) Elliot, J. L., French, R. G., Dunham, E., et al. 1977, ApJ, 217, 661
- Elliot et al. (2003) Elliot, J. L., Ates, A., Babcock, B. A., et al. 2003, Nature, 424, 165
- Gladstone et al. (2016) Gladstone, G. R., Stern, S. A., Ennico, K., et al. 2016, Science, in press
- Hansen et al. (2015) Hansen, C. J., Paige, D. A., & Young, L. A. 2015, Icarus, 246, 183
- Hinson et al. (2015) Hinson, D. P., Linscott, I., Tyler, L., et al. 2015, in AAS/Division for Planetary Sciences Meeting Abstracts, Vol. 47, AAS/Division for Planetary Sciences Meeting Abstracts, #105.01
- Kervella et al. (2004) Kervella, P., Thévenin, F., Di Folco, E., & Ségransan, D. 2004, Astron. Astrophys., 426, 297
- Lellouch et al. (2000) Lellouch, E., Laureijs, R., Schmitt, B., et al. 2000, Icarus, 147, 220
- Olkin et al. (2014) Olkin, C. B., Young, L. A., French, R. G., et al. 2014, Icarus, 239, 15
- Olkin et al. (2015) Olkin, C. B., Young, L. A., Borncamp, D., et al. 2015, Icarus, 246, 220
- Pasachoff et al. (2005) Pasachoff, J. M., Souza, S. P., Babcock, B. A., et al. 2005, Astron. J., 129, 1718
- Person et al. (2013) Person, M. J., Dunham, E. W., Bosh, A. S., et al. 2013, Astron. J., 146, 83
- Poynton (1997) Poynton, C. 1997, Chapter 6: Gamma, ed. J. Wiley & Sons, 91
- Sicardy et al. (2003) Sicardy, B., Widemann, T., Lellouch, E., et al. 2003, Nature, 424, 168
- Stern et al. (2015) Stern, S. A., Bagenal, F., Ennico, K., et al. 2015, Science, 350, 292
- Tholen et al. (2008) Tholen, D. J., Buie, M. W., Grundy, W. M., & Elliott, G. T. 2008, Astron. J., 135, 777
- Vangvichith (2013) Vangvichith, M. 2013, Thèse de Doctorat, Ecole Polytechnique, France
- Yelle & Elliot (1997) Yelle, R. V., & Elliot, J. L. 1997, Atmospheric Structure and Composition: Pluto and Charon, ed. S. A. Stern & D. J. Tholen, 347
- Young (2013) Young, L. A. 2013, Astrophys. J., Lett., 766, L22
- Zacharias et al. (2013) Zacharias, N., Finch, C. T., Girard, T. M., et al. 2013, Astron. J., 145, 44
- Zalucha & Michaels (2013) Zalucha, A. M., & Michaels, T. I. 2013, Icarus, 223, 819
| Site | Lat. (d:m:s) | Telescope | Exp. Time/ | Observers |
|---|---|---|---|---|
| Lon. (d:m:s) | Instrument | Cycle (s) | remarks | |
| altitude (m) | Filter | |||
| Melbourne | 37 50 38.50 S | 0.20 m | 0.32 | J. Milner |
| Australia | 145 14 24.40 E | CCD/clear | 0.32 | occultation detected |
| 110 | ||||
| Spring Hill | 42 25 51.55 S | Harlingten/1.27 m | 0.1 | A. A. Cole, A. B. Giles |
| Greenhill Obs. | 147 17 15.49 E | EMCCD/B | 0.1 | K. M. Hill |
| Australia | 650 | occultation detected | ||
| Blenheim1 | 41 32 08.59 S | 0.28 m | 0.64 | G. McKay |
| New Zealand | 173 57 25.09 E | CCD/clear | 0.64 | occultation detected |
| 18 | ||||
| Blenheim2 | 41 29 36.27 S | 0.40 m | 0.32 | W. H. Allen |
| New Zealand | 173 50 20.72 E | CCD/clear | 0.32 | occultation detected |
| 38 | ||||
| Martinborough | 41 14 17.04 S | 0.25 m | 0.16 | P. B. Graham |
| New Zealand | 175 29 01.18 E | CCD/B | 0.16 | occultation detected |
| 73 | ||||
| Oxford | 43 18 36 S | 0.35 m | 1.28 | S. Parker |
| New Zealand | 172 13 08 E | CCD/clear | 1.28 | occultation detected, partially |
| 66 m | cloudy, not yet analyzed | |||
| Darfield | 43 28 52.90 S | 0.25 m | 0.32 | B. Loader |
| New Zealand | 172 06 24.04 E | CCD/clear | 0.32 | occultation detected, flash |
| 210 | ||||
| Christchurch | 43 31 41 S | 0.15 m | 0.25 | R. Glassey |
| New Zealand | 172 34 54 E | CCD/clear | 0.25 | occultation detected |
| 16 | not yet analyzed | |||
| BOOTES-3 station | 45 02 17.39 S | Yock-Allen/0.6m | 0.34368 | M. Jelínek |
| Lauder | 169 41 00.88 E | EMCCD/clear | 0.34463 | occultation detected, flash |
| New Zealand | 370 | |||
| Dunedin | 45 54 31. S | 0.35 m | 5.12 | A. Pennell, S. Todd |
| New Zealand | 170 28 46. E | CCD/clear | 5.12 | M. Harnisch, R. Jansen |
| 118 | occultation detected, flash | |||
| Glenlee | 23:16:09.6 S | 0.30 m | 0.32 | S. Kerr |
| Australia | 150:30:00.8 E | CCD/clear | 0.32 | no occultation detected |
| 50 | ||||
| Reedy Creek | 28 06 29.9 S | 0.25 m | 0.64 | J. Broughton |
| Australia | 153 23 52.0 E | CCD/clear | 0.64 | no occultation detected |
| 65 | ||||
| Linden | 33 42 30.0 S | 0.76 m, 0.2 m | 0.133, 1.28 | D. Gault, R. Horvat |
| Australia | 150 29 43.5 E | CCD/clear | 0.133, 1.28 | L. Davis |
| 583 | no occultation detected | |||
| Leura | 33 43 09.0 S | 0.20 m | n.a. | P. Nosworthy |
| Australia | 150 20 53.9 E | visual | n.a. | no occultation detected |
| 903m | ||||
| Penrith | 33 45 43.31 S | 0.62 m | 0.533 | D. Giles |
| Australia | 150 44 30.30 E | CCD/Clear | 0.533 | M. A. Barry |
| 96 | no occultation detected | |||
| St Clair, | 33 48 37 S | 0.35 m | 0.04 | H. Pavlov |
| Australia | 150 46 37 E | CCD/Clear | 0.04 | no occultation detected |
| 41 | ||||
| Murrumbateman | 34 57 31.50 S | 0.40 m & 0.35 m | 0.16 & 2 | D. Herald, M. Streamer |
| Australia | 148 59 54.80 E | CCD/clear | 0.16 & 2 | no occultation detected |
| 594 | ||||
| Nagambie | 36 47 05.71 S | 0.20 m | 0.64 | D. Hooper |
| Australia | 145 07 59.14 E | CCD/clear | 0.64 | no occultation detected |
| 129 |
| Input parameters | |||
| Star | |||
| Coordinates at epoch (J2000)11footnotemark: 1 | = 19h 00m 49.4801 mas, = -20d 41’ 40.801” mas | ||
| B, V, R, K magnitudes22footnotemark: 2 | 12.8, 12.2, 12.8, 10.6 | ||
| Pluto parameters | |||
| Pluto’s geocentric distance, shadow velocity33footnotemark: 3 | km, 24.1 km s-1 (at 16:53 UT) | ||
| Pluto’s mass and radius44footnotemark: 4 (Stern et al., 2015) | m3 s-2, km | ||
| Sub-observer and sub-solar latitudes44footnotemark: 4 | B= +51.66 deg, B’= +51.46 deg | ||
| Pluto’s north pole position angle44footnotemark: 4 | P= +228.48 deg | ||
| Results | |||
| Thermal profile (input values for the DO15 model) | |||
| , , , , | km, 81.7 K, 8.5 K km-1, km, 109.7 K | ||
| , , , | km, 95.5 K, km, 80.6 K | ||
| , , | |||
| , , | |||
| , , | |||
| Longitudes and latitudes of half-light sub-occultation points55footnotemark: 5 | |||
| ingress | |||
| Greenhill (154∘E, 06∘N, MT), Blenheim (120∘E, 28∘N, MT), Martinborough (119∘E, 28∘N, MT) | |||
| Darfield (115∘E, 30∘N, MT), Bootes-3 (113∘E, 31∘N, MT), Dunedin (108∘E, 32∘N, MT) | |||
| egress | |||
| Greenhill (232∘E, 37∘S, MT), Blenheim (280∘E, 35∘S, ET), Martinborough (282∘E, 34∘S, ET) | |||
| Darfield (286∘E, 33∘S, ET), Bootes-3 (288∘E, 33∘S, ET), Dunedin (293∘E, 31∘S, ET) | |||
| Pressure (quoted errors at 1 level66footnotemark: 6) | |||
| 18 July 2012 | 04 May 2013 | 29 June 2015 | |
| Pressure at 1215 km, | bar | bar | bar |
| Pressure at 1275 km, | bar | bar | bar |
| Surface pressure (Fig. 3) | bar | ||
| Astrometry | |||
| Time of closest approach to shadow center (UT) | Closest approach to shadow center | ||
| BOOTES-3: 16h 52m s | km N of shadow center | ||
| Dunedin: 16h 52m s | km S of shadow center | ||
| Geocenter: 16h 55m s | km N of shadow center | ||
See title’s footnote for information.
22footnotemark: 2Zacharias et al. (2013); Cutri et al. (2003); Cutri (2012).
33footnotemark: 3PLU043/DE433 ephemeris.
44footnotemark: 4Using Pluto’s north pole J2000 position:
= 08h 52m 12.94s,
= -06d 10’ 04.8” (Tholen et al., 2008).
55footnotemark: 5MT= morning terminator, ET= evening terminator.
66footnotemark: 6Formal errors.
Possible systematic biases are and bar
in 2012, 2013 and 2015, respectively (Section 3).