A normal supermassive black hole in NGC 1277
Abstract
The identification of galaxies with ‘overly massive’ black holes requires a black hole mass () and a host spheroid mass (). Here we provide our measurements for NGC 1277. Our structural decomposition reveals that NGC 1277 is dominated by a ‘classical’ spheroid with a Sérsic index , a half-light radius kpc, and a stellar mass of (using , Martín-Navarro et al.). This mass is an order of magnitude greater than originally reported. Using the latest –, –, and – relations, the expected black hole mass is respectively (, (, and ( (using km s-1) for which the ‘sphere-of-influence’ is . Our new kinematical maps obtained from laser guide star assisted, adaptive optics on the Keck I Telescope dramatically reaffirm the presence of the inner, nearly edge-on, disk seen in this galaxy’s image. We also report that this produces a large velocity shear (400 km s-1) across the inner (70 parsec) plus elevated values of across the inner region of the galaxy. Our new multi-Gaussian expansion (MGE) models and Jeans Anisotropic MGE (JAM) analysis struggled to match this component. Our optimal black hole mass, albeit a probable upper limit because of the disk, is (). This is an order of magnitude smaller than originally reported and 4 times smaller than recently reported. It gives an ratio of 0.45% in agreement with the median (0.5%) and range (0.1–5.0%) observed in non-dwarf, early-type galaxies. This result highlights the need for caution with inner disks.
Subject headings:
black hole physics — galaxies: individual (NGC 1277) — galaxies: kinematics and dynamics — galaxies: nuclei — galaxies: photometry — galaxies: structure1. Introduction
Using the Hobby-Eberly Telescope’s Marcario spectrograph under 1.6 seeing conditions, van den Bosch et al. (2012) claimed to have discovered a black hole in the nearby, compact but massive early-type galaxy NGC 1277. Not only is this the largest reported black hole mass with a direct measurement, but they remarked that it weighs in at an extraordinary 59% of its host spheroid’s stellar mass, and 14% of the galaxy’s total stellar mass. To put this in perspective, Graham & Scott (2013) reported that the average mass ratio was 0.49% for large spheroids, a result reiterated by Kormendy & Ho (2013), and recently upgraded to 0.68% by Savorgnan et al. (2015) using multi-component decompositions for a sample of 66 galaxies imaged in the infrared.
Due to this surprising black hole mass in NGC 1277, Emsellem (2013) revisited its derivation using the same data. Preferring an F550M (narrow -band) stellar mass-to-light ratio of 10 (consistent with a Salpeter-like Initial Mass Function) rather than the value of 6 reported in van den Bosch et al. (2012), Emsellem suggested a lower black hole mass of , albeit with a best fitting range reaching up to 2.5 due to his advocation for expanding the confidence intervals. Yıldırım et al. (2015) subsequently reported a preferred black hole mass of (), while Scharwächter et al. (2015) reported a value consistent with () based on the kinematics of CO(1-0) emission measured with the IRAM Plateau de Bure Interferometer at 1-arcsec resolution. Most recently, Walsh et al. (2015) have confirmed the optimal mass derived by Emsellem (2013), reporting and . All of these measures still leave a galaxy with an unusually high (black hole)-to-spheroid mass ratio. Emsellem (2013) additionally questioned whether the spheroid had been properly identified by van den Bosch et al. (2012), and he suggested that there may be a spheroid with a mass of , or within the inner 2 kpc, obtained by summing all of the components of his Multi-Gaussian photometric Expansion (MGE) model which had an ellipticity less than 0.7. Coupled with his reduced black hole mass, it gave an mass ratio of 3–5%.
We start our investigation of NGC 1277 by presenting an image analysis and measurement of the physical properties of its spheroidal stellar system. We perform a decomposition of NGC 1277 based on fundamental galaxy components. Knowing the properties of the spheroid, such as its Sérsic index and stellar mass, not only enables us to determine the expected black hole mass, but provides some insight into the history of NGC 1277. As suggested in Graham (2013) and Driver et al. (2013), the bulges in some of today’s massive lenticular galaxies are likely to be the descendents of the compact galaxies seen at high-redshift111Secular evolution of disks does not build massive bulges with Sérsic indices , and minor mergers will evolve, rather than preserve, the compact high- galaxies.. Many have the same small sizes, large masses, and radial concentrations of light — as traced by the Sérsic index (Dullo & Graham 2013). The subsequent accretion and growth of disks (e.g. White & Rees 1978; White & Frenk 1991), perhaps from cold gas flows (e.g. Pichon et al. 2011; Combes et al. 2014), around the initially compact galaxies would increase their total galaxy size, effectively hiding them — today’s massive bulges — in plain sight (Graham, Dullo & Savorgnan 2015). In NGC 1277, as in other nearby galaxies like NGC 1332 ( kpc, , Savorgnan & Graham 2015b), the disk is small enough that the whole galaxy is still a compact massive galaxy (see section 2.1).
Accounting for the different structural components in a galaxy can also be important for the direct measurement of the black hole mass, in particular with regard to the influence of disks. Unresolved disk rotation can enhance the observed velocity dispersion within a given resolution element, an issue noted by Tonry (1984) in regard to M32 and by Dressler (1989, his section 3) in regard to M87. Such “velocity shear” is also known to be an important consideration when dealing with poorly resolved galaxies at large redshift, where rotation can artificially raise the observed velocity dispersion (e.g. Law et al. 2009; Green et al. 2014). As noted in the conclusions of Graham et al. (2011), exactly the same situation can occur at the centers of nearby galaxies if they possess a (nearly) edge-on disk. Given that NGC 1277 has both an intermediate-scale disk (see Section 2) and a highly-inclined inner disk (Sections 2 and 5), this is of particular concern. Using new, high spatial-resolution spectroscopic data from the osiris instrument on the Keck I Telescope, in the second part of this paper we explore the spataila extent and kinematics of this inner disk. We additionally attempt an independent measurement of the galaxy’s black hole mass.
Our paper is laid out as follows. In Section 2 we perform a careful structural decomposition of a Hubble Space Telescope image of NGC 1277. Using the results from this analysis, in Section 3 we derive the expected black hole mass in NGC 1277. In Section 4 we present our new kinematic data from osiris, and in Section 5 we present a derivation of the black hole mass. Finally, we provide a discussion, including relevance to galaxies other than NGC 1277, and present our conclusions in Section 6.
Using the Planck 2013 results, we assume a spatially flat Universe (i.e. ) with a cosmological matter fraction and a Hubble constant km s-1 Mpc-1 (Planck Collaboration 2014). Correcting the heliocentric radial velocity of 506628 km s-1 (Falco et al. 1999) for (Virgo + Great-Attractor + Shapley) infall gives a redshift of 498333 km s-1 (obtained courtesy of NED222http://nedwww.ipac.caltech.edu) and an ‘angular size distance’ of 72.5 Mpc when using the above cosmology. This corresponds to a scale of 352 parsec per arcsecond (Wright 2006)333http://www.astro.ucla.edu/~wright/CosmoCalc.html. The ‘luminosity distance’ is 75.0 Mpc, giving a cosmological redshift corrected distance modulus of 34.38 mag. For reference, this is practically identical to the value of 34.39 mag (and pc) used by van den Bosch et al. (2012).
2. Image Analysis
We use an archival Hubble Space Telescope (HST), Advanced Camera for Surveys (ACS, Ford et al. 1998) observation444http://archive.stsci.edu/hst/search.php taken through an F550M (narrow -band) filter as a part of Proposal Id. 10546 (Canning et al. 2010). In data set J9BB01040, NGC 1277 is located off to the side of those authors’ primary target galaxy NGC 1275, located some 4 arcminutes away.
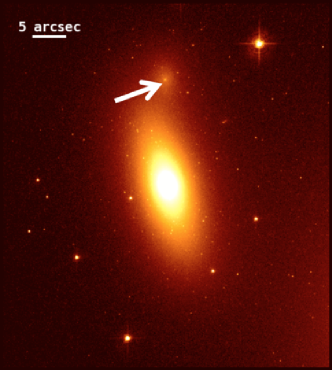
The background sky flux was subtracted to give a count of zero in the galaxy-free corners of the image. Galactic stars and background galaxies in the frame have been masked, and thus avoided in our analysis. We also paid special attention to the masking of two neighboring galaxies. The outskirts of NGC 1278 — a peculiar elliptical galaxy — appears as faint halo light in the bottom-right corner of Figure 1. The second neighbor is an elliptical galaxy (indicated with a white arrow in Figure 1) sitting above NGC 1277 at a projected separation of . These two galaxies have been heavily masked by us, ensuring that no significant light was affecting the outer regions of NGC 1277. Finally, our masking includes the near side of an obvious dust lane/ring affecting the nuclear region of NGC 1277. The final mask is shown in Figure 1.

2.1. 1D modelling
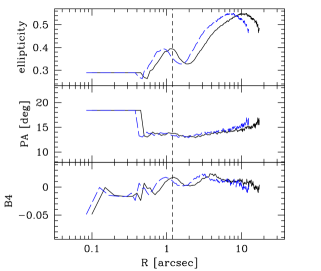
After masking the galaxy image, we performed an isophotal analysis with the IRAF task ellipse (Jedrzejewski 1987)555Our analysis was performed before isofit (Ciambur 2015) was conceived or available., holding the centre fixed and allowing the position angle and ellipticity to vary with radius. Figure 2 presents the ellipticity, ‘position angle’ and ‘fourth harmonic’666Quantifying the deviations of the isophotes from perfect ellipses using a Fourier series (Carter 1978), we show the amplitude of the coefficient of the ) term. radial profiles along the major-axis, and also along the equivalent-axis, i.e. the geometric mean of the major () and minor () axis () equivalent to a kind of circularized profile. The peaks at .2 in the ellipticity and fourth harmonic major-axis profiles are an immediately evident feature, indicating the presence of an inner disky component that has largely declined by . 10-12 along the major-axis, and at 7-8 along the equivalent-axis, clearly signaling the presence of an intermediate-scale disk. There are therefore two additional components apparent in NGC 1277, i.e. in addition to the main spheroidal structure.
In passing we note that galaxies with intermediate-scale disks, i.e. galaxies which are intermediate between ‘elliptical’ (E) and ‘lenticular’ (S0) galaxies, are not unusual. They were first referred to as ES galaxies by Liller (1966) and as E/S0 galaxies by Strom et al. (1977; see also Strom & Strom 1978 and Thompson 1976). They have since been referred to as “S0-like” (Michard 1984) and “disk-ellipticals” (Nieto et al. 1988) or “disky ellipticals” (Simien & Michard 1990). Unlike S0 galaxies, ES galaxies do not have extended disks which dominate the light at large radii.
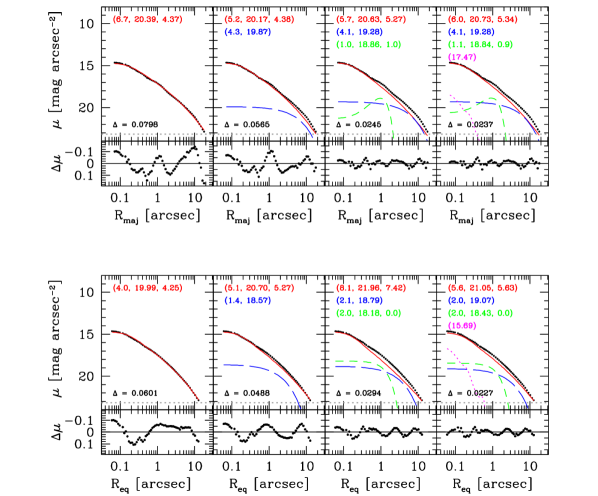
We fit the major- and equivalent-axis surface brightness profiles with a PSF-convolved model, where the radial point spread function (PSF) has been measured from suitably bright stars in the image and described with a Moffat function (, ). In Figure 3 we report a slight variation of the frequently used “root-mean-square deviation” () when quantifying the global goodness of each fit. Our variation is that we used rather than simply in the denominator due to our successive fitting of models with increased numbers of free parameters . This does not change the actual fit in any way, and with and ranging from just 3 to 9, the differences are small. For example, the fits to the equivalent-axis (lower panels in Figure 3) have “root-mean-square deviation” values of 0.0585, 0.0466, 0.0273 and 0.0209. It should also be kept in mind that both of these measurements reflect the global goodness of fit, and not the local goodness of fit. For example, adding a point-source will not have a big impact on the global “root-mean-square deviation” even though it may considerably reduce the residuals on a local scale where this component has been added. We have not used the (reduced) chi-squared statistic because this quantity is only useful when one has meaningful measurement errors. Due to dust, PSF errors, possible additional components, one may place an inappropriate weight on the data near the centre when using a (signal-to-noise)-weighted fitting scheme that does not readily account for these biasing factors.
As already noted, NGC 1277 is not a pure elliptical galaxy. Indeed, elliptical galaxies with ellipticity greater than 0.5, i.e. the old E5, E6 and E7 elliptical galaxies, were recognized as lenticular disk galaxies many decades ago (e.g., Liller 1966 and Vorontsov-Vel’Yaminov & Arkhipova’s 1962–1968 “Morphological catalogue of galaxies”). Consequently, a single Sérsic model (shown by the left-most panels in Figure 3) does not provide an optimal description of NGC 1277’s light profile, and this is evident by the high amplitude of the residual profile. The addition of an exponential disk component (second column) improves the fit, but the residuals are still affected by the previously identified structure peaking at along the major-axis (and at along the equivalent-axis) of the ellipticity profile (Figure 2). While this is likely to be an inner disk — a feature that is common in galaxies (e.g. Rest et al. 2001; Böker et al. 2002; Balcells et al. 2007; Seth et al. 2008; Graham et al. 2012) — when fitting the major-axis light profile, we found that the best description of this component is obtained with a Gaussian ring model (third column). This is perhaps not unexpected given the obvious dust ring (with a major-axis near 0.7, and a width of )777The dust ring peaks along the minor axis at .. Adding a central point source, represented by the HST PSF and shown in the fourth column of Figure 3), provides a better fit although we note that this is probably not an AGN (Fabian et al. 2013). Along the major-axis, the Gaussian ring model peaks at and has a FWHM width of .
This combination of a point-source and a ring, rather than a single exponential model for an inner disk, is likely due to the ring of dust embedded in the suspected inner disk. The mask that we used to exclude the dusty region was already at a maximum; expanding it further resulted in an insufficient amount of image for the task ellipse, and thus it crashed and failed to produce a light-profile when the mask was extended. Along the equivalent-axis, the peak of the dust ring is closer to the center, and the peak of our Gaussian ring model when fit to the equivalent-axis light-profile is at ; that is, the Gaussian ring has reduced to a normal Gaussian, which in this instance has a FWHM equal to (see the lower right panels of Figure 3). Together, these two components (a point source plus a PSF-convolved, extended Gaussian centered at ) combine to approximate the inner disk. It turns out that this disk is clearly revealed in the kinematic map shown in Section 4, in addition to the ellipticity profile shown in Figure 2. Table 1 provides a summary of the best-fitting parameters for each component fit to the galaxy. Again, we did not use a signal-to-noise weighted fitting scheme which would have heightened the sensitivity of the fit to the problematic dusty inner region and amplified any PSF mismatch, thereby driving the fit away from the true solution. To mitigate against these concerns, an equal weighting was placed on the data shown in Figure 3, as is commonly done when modelling galaxy surface brightness profiles.
In place of the ring model, we tested the use of an inner exponential component, and alternatively an inner Sérsic component (because nearly edge-on disks are better described by a Sérsic model with index less than 1, e.g. Pastrav et al. 2013a,b), but the solution was unsatisfactory and the data favoured the ring model. Integrating the flux of the ring model fit to the equivalent-axis light profile data (which is simply a Gaussian in this instance) gives an observed apparent magnitude of 16.76 mag (AB mag, F550M). Accounting for of Galactic extinction (Schlafly & Finkbeiner 2011, via the NASA/IPAC Extragalactic Database (NED)888http://nedwww.ipac.caltech.edu), gives a corrected apparent magnitude of 16.31 mag (AB system). We have not attempted any evolutionary nor -correction. At a ‘luminosity distance’ of 75 Mpc, and using (see section 5 and Martín-Navarro et al. 2015a), this equates to a stellar mass of 1.67. Given the lack of a significant AGN in this galaxy (Fabian et al. 2013), and given that the central point source flux equates to a stellar mass of (see Table 1), the central point source is too large to be a spheroidal star cluster (e.g. Scott & Graham 2013) and is therefore most likely part of the inner disk. Adding this flux to the ‘Gaussian ring’ gives a combined mass of 1.8.
This is a massive inner disk (an order of magnitude greater than the smaller-scale nuclear disks reported in Balcells et al. 2007 and Scott & Graham 2013). It may therefore be expected to have a large rotation. An interesting, alternative, hypothesis is that this feature may instead be a bar seen close to end-on (Emsellem 2013). If this was the case, then the inclination of the intermediate-scale disk (within which this bar must reside) as determined from the geometry of the dust (presumably now in the bar), which is not circular when seen face-on, could be too low. Although, one might expect a disk which is closer to edge-on in NGC 1277 to be more apparent at intermediate radii because of the brightening of its surface brightness (in the absence of dust) as the apparent axis-ratio goes from 1 to 0 (e.g., Graham 2001). In the following subsection we perform a 2D image analysis to better measure the axis-ratio of the intermediate-scale disk and thereby check for a disk more inclined than 74 degrees.
The total F550M galaxy magnitude is . Correcting for Galactic dust, this brightens to 13.04 mag, and the (Galactic dust)-corrected bulge magnitude is 13.29 mag (AB, F550M). NGC 1277 has a classical bulge with a Sérsic index that accounts for 79.4% of the total galaxy light. The intermediate-scale disk’s contribution is 15.2%, while the inner ring / inner disk component makes up %. The percentage by mass is slightly different based on the stellar mass-to-light ratios used for each component (Table 1).
| Component | size | Sérsic | mag | Mass | ||
| [ / kpc] | [mag arcsec-2] | index | [mag] | [] | [] | |
| NGC 1277 | … | … | … | 13.04 | … | 3.00 |
| Spheroid | ||||||
| 6.0 / 2.12 | 20.73 | 5.34 | 13.29 | 11.65 | 2.69 | |
| Int.-scale disk | ||||||
| 4.1 / 1.45 | 19.28 | 1.0 | 15.09 | 3.00 | 1.32 | |
| Nucleus | … | |||||
| 0.13 / 0.046 | 17.47 | … | 19.21 | 11.65 | 1.15 | |
| width | Mag | Mass | ||||
| / kpc | [mag arcsec-2] | / kpc | [mag] | [] | [] | |
| Inner ring | 0.9 / 0.32 | 18.84 | 1.1 (0.39) | 16.31 | 11.65 | 1.67 |
Best-fitting (major-axis) structural parameters from the upper right panel of Fig. 3. The spheroidal component has been fit with a Sérsic model, the intermediate-scale disk with an exponential model of scale-length , and the inner disk with the combination of an ‘inner ring’ (a Gaussian function centred at ) plus the HST point spread function for its nucleus. The observed dust ring effectively broke the inner disk into two components. The (uncorrected) surface brightnesses are in units of F550M mag arcsec-2. The apparent magnitudes (which have been corrected for Galactic extinction) also relate to the same narrow -band F550M filter. Note that these magnitudes were calculated using the best-fitting model components to the equivalent-axis light profile (lower right panel of Fig. 3) and integrating to while assuming circular symmetry. The stellar mass-to-light ratios are explained in subsection 5. The masses are in units of solar masses and were obtained using a distance modulus of 34.38 mag and mag (Cox 2000).
Given that galaxy disks typically have fixed ellipticity, reflecting their inclination to our line of sight, the peak in the ellipticity profile at along the major-axis (Figure 2) can be interpreted in the following way. Going from the galaxy centre to the outskirts, the disk light becomes increasingly important relative to the spheroid’s light, reaching its maximum at . Beyond , the contribution from the disk light starts declining more rapidly than the spheroid light (e.g. Liller 1966). This suggests a somewhat embedded, intermediate-size stellar disk for NGC 1277 (see Savorgnan & Graham 2015c for other examples). This explanation is also in accord with the results from the model fitting seen in Figure 3. In passing we note that after a careful test, we ruled out the possibility that the decline in the ellipticity profile beyond is caused by contaminating light from the (masked) neighboring galaxies. The peak ellipticity () at 10 of 0.54 gives a minimum inclination, from face-on, of 63 degrees. This is a lower limit because this ellipticity is still somewhat diluted by the flux from the spheroidal component of this galaxy. Following van den Bosch et al. (2012), they suggested that the inner dust disk, with its observed axis ratio of 0.3, may in fact be circular and reside in the plane of the larger stellar disk, which they subsequently took to have an inclination of 75 degrees. Based on the ellipticity of the dust ring, and assuming that it would appear circular when seen face-on, we too derive an inclination of 742 degrees for the inner disk within which the dust ring is embedded.
2.2. 2D modelling
Fitting a two-dimensional (2D) model to the image was performed with the code Imfit (Erwin 2015)999http://www.mpe.mpg.de/~erwin/code/imfit/, the previously created mask, and a Tiny Tim PSF (Krist 1995). The optimal model was found to consist of a Sérsic-spheroid, an intermediate-scale exponential disk, plus a centrally-located Gaussian (equivalent to a Sérsic model with an index ) for the suspected inner disk. This is consistent with our fit to the equivalent-axis light profile discussed earlier. The innermost data point was masked in our 2D modelling and no central point-source was required. As before, we were not able to obtain a satisfying fit using an exponential model for the inner disk (identified as such from the kinematics, see later), however it is common for (nearly) edge-on disks to be well described by a Sérsic model with an index less than 1 (e.g., Pastrav et al. 2013a,b).
Due to the non-symmetrical appearance of the dust in the inclined inner disk, and the slightly differing nature of the light profiles along the major- and equivalent-axis, our 2D model is not our preferred fit. Due to the symmetrical components that we used in Imfit, as is commonly employed in other 2D codes, we could not provide a perfect solution along every radial direction. Our 2D model and residuals can be seen in Figure 4. This decomposition resulted in an observed (i.e. not extinction nor dimming corrected) spheroid magnitude equal to 14.28 mag (60% of the total light), an intermediate-scale exponential disk with an axis-ratio of 0.35 and a magnitude equal to 14.93 mag (33% of the total light), and an inner inclined disk with a Gaussian magnitude equal to 16.61 mag (7% of the total light), amounting to a total observed magnitude of 13.73 mag in the F550M (narrow -band) filter, or 13.28 mag once Galactic extinction corrected. The axis ratio of the intermediate-scale disk corresponds to an inclination of 70∘, in good agreement with the result obtained from the geometry of the dust ring reported at the end of the previous subsection. This disfavours the idea of an end-on bar in a more inclined disk.


2.3. Color profile
Due to the availability of an archived F625W (SDSS r) image, obtained from the same HST Proposal Id. 10546 as the F550M image, it was possible to construct a color profile for NGC 1277101010We do not use the F625W image as our primary image because the guide star acquisition failed on this exposure, which was also significantly shorter (1654 s) than planned and shorter than the F550M exposure (2439 s).. After checking the alignment of this image with the F550M image, we ran IRAF’s task ellipse on the F625W image in no-fit, photometry-only mode111111In this mode, the fitting algorithm is disabled and the task simply extracts photometry information from the image.. In this way, the F625W surface brightness profile was extracted along the same ellipse geometry as the F550M image. Due to the different PSF in these two images, we do not pay attention to the inner 2FWHM as given by the F625W image. Unfortunately, but not surprisingly, the closeness of the two filters does not provide much useful information. The color profile shown in Fig. 5 is largely consistent with no radial variation of the stellar population (at least beyond the inner ). The range of uncertainty shown in Fig. 5 by the dotted lines were derived by simultaneously adding and subtracting the 1 uncertainty in the sky-background of each image. The slight bump seen in the light profile from 0.4 to 1.5 arcseconds is likely due to the dust lane, although we do note that the spheroid light contributes more than the intermediate-scale disk light over this radial range.
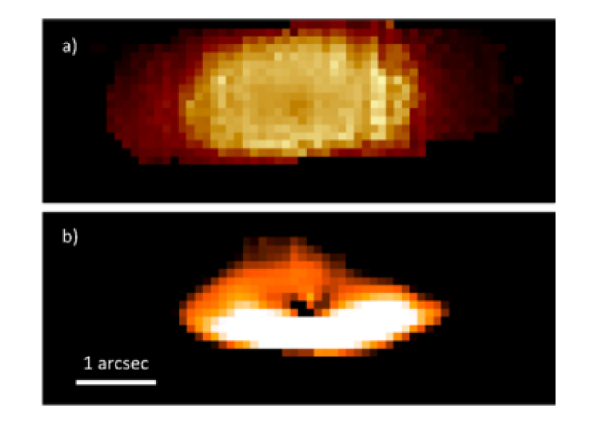
Using a higher spatial-resolution, 2.2 micron image of just the inner few arcseconds, obtained with the osiris integral field unit on Keck I while using the laser guide starm adaptive optics (see Section 4), the F550M colour reddens by more than 0.2 mag between and along the major-axis, and peaks at 0.3 mag redder at 1. We have used this colour image to display the dust ring in Figure 6.

3. Expected black hole mass
There are now a battery of scaling relations that can be used to predict the masses of black holes at the centers of galaxies. From our decomposition of the galaxy light, and measurement of the spheroid’s stellar mass and central concentration of stars, we can obtain two estimates of the expected black hole mass. From the velocity dispersion of the bulge, after avoiding biases from the rotational kinematics of the inner disk, we can acquire a third estimate.
| Scaling relation | Value | Expected |
|---|---|---|
| [] | ||
| km s-1 | ||
| km s-1 |
Obtained using the Sérsic – relation from Savorgnan et al. (2013), the – relation from Savorgnan et al. (2015) for early-type galaxies, and the – relation from Savorgnan & Graham (2015a) for non-barred galaxies. The uncertainties on the black hole mass incorporate the uncertainties on the slope and zero-point of the scaling relation, the intrinsic scatter in the relation, and the uncertainty in the value used to derive the expected black hole mass. See section 3 for details and the use of older relations.
From our preferred 1D galaxy decomposition, and using the – relation for “Sérsic bulges” (i.e. those without depleted cores) from Savorgnan et al. (2013, their Figure 4a and Table 4), the expected black hole mass121212See Graham & Driver (2007) for the derivation of the uncertainty on the black hole mass, obtained here assuming an intrinsic scatter of 0.31 dex in the relation., given a Sérsic index of 5.34 and assuming a 20% uncertainty on , is , i.e. the optimal mass is .
Using the latest – relation for bright early-type galaxies from Savorgnan et al. (2015), which has a slope of 1.040.10, and using , the expected black hole mass131313The uncertainty on the black hole mass given here assumes a spheroid mass uncertainty of 50% and an intrinsic scatter of 0.42 dex in the direction of the relation. is such that , giving an optimal mass of . While the above black hole mass is our preferred estimate when using the spheroid’s stellar mass — due to the low level of scatter in the black hole direction about this – relation, and also due to the small uncertainty on the slope — for completeness we additionally report on the expected black hole mass obtained when using the – relation for Sérsic galaxies. The relation in Savorgnan et al. (2015) gives . Their Sérsic – relation has a slope of 1.480.20, which is smaller than the slope of 2.220.58 from the relation in Scott et al. (2013) which predicts a black hole mass that is an order of magnitude larger: . Perhaps coincidentally, this value is in fair agreement with the black hole mass of first reported by van den Bosch et al. (2012). However given the larger uncertainty on the slope of the Sérsic – relation, this is not our preferred estimate.
Using the – relation for non-barred galaxies from Graham & Scott (2013, their Table 3) and assuming (quoted from van den Bosch et al. 2012 outside the central – their FWHM), the expected black hole mass141414The uncertainties given here on the (–)-derived black hole masses are based on an assumed 10% uncertainty on the velocity dispersion, and 0.3 dex of intrinsic scatter in the direction about the – relation. is . Using the – relation for early-type galaxies from McConnell & Ma (2013) gives , while using the – relation for non-barred galaxies from Savorgnan & Graham (2015a) gives Repeating these estimations with km s-1 (see the observed velocity dispersion map presented later) gives , , and , respectively.
For ease of reference, our preferred black hole mass estimates are presented in Table 2.
As detailed by Merritt & Ferrarese (2001, see also Peebles 1972), the black hole’s sphere-of-influence can be regarded as the region of space where its gravity dominates over that of other matter. Using km s-1, a black hole mass of will have a sphere-of-influence radius pc = 109 pc 0.31 arcsec, assuming a scale of 352 parsec per arcsecond. One obtains when using km s-1 and . These small values of are consistent with Emsellem (2013) who reported that there is no evidence of a black hole beyond 1.6, i.e. the FWHM of the PSF in the van den Bosch et al. (2012) kinematic data.
4. Kinematic Data and Reduction
The kinematic observations of NGC 1277 were taken with the OH Suppressing InfraRed Imaging Spectrograph osiris (Larkin et al. 2006) with the Keck I Laser Guide Star Adaptive Optics (LGSAO) system (van Dam et al. 2006; Wizinowich et al. 2006). osiris is a lenslet array, integral field unit spectrograph with a 20482048 Hawaii-2 detector. The spectral resolution in the -band (2.2 m) with a 0.1 arcsec plate scale is about 3000, though this varies somewhat across the field. We performed observations of this object on the Hawaiian nights 23 and 24 November, 2013. After a 60 second exposure for target acquisition, each science data set consists of two 900-second object frames, with an intervening 900-second sky frame in the standard object-sky-object sequence. In all observations, the 0.100 arcsec per pixel plate scale was used; at an ‘angular distance’ of 72.5 Mpc, this gives a scale of 35.2 pc per pixel (352 pc per arcsec). We acquired 6 data sets on November 23rd and 3 on November 24th, for a total of 4.5 hours on target, using the Kbb filter, which has a central wavelength of 2180 nm and a bandwidth of 440 nm. The spectrometer was set at a position angle of 90o, roughly aligned with the long axis of the galaxy. In all observations, we used the laser guide star for the adaptive optics, using the bright galaxy core as the tip-tilt guide star.
The observations were reduced as follows:
-
1.
Each object frame was reduced using the standard osiris data reduction pipeline (DRP)151515osiris Users Manual, Larkin et al., 2010, www2.keck.hawaii.edu/inst/osiris/OSIRIS_Manual_v2.3.pdf version 3.2, with the associated sky frames used for background extraction. The DRP uses “Rectification Matrices” which incorporate all the flat fielding, bias and dark frames in one, along with mapping each pixel to a lenslet/spectral element. These matrices are retrieved from the Keck repository; for our data, these were dated 6 June 2014.
-
2.
After basic data reduction, the resulting data cube spectra still showed OH skylines, as the sky background was rapidly changing. The ‘Scaled Sky Subtract’ DRP module (Davies 2007) was used to suppress these skylines; we measured dark frames on each night for this purpose.
-
3.
The resulting data cubes have a field of view of 1.96.4 arcsec (1964 pixels), with an extracted spectral range of 1965 nm to 2381 nm at a spectral resolution of 0.25 nm. The values produced are in Analog-to-Digital Unit (ADU) sec-1. Post data reduction, the FITS file imager and manipulating package QFITSVIEW161616©Thomas Ott 2011:
www.mpe.mpg.de/~ott/QFitsView/index.html with the underlying DPUSER language was used for analysis. The FITS files contain the primary data cube, with variance and data quality extensions. The FITS header WCS coordinate system was corrected to fix a known orientation issue. One of the data cubes had values and an image shape that was very dissimilar to the other 17 frames due to an unknown cause, so was discarded from the rest of the analysis. This problem was present in the original raw frame data, so it was not a problem generated by the DRP. -
4.
Telluric correction was applied using observations on the A0 star HIP16652 before and after each target visit, on both nights. These observations were also reduced by the DRP. The telluric spectrum is obtained by extracting the spectrum of the star; an aperture of about 5 pixels is used to acquire the total star light. Since hydrogen absorption lines dominate A0 star spectra, the strong Br line was removed from the spectrum by fitting a Gaussian to the line profile. The resulting spectrum was divided by a blackbody curve at 9480 K, then normalized. The resulting spectrum showed strong broad absorption features in the 1990 to 2080 nm range, with a secondary narrower absorption feature at 2317 nm. This spectrum is divided into the data cube of the galaxy at each spatial element to produce the corrected data cube.
-
5.
The telluric corrected data cubes were mosaicked by finding the centroid of the 2D image created by summing along the spatial axis. On each night, the shift between successive frames in an observation block was usually less than one pixel; from the first to second night the shift was of the order of 4 pixels. The cubes were shifted by integral pixel numbers in each spatial axis as required (sub-pixel shifts were not used, as they can produce interpolation issues). The final data cube is the averaged sum of the 17 individual registered data cubes.
-
6.
The DRP produces errant spikes and geometric data artifacts, which exhibit large data number transients (both positive and negative) for a single spatial and spectral element. These are identified as “dead” pixels and interpolated over using the QFITSVIEW functions dpixcreate and dpixapply on the spectrum at each spatial point. This cleaning was also applied to the telluric spectra before they were used.
-
7.
We observed the following template stars (with spectral class noted), which were reduced and telluric corrected in the same manner as before, with the stellar spectrum extracted from the cleaned data cube; HD275038 (G5), HD275051 (K5), HD275052 (G5), HD275240 (M0), HD275246 (K5), HD275251 (G5) , HD275337 (M0), HD275342 (K5) and HD275361 (M0). Each star was observed each night.
4.1. Measurement of Stellar Kinematics
The stellar kinematics were extracted from the osiris data cube using the
penalized Pixel Fitting (pPXF) software171717Available from:
http://www-astro.physics.ox.ac.uk/~mxc/software/#ppxf of
Cappellari & Emsellem (2004). This
technique constructs an optimal spectral template from a library of input
spectra, then convolves this optimal template with a line-of-sight velocity
distribution (LOSVD) to match the entire observed spectrum. This process is
iterated until the best-matching combination of weighted template spectra and
LOSVD is determined.
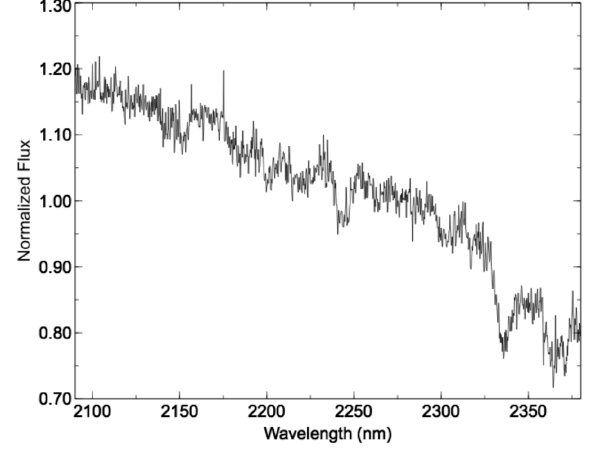
Although we observed template stars, the LOSVD map was found to be much more regular, and with smaller formal uncertainties on all kinematic moments, when using the Gemini spectral library of near-infrared late-type stellar templates (Winge et al. 2009), which consists of 60 late-type stars observed with either the GNIRS or NIFS instruments on the Gemini North telescope181818The template mismatch due to our small number of observed stars appears to be a much larger contribution to the uncertainty than any mismatch between the resolution or flux calibration of the library templates and the galaxy observation.. This library is particularly suited to extracting stellar kinematics from the CO band head features in the K-band. All template spectra were smoothed to the osiris spectral resolution, , as determined from off-target observations of narrow night OH sky lines ( FWHM (Rousselot et al. 2000).
Initially we determined an optimal stellar template from a high signal-to-noise () spectrum constructed by binning all spaxels within the central 1 of the osiris data cube. We included a fourth-order multiplicative polynomial in the fit to account for residual flux calibration errors. We fit a LOSVD parameterized as a fourth-order Gauss-Hermite polynomial, with the terms corresponding to the mean line-of-sight stellar velocity, , mean line-of-sight stellar velocity dispersion, , and the third and fourth order Gauss-Hermite parameters and , respectively. The fit was penalized with a penalty , following Cappellari et al. (2011, their fig. 10), to appropriately bias the values of and towards zero in spatial regions where the or do not allow us to constrain the higher-order shape of the LOSVD. In addition, we made use of the CLEAN algorithm (for details see Cappellari et al., 2002), which iteratively removes pixels deviating more than 3 from the template fit, repeating the process with the new set of good pixels until no further bad pixels are identified. The number of pixels identified as bad in this way is small relative to the length of the spectrum, and such pixels are generally residual cosmic rays, emission, or artifacts on the CCD that were not removed by earlier stages of the data reduction. This high central spectrum is shown in Figure 7.
We then determined the spatially resolved stellar kinematics of the central regions of NGC 1277 by fixing this optimal template and convolving with a LOSVD for each spaxel. We performed this both on individual spaxels (with ratio in the range 1–40) and on adaptively binned spaxels (using the Voronoi technique of Cappellari & Copin 2003), binned to a minimum of 40. For both the binned and unbinned data, the resulting maps of stellar velocity and velocity dispersion are entirely consistent, with the adaptively binned data showing significantly less scatter in the outer parts of the field-of-view as expected.
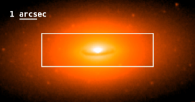
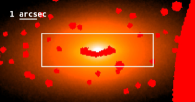
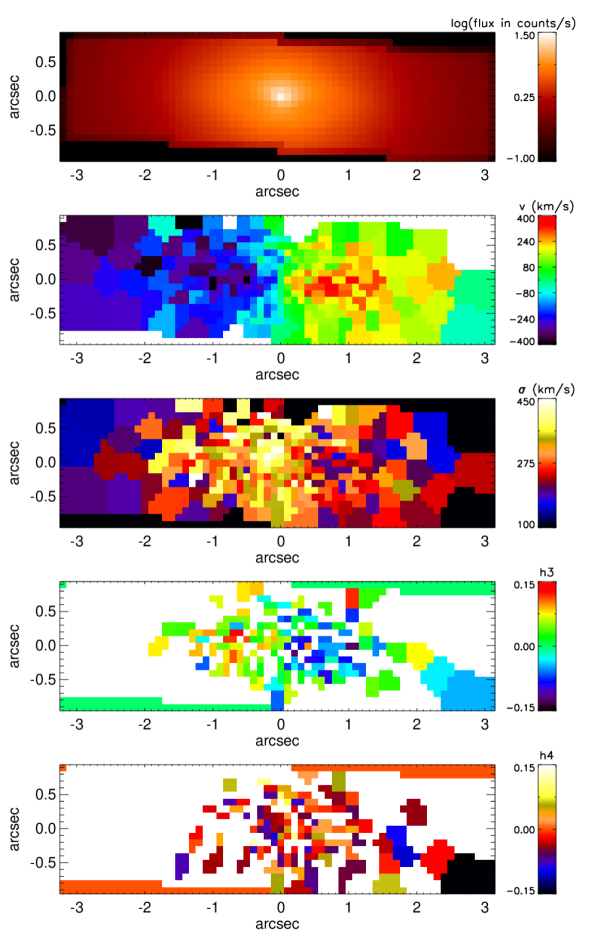
In Figure 8 we present the HST F550M image scaled to the same size as the osiris data, and show the details of the mask used to exclude the effects of the inner dust disk. In the upper panels of Figure 9 we show the osiris flux map, along with the stellar radial velocity and velocity dispersion field in the central arcsec ( pc) of NGC 1277. The most striking feature in this kinematic map is the steep velocity gradient seen along the major-axis, which corresponds to the rotation of the nearly edge-on, inner disk seen over the same radial extent in the photometric decomposition (Figure 3). The lower two panels in Figure 9 show the and maps. The anti-correlation of with provides further evidence that there is an embedded disk in NGC 1277, rather than a bar which would result in being correlated with (see Bureau & Athanassoula 2005). Furthermore, if there was a bar (other than an end-on bar), the distribution of values would be negative rather than scattered around zero as observed. The spaxels with larger errors in and generally coincide with regions of lower , where the instrumental resolution has a greater impact on our ability to determine the LOSVD. We note that the JAM model used in the following section to determine the central black hole mass does not use either the or parameters.
In the two neighboring spaxels on either side of the spaxel associated with the kinematical centre of the galaxy (Figure 9, second panel), the luminosity-weighted velocity changes from about km s-1 to about km s-1. There is thus a large degree of rotational shear in the central spaxels, elevating their velocity dispersion. Indeed, in going from the mid-point of the above mentioned spaxels, there is a velocity range of 400 km s-1 across two spaxels (0.2 arcseconds, 70 parsec). With the 1.6 (563 parsec) spatial resolution available to van den Bosch et al. (2012), they were largely oblivious to this massive rotational motion boosting the velocity dispersion in their central resolution element. Around the inclined inner disk, the velocity dispersion of the spheroid is 275 km s-1 or less in many bins. We have therefore used a rounded value of 300 km s-1, in addition to the value of 333 km s-1 (van den Bosch et al. 2012), but the true value may be lower.
5. Measurement of the black hole mass
In this section we attempt to investigate if the new kinematic data might provide a black hole mass consistent with previous estimates. Following Emsellem (2013), we used a Multi-Gaussian photometric Expansions (MGE: Monnet et al. 1992) and the Jeans Anisotropic MGE (JAM) modeling routine (Emsellem et al. 1994; Cappellari 2008) to derive the black hole mass.
For JAM modeling, one needs to estimate the spatial point-spread function (PSF) of the kinematic data. The PSF influences how much the black hole’s kinematic effect is smeared out and could have a significant effect on the resulting measured mass. In the simplest sense, PSFs from adaptive optics observations can be split into two Gaussians: one has a width set by the natural seeing disk while a second has a width set by the diffraction-limited core. The quality of the Adaptive Optics (AO) correction sets the flux ratio between these two Gaussians. Using this framework we approximate our PSF as the sum of two 2-dimensional Gaussians, which are also readily compatible with MGE and JAM models. Because our data consist of frames summed from two different nights, we employ four Gaussian components: one pair of seeing-limited and diffraction-limited for each night (normalized by exposure time, 2:1)191919With twice as much data obtained on the first night than was obtained on the second night, the lower of the second night’s data (which had the better natural seeing) did not warrant using this data alone.. The -band seeing limits were estimated using the archival MASS/DIMM information from the Maunakea Weather Center website202020http://mkwc.ifa.hawaii.edu/current/seeing/, which gave an average full-width at half maximum (FWHM)212121We took the average value from the Canada-France-Hawaii Telescope Weather Tower’s MASS and DIMM seeing measurements at 0.5 m (taken to be and on the first and second night) and multiplied by — to adjust for the wavelength dependence — to obtain the 2.2 m seeing. of 1.05 arcsec on 23 November 2013 and 0.37 arcsec on 24 November 2013. In both cases, the diffraction-limit is set by the FWHM of the inner Gaussian-like component of the Airy pattern, equal to 47 milli-arcseconds (derived from 1.03 /D, where is the observed wavelength 2.2 m and D is the telescope diameter of 10 meters)222222Although we used an osiris plate scale of lenslets, our complete forward modelling convolves the model with the true PSF and then ‘under samples’ the resulting model to compare with the observations.. The fraction of light in the diffraction-limited component (measured by the ‘Strehl ratio’) is allowed to vary. Typical performance of the Keck AO system suggests a Strehl ratio of 25%. Given that we do not have a precise way to measure this for our data, we allowed for a wide range of Strehl ratios from 10% to 40%, but this had a fairly small affect (15–20%) on our black hole mass.
The measured black hole mass of a system obviously depends on how much mass is attributed to stars in the central regions. As noted by Emsellem (2013), adequately masking out the region of the image which suffered too much extinction by the central dust ring is important so that the MGE model does not under predict the amount of light within the inner arcsecond. One should keep in mind that the dust in the disk does not simply obscure disk light but also the light from the stars in the spheroid on the far side of the dust disk. This is substantial when the Sérsic index is high and the spheroid’s stars are therefore considerably centrally concentrated. Comparing our photometrically uncalibrated osiris -band image (Figure 9a) to the photometrically calibrated optical HST image (Figure 8) gives a relative estimate of the dust extinction (see Section 2.3). We therefore began with the masked HST/ACS F550M image shown in Figures 1 and 8, and further masked out areas likely to be affected by dust. We could not mask the HST image this heavily in subsection 2.1 because it caused the IRAF task ellipse to fail. In that subsection we saw that the inner dust ring caused the inner disk to be split into a central nucleus plus an inner ring in our decomposition. However here we are able to mask slightly more heavily.
We used the MGE model to match the (unmasked) light distribution seen in the HST image (see Table 3), and allowed a spatially-constant mass-to-light ratio (M/L) to vary as a free parameter during the fitting process with the kinematic data. Yıldırım et al. (2015) report that there is evidence for negligible amounts of dark matter within the inner 3.6 kpc of NGC 1277, and thus we have not included a dark halo component.
The best-fitting , mass-to-light ratio, and orbital anisotropy parameter are given in Table 4. We ran Monte Carlo simulations, refitting the JAM model 100 times to the best-fitting vrms map with different noise added according to the measurement errors. The reported uncertainties were calculated from the range of black hole masses that encompassed 68% of the resulting fits. The close agreement between our model’s preferred ratio of 12.3 with the central () value of 11.65 from Martín-Navarro et al. (2015a) is supportive of this model’s black hole mass of . Fixing the Strehl ratio to 25% increased this mass to . Using the exact same MGE model from Emsellem (2013), based on his masking of the galaxy image, coupled with our new kinematic data, gave and . However using an MGE model built with the incomplete dust mask from Figure 8 resulted in a black hole mass of , dramatically emphasizing the point made by Emsellem (2013) regarding the dust. For reference, Emsellem (2013) reported an optimal black hole mass of and . Our best-fitting JAM model gives a total stellar mass of based on our input MGE model luminosity and the dynamical (=12.3) within the inner few arcseconds. This can be compared with the value of reported by Emsellem (2013) using . The MGE models, consisting of Gaussian profiles (i.e. Sérsic profiles with ) do not have the same extended envelopes as the high- light profiles observed out to large radii in massive early-type galaxies (Caon et al. 1993). Our MGE model flux is 43% less than that of the component analysis which found a spheroid with a Sérsic index of 5 and a total galaxy stellar mass of (Table 1).
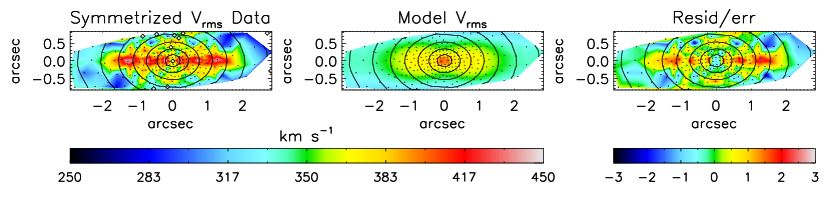
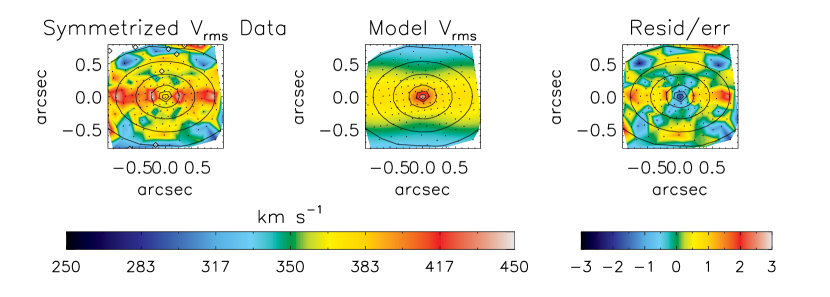
Our best fitting model and residual map is shown in the upper panels of Figure 10. The striking rod-shaped feature — which we fail to reproduce beyond the sphere-of-influence of the black hole — is due to the rapidly rotating disk seen in the second panel of Figure 9. Unfortunately our inability to model this inner disk casts doubt over the reliability of the derived black hole mass plotted in Figure 11 for comparison with other galaxies. We varied the PSF such that it had (i) a Strehl ratio of 100%, i.e. a FWHM of with no additional natural seeing component, and (ii) a natural seeing of and a Strehl ratio of 0%. We found that this had little effect on our ability to match the rod-shaped feature (left panel of Figure 10) and thus remove it from the residual map (right panel of Figure 10). NGC 821 is another galaxy with a nearly edge-on stellar disc for which the JAM modelling struggles to reproduce the strong rod-like feature seen in the image (Cappellari 2008, his Figure 5). This behaviour therefore appears to be symptomatic to the JAM model rather than specific to NGC 1277. We then reduced the ‘kinematic field-of-view’ used by the JAM model by including only the central of kinematic data. This was done to match the ‘kinematic field-of-view’ used by Walsh et al. (2015), but had no significant effect on our results, giving , , and a Strehl ratio of 40% (see Figure 10).
We conclude that the JAM model, as used by us, is challenged by the edge-on nature of the inner disk in NGC 1277, perhaps in a scenario analogous to the isophotal fitting problems faced by the IRAF routine ELLIPSE (Jedrzejewski 1987) which has recently been remedied using a Fourier series to describe perturbations from pure elliptical isophotes (Ciambur 2015). The non-elliptical contours of the image and/or the velocity dispersion map may partly be the source of the residual disk seen in Figure 10, but resolving this is beyond the scope of the present paper. We note that recent testing of the JAM model (Li et al. 2015) has not yet explored this issue. It may more simply be that we need to construct models with more massive, thin planar disks that can explain the high vrms extending out to 2. Due to this, we report a tentative black hole mass that we hope to refine in future work by better accounting for the elevated vrms beyond the sphere-of-influence of the black hole, due to the near edge-on disk. The bias that this introduces to our current work is in the sense that we may have over-estimated the black hole mass to account for some of the increased vrms which is due to the inner disk.
6. Discussion and Conclusions
We have used the kinematics, the ellipticity profile, the light profile, and the ‘fourth harmonic’ profile describing the deviation of the isophote contours from perfect ellipses, to obtain a physically-sound and consistent description of the structural components in NGC 1277. This was called for in Emsellem (2013). Contrary to the claim in van den Bosch et al. (2012) that “a classical bulge appears to be entirely absent” in NGC 1277 (because they obtained Sérsic indices less than 2 from their fitting of four galaxy components) — a claim they re-iterate in Yıldırım et al. (2015) — we find that NGC 1277 has a massive bulge with a major-axis Sérsic index of 5.34. This dominant spheroidal component accounts for 79% of the light and 90% of the mass in NGC 1277, weighing in at . This increase in the spheroidal component’s stellar mass, above the value of 0.29 from van den Bosch et al. (2012), is mostly due to the galaxy decomposition but is also because they used a -band mass-to-light ratio of 6 while we used 11.65. We find that the spheroidal component has a half light radius of 6, rather than 1 (van den Bosch et al. 2012), which may help to resolve the puzzle in Martín-Navarro et al. (2015a) as to why, at 1.5 (previously thought to be 1.5 ) the stellar ‘initial mass function’ (IMF) had not declined and was still bottom heavy at 1.5, in contrast to results beyond 1 in other high-mass galaxies (Martín-Navarro et al. 2015b; La Barbera et al. 2015). Of course, if the IMF of the spheroidal component of NGC 1277 is found to change at large radii, then the stellar mass-to-light ratio and the total stellar mass of the spheroid will change.
| q | ||
|---|---|---|
| pc-2 | [arcsec] | |
| 160183. | 0.0472 | 0.666 |
| 17367.3 | 0.2391 | 0.745 |
| 7196.26 | 0.6507 | 0.586 |
| 3014.67 | 1.3140 | 0.677 |
| 797.645 | 3.9523 | 0.392 |
| 129.483 | 11.0372 | 0.414 |
Column 1: Maximum central surface brightness for each two-dimensional (projected) Gaussian. Column (2) provides the associated width, and column (3) gives the axis ratio.
| Strehl | |||
| ratio | |||
| 12.3 | 0.03 | 40% |
The abstract of van den Bosch et al. (2012) refers to this galaxy as a compact lenticular galaxy with a total stellar mass in excess of . Trujillo et al. (2014) has similarly identified this galaxy as a likely descendant of the compact massive galaxies seen at , and several other likely descendants were previously identified in Dullo & Graham (2013). NGC 1277 may indeed have been a compact massive galaxy at which had, or has since acquired, an intermediate-sized stellar disk. The disk accretion scenario could explain the decreased stellar mass-to-light ratio as one transitions from the spheroid dominated inner region of the galaxy to the disk-dominated region at intermediate radii (Martín-Navarro et al. 2015a). One might therefore wonder that if the spheroid in NGC 1277 has not evolved, then perhaps the (black hole)-to-spheroid mass ratio has also not evolved. One may of course also wonder if NGC 1277 previously boasted a larger disk, which has since been eroded away in its Perseus cluster environment.
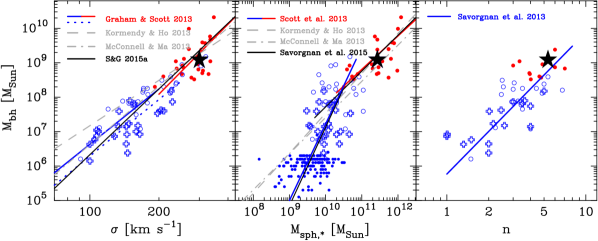
The observed mass-scaling between and the many properties of the host galaxy/spheroid (Hutchings et al. 1984; Dressler 1989; Yee 1992; Kormendy & Richstone 1995; Laor 1998; Magorrian et al. 1998; etc., see Graham 2015 for a historical review) is well known to suggest a fundamental connection between massive black holes and their host spheroids. Such observations also provide key input into theoretical investigations trying to determine the details of black hole and galaxy evolution (e.g., Ciotti & van Albada 2001; Adams et al. 2003; Heckman et al. 2004; Cattaneo et al. 2005; Cirasuolo et a. 2005; Fontanot et al. 2006, 2015; Robertson et al. 2006; Shankar et al. 2006, 2009; Treu et al. 2007; Ciotti 2008). For reference, Savorgnan et al. (2015) reveals that the mass ratios range from 0.1–5% in (non-dwarf) early-type galaxies. This places an important emphasis on any (black hole)-(host spheroid) system that appears to not conform with these relations, as the evolution of those systems may need a separate explanation (Ferré-Mateu et al. 2015).
Our AO-assisted Keck I osiris data suggests the presence of a black hole in NGC 1277 and , where these errors only consider random noise in the kinematic data and do not account for any systematic errors. This black hole mass may be an upper limit given the negative residual at the centre of Figure 10, however we need to further refine our analysis to better account for the rod-shaped feature seen beyond the black hole’s sphere-of-influence () in this residual map. Walsh et al. (2015) report a black hole mass of and (in agreement with the optimal solution in Emsellem 2013). From Figure 2 in Walsh et al., one can see that if then one would have , and at one has . That is, the degeneracy between the black hole mass and the stellar mass-to-light ratio can partly explain some of the differences between us and Walsh et al. (2015). Of course other differences exist, such as our problematic JAM modeling of the inner (radius) containing the edge-on disk versus their Schwarschild modeling of just the inner (radius). Coupled with the host spheroid mass, these two black hole masses (i.e. ours, and that from Emsellem et al. 2012 and Walsh et al. 2015) give a (black hole)-to-(host spheroid) mass ratio of 0.45 and 1.8 percent. We therefore conclude that NGC 1277 does not host an over-massive black hole. This downward revision of this ratio for NGC 1277 may not bode well for recent papers claiming NGC 1277 as a potential prototype in support of the direct collapse of massive black holes (e.g. Bonoli et al. 2014; Tanaka & Li 2014).
NGC 4342 is another lenticular galaxy without a partially-depleted core and with an allegedly over-massive black hole (Cretton & van den Bosch 1999) — weighing in at nearly 7 per cent of the bulge mass (Bogdán et al. 2012b). While Blom et al. (2014) reveals that some of this galaxy has been stripped away by its neighbour, which would raise the mass ratio, and Valluri et al. (2004) highlight concerns with its estimated black hole mass, of additional relevance is the presence of an inner stellar disk in this galaxy (van den Bosch, Jaffe, & van der Marel 1998). This galaxy has a strong central rotation reaching 200 km s-1 by r=0.25 arcseconds. Furthermore, like NGC 1277, this galaxy (along with NGC 4570) was noted by van den Bosch et al. (1998) to be somewhat intermediate between an elliptical and a lenticular galaxy. In addition, NGC 4342 has an old age of around 8 Gyr (van den Bosch et al. 1998), and both NGC 4342 and NGC 1277 additionally display minimal central X-ray emission (Bogdán et al. 2012a; Fabian et al. 2013). Given this large number of similarities, see also Emsellem et al. (2013) in regard to the kinematic similarity, we speculate that rotational velocity shear (primarily due to the self-gravity of the inner disk rather than a black hole) or non-elliptical contours arising from the nearly edge-on disk, may have increased the derived black hole mass in NGC 4342. Indeed, Valluri et al. (2004) highlighted that past data supporting such a large, and indeed any, black hole in NGC 4342 was questionable.
There are yet other galaxies with inner disks that may also be worth further investigation. For example, the nuclear disk (plus central star cluster) in NGC 7457 (Balcells et al. 2007) similarly casts doubts over this galaxy’s black hole mass (Gebhardt et al. 2003; Schulze & Gebhardt 2011). The nuclear disk in NGC 4486B (Lauer et al. 1996; Guérou et al. 2015, see their Figure 2) may have similarly contributed to the reportedly high mass ratio of 9% (Kormendy et al. 1997) in this galaxy. Higher spatial resolution spectroscopic data than HST can provide may be required to resolve this issue in these relatively small, low-luminosity galaxies. The upcoming, extremely large ground-based telescopes will be key players in this regard (e.g. Do et al. 2014). Refinements to the Jeans Anisotropic MGE (JAM) modeling routine is also expected to be helpful and will be presented in a forth-coming paper. Nonetheless, we report that the spheroid mass in NGC 1277 is nearly an order of magnitude greater than previously realized, and its black hole mass appears to be an order of magnitude smaller after better resolving the rapidly rotating, edge-on inner disk. This dramatically reduces the mass ratio in NGC 1277.
References
- Adams et al. (2003) Adams, F. C., Graff, D. S., Mbonye, M., & Richstone, D. O. 2003, ApJ, 591, 125
- Balcells et al. (2007) Balcells, M., Graham, A. W., & Peletier, R. F. 2007, ApJ, 665, 1084
- Blom et al. (2014) Blom, C., Forbes, D. A., Foster, C., Romanowsky, A. J., & Brodie, J. P. 2014, MNRAS, 439, 2420
- Bogdán et al. (2012a) Bogdán, Á., Forman, W. R., Kraft, R. P., et al. 2012a, ApJ, 755, 25
- Bogdán et al. (2012b) Bogdán, Á., Forman, W. R., Zhuravleva, I., et al. 2012b, ApJ, 753, 140
- Böker et al. (2002) Böker, T., Laine, S., van der Marel, R. P., et al. 2002, AJ, 123, 1389
- Bonoli et al. (2014) Bonoli, S., Mayer, L., & Callegari, S. 2014, MNRAS, 437, 1576
- Bureau & Athanassoula (2005) Bureau, M., & Athanassoula, E. 2005, ApJ, 626, 159
- Canning et al. (2010) Canning, R. E. A., Fabian, A. C., Johnstone, R. M., et al. 2010, MNRAS, 405, 115
- Caon et al. (1993) Caon, N., Capaccioli, M., & D’Onofrio, M. 1993, MNRAS, 265, 1013
- Cappellari (2008) Cappellari, M. 2008, MNRAS, 390, 71
- Cappellari & Copin (2003) Cappellari, M., & Copin, Y., 2003, MNRAS, 342, 345
- Cappellari & Emsellem (2004) Cappellari, M. & Emsellem, E. 2004, PASP, 116, 138
- Cappellari et al. (2002) Cappellari, M., Verolme, E. K., van der Marel, R. P., et al. 2002, ApJ, 578, 787
- Cappellari et al. (2011) Cappellari, M., Emsellem, E., Krajnović, D., et al. 2011, MNRAS, 413, 813
- Cappellari et al. (2013) Cappellari, M., Scott, N., Alatalo, K., et al. 2013, MNRAS, 432, 1709
- Carter (1978) Carter, D. 1978, MNRAS, 182, 797
- Cattaneo et al. (2005) Cattaneo, A., Blaizot, J., Devriendt, J., & Guiderdoni, B. 2005, MNRAS, 364, 407
- Ciambur (2015) Ciambur, B.C. 2015, ApJ, 810, 120
- Ciotti (2008) Ciotti, L. 2008, La Rivista del Nuovo Cimento (arXiv:0808.1349)
- Ciotti & van Albada (2001) Ciotti, L., & van Albada, T. S. 2001, ApJ, 552, L13
- Cirasuolo et al. (2005) Cirasuolo, M., Shankar, F., Granato, G.L., De Zotti, G., Danese, L. 2005, ApJ, 629, 816
- Combes (2014) Combes, F. 2014, Astronomical Society of the Pacific Conference Series, 480, 211
- Cox (2000) Cox, D.P. 2000, Allen’s Astrophysical quantities, New York: AIP Press; Springer
- Cretton & van den Bosch (1999) Cretton, N., & van den Bosch, F. C. 1999, ApJ, 514, 704
- Davies (2007) Davies, R.I. 2007, MNRAS, 375, 1099
- Do et al. (2014) Do, T., Wright, S. A., Barth, A. J., et al. 2014, AJ, 147, 93
- Dressler (1989) Dressler, A. 1989, Active Galactic Nuclei, IAU Symp. 134, 217
- Driver et al. (2013) Driver, S. P., Robotham, A. S. G., Bland-Hawthorn, J., et al. 2013, MNRAS, 430, 2622
- Dullo & Graham (2013) Dullo, B. T., & Graham, A. W. 2013, ApJ, 768, 36
- Emsellem (2013) Emsellem, E. 2013, MNRAS, 433, 1862
- Emsellem et al. (1994) Emsellem E., Monnet G., Bacon R. 1994, A&A, 285, 723
- Erwin (2015) Erwin, P. 2015, ApJ, 799, 226
- Fabian et al. (2013) Fabian, A. C., Sanders, J. S., Haehnelt, M., Rees, M. J., & Miller, J. M. 2013, MNRAS, 431, L38
- Falco et al. (1999) Falco, E. E., Kurtz, M. J., Geller, M. J., et al. 1999, PASP, 111, 438
- Ferré-Mateu et al. (2015) Ferré-Mateu, A., Mezcua, M., Trujillo, I., Balcells, M., van den Bosch, R.C.E. 2015, ApJ, 808, 79
- Fontanot et al. (2006) Fontanot, F., Monaco, P., Cristiani, S., & Tozzi, P. 2006, MNRAS, 373, 1173
- Fontanot et al. (2015) ontanot, F., Monaco, P., & Shankar, F. 2015, MNRAS, submitted
- Ford et al. (1998) Ford, H. C., Bartko, F., Bely, P. Y., et al. 1998, Proc. SPIE, 3356, 234
- Gebhardt et al. (2003) Gebhardt, K., Richstone, D., Tremaine, S., et al. 2003, ApJ, 583, 92
- Graham (2001) Graham, A. W. 2001, MNRAS, 326, 543
- Graham (2013) Graham, 2013, in “Planets, Stars and Stellar Systems”, Volume 6, p.91-140, T.D.Oswalt & W.C.Keel (Eds.), Springer Publishing (arXiv:1108.0997)
- Graham (2015) raham, A.W. 2015, in “Galactic Bulges”, E. Laurikainen, R.F. Peletier, D. Gadotti (Eds.), Springer International Publishing, Astrophysics and Space Science Library, 418, 263 (arXiv:1501.02937)
- Graham & Driver (2007) Graham, A. W., & Driver, S. P. 2007, ApJ, 655, 77
- Graham et al. (2015) Graham, A. W., Dullo, B. T., & Savorgnan, G. A. D. 2015, ApJ, 804, 32
- Graham et al. (2011) Graham, A. W., Onken, C. A., Athanassoula, E., & Combes, F. 2011, MNRAS, 412, 2211
- Graham & Scott (2013) Graham, A. W., & Scott, N. 2013, ApJ, 764, 151
- Graham et al. (2012) Graham, A. W., Spitler, L. R., Forbes, D. A., et al. 2012, ApJ, 750, 121
- Green et al. (2014) Green, A. W., Glazebrook, K., McGregor, P. J., et al. 2014, MNRAS, 437, 1070
- Guérou et al. (2015) Guérou, A., Emsellem, E., McDermid, R.M., et al. 2015, ApJ, 804, 70
- Heckman et al. (2004) Heckman, T. M., Kauffmann, G., Brinchmann, J., Charlot, S., Tremonti, C., & White, S. D. M. 2004, ApJ, 613, 109
- Hutchings et al. (1984) Hutchings, J. B., Crampton, D., & Campbell, B. 1984, ApJ, 280, 41
- Jedrzejewski (1987) Jedrzejewski, R.I. 1987, MNRAS, 226, 747
- Kormendy et al. (1997) Kormendy, J., Bender, R., Magorrian, J., et al. 1997, ApJ, 482, L139
- Kormendy & Ho (2013) Kormendy, J., & Ho, L. C. 2013, ARA&A, 51, 511
- Kormendy & Richstone (1995) Kormendy, J., & Richstone, D. 1995, ARA&A, 33, 581
- Krist (1995) Krist, J. 1995, Astronomical Data Analysis Software and Systems IV, 77, 349
- La Barbera et al. (2015) La Barbera, F., Vazdekis, A., Ferreras, I., et al. 2015, MNRAS, submitted (arXiv:1509.08250)
- Laor (1998) Laor, A. 1998, ApJ, 505, L83
- Larkin et al. (2006) Larkin, J., Barczys, M., Krabbe, A., et al. 2006, New Astronomy Reviews, 50, 362
- Lauer et al. (1996) Lauer, T. R., Tremaine, S., Ajhar, E. A., et al. 1996, ApJ, 471, L79
- Law et al. (2009) Law, D. R., Steidel, C. C., Erb, D. K., et al. 2009, ApJ, 697, 2057
- Li et al. (2015) Li, H., Li, R., Mao, S., Xu, D., Long, R.J., Emsellem, E. 2015, MNRAS, submitted (arXiv:1511.00789)
- Liller (1966) Liller, M. H. 1966, ApJ, 146, 28
- Magorrian et al. (1998) Magorrian, J., et al. 1998, AJ, 115, 2285
- Martín-Navarro et al. (2015a) Martín-Navarro, I., La Barbera, F., Vazdekis, A., et al. 2015a, MNRAS, 451, 1081
- Martín-Navarro et al. (2015b) Martín-Navarro, I., Barbera, F. L., Vazdekis, A., Falcón-Barroso, J., & Ferreras, I. 2015b, MNRAS, 447, 1033
- McConnell & Ma (2013) McConnell, N. J., & Ma, C.-P. 2013, ApJ, 764, 184
- Merritt & Ferrarese (2001) Merritt, D., & Ferrarese, L. 2001, The Central Kiloparsec of Starbursts and AGN: The La Palma Connection, 249, 335
- Michard (1984) Michard, R. 1984, A&A, 140, L39
- Monnet et al. (1992) Monnet, G., Bacon, R., Emsellem, E. 1992, A&A, 253,366
- Nieto et al. (1988) Nieto, J.-L., Capaccioli, M., & Held, E. V. 1988, A&A, 195, L1
- Pastrav et al. (2013) Pastrav, B. A., Popescu, C. C., Tuffs, R. J., & Sansom, A. E. 2013, A&A, 553, A80
- Pastrav et al. (2013) Pastrav, B. A., Popescu, C. C., Tuffs, R. J., & Sansom, A. E. 2013, A&A, 557, A137
- Peebles (1972) Peebles, P. J. E. 1972, ApJ, 178, 371
- Pichon et al. (2011) Pichon, C., Pogosyan, D., Kimm, T., et al. 2011, MNRAS, 418, 2493
- Planck Collaboration et al. (2014) Planck Collaboration, Ade, P. A. R., Aghanim, N., et al. 2014, A&A, 571, A16
- Rest et al. (2001) Rest, A., van den Bosch, F. C., Jaffe, W., et al. 2001, AJ, 121, 2431
- Robertson et al. (2006) Robertson, B., Hernquist, L., Cox, T. J., Di Matteo, T., Hopkins, P. F., Martini, P., & Springel, V. 2006, ApJ, 641, 90
- Rousselot et al. (2000) Rousselot, P., Lidman, C., Cuby, J.-G., Moreels, G., & Monnet, G. 2000, A&A, 354, 1134
- Savorgnan et al. (2013) Savorgnan, G., Graham, A. W., Marconi, A., et al. 2013, MNRAS, 434, 387
- Savorgnan & Graham (2015a) Savorgnan, G. A. D., & Graham, A. W. 2015a, MNRAS, 446, 2330
- Savorgnan & Graham (2015b) Savorgnan, G. A. D., & Graham, A. W. 2015b, ApJ, in press
- Savorgnan & Graham (2015c) Savorgnan, G. A. D., & Graham, A. W. 2015c, in press
- Savorgnan et al. (2015) Savorgnan, G. A. D., & Graham, A. W., Marconi, A., Sani, E. 2015, ApJ, in press
- Scharwächter et al. (2015) Scharwächter, J., Combes, F., Salomé, P., Sun, M., Krips, M. 2015, MNRAS, submitted (arXiv:1507.02292)
- Schlafly & Finkbeiner (2011) Schlafly, E. F., & Finkbeiner, D. P. 2011, ApJ, 737, 103
- Schulze & Gebhardt (2011) Schulze, A., & Gebhardt, K. 2011, ApJ, 729, 21
- Scott & Graham (2013) Scott, N., & Graham, A. W. 2013, ApJ, 763, 76
- Scott et al. (2013) Scott, N., Graham, A. W., & Schombert, J. 2013, ApJ, 768, 76
- Seth et al. (2008) Seth, A. C., Blum, R. D., Bastian, N., Caldwell, N., & Debattista, V. P. 2008, ApJ, 687, 997
- Shankar et al. (2006) Shankar, F., Lapi, A., Salucci, P., De Zotti, G., & Danese, L. 2006, ApJ, 643, 14
- Shankar et al. (2009) Shankar, F., Weinberg, D. H., & Miralda-Escudé, J. 2009, ApJ, 690, 20
- Simien & Michard (1990) Simien, F., & Michard, R. 1990, A&A, 227, 11
- Strom et al. (1977) Strom, K. M., Strom, S. E., Jensen, E. B., et al. 1977, ApJ, 212, 335
- Strom & Strom (1978) Strom, S. E., & Strom, K. M. 1978, AJ, 83, 732
- Tanaka & Li (2014) Tanaka, T. L., & Li, M. 2014, MNRAS, 439, 1092
- Thompson (1976) Thompson, L. A. 1976, ApJ, 209, 22
- Tonry (1984) Tonry, J. L. 1984, ApJ, 283, L27
- Treu et al. (2007) Treu, T., Woo, J.-H., Malkan, M. A., & Blandford, R. D. 2007, ApJ, 667, 117
- Trujillo et al. (2014) Trujillo, I., Ferré-Mateu, A., Balcells, M., Vazdekis, A., & Sánchez-Blázquez, P. 2014, ApJ, 780, L20
- Valluri et al. (2004) Valluri, M., Merritt, D., & Emsellem, E. 2004, ApJ, 602, 66
- van Dam et al. (2006) van Dam, M. A., Bouchez, A. H., Le Mignant, D., et al. 2006, PASP, 118, 310
- van den Bosch et al. (2012) van den Bosch, R. C. E., Gebhardt, K., Gültekin, K., et al. 2012, Nature, 491, 729
- van den Bosch et al. (1998) van den Bosch, F.C., Jaffe, W., & van der Marel, R.P. 1998, MNRAS, 293, 343
- Vorontsov-Vel’Yaminov & Arkhipova (1962) Vorontsov-Vel’Yaminov, B. A., & Arkhipova, V. P. 1962, Morphological catalogue of galaxies, (Moscow: Moscow State Univ.), Part 1
- Vorontsov-Vel’Yaminov & Arkhipova (1968) Vorontsov-Vel’Yaminov, B. A., & Arkhipova, V. P. 1968, Morphological catalogue of galaxies, (Moscow: Moscow State Univ.), Part 4
- Walsh et al. (2015) alsh, J.L., van den Bosch, R.C.E., Gebhardt, K., et al. 2015, ApJ, in press
- White & Frenk (1991) White, S. D. M., & Frenk, C. S. 1991, ApJ, 379, 52
- White & Rees (1978) White, S. D. M., & Rees, M. J. 1978, MNRAS, 183, 341
- Winge et al. (2009) Winge, C., Riffel, R., Storchi-Bergmann, T., 2009, ApJS, 185, 186
- Wizinowich et al. (2006) Wizinowich, P. L., Le Mignant, D., Bouchez, A. H., et al. 2006, PASP, 118, 297
- Wright (2006) Wright, E. L. 2006, PASP, 118, 1711
- Yee (1992) Yee, H. K. C. 1992, in Relationships Between Active Galactic Nuclei and Starburst Galaxies, ed. A.V. Filippenko, ASP Conference Series (ASP: San Francisco), 31, 417
- Yıldırım et al. (2015) Yıldırım, A., van den Bosch, R. C. E., van de Ven, G., et al. 2015, MNRAS, 452, 1792