11email: gcastell@iafe.uba.ar 22institutetext: FADU, University of Buenos Aires, Buenos Aires, Argentina 33institutetext: CBC, University of Buenos Aires, Buenos Aires, Argentina
Unveiling the origin of HESS J1809193
Abstract
Aims. The main goal of this paper is to provide new insights on the origin of the observable flux of rays from HESS J1809193 using new high-quality observations in the radio domain.
Methods. We used the Expanded Very Large Array (now known as the Karl G. Jansky Very large Array, JVLA) to produce a deep full-synthesis imaging at 1.4 GHz of the vicinity of PSR J18091917. These data were used in conjunction with 12CO observations from the James Clerk Maxwell Telescope in the transition line J= and atomic hydrogen data from the Southern Galactic Plane Survey to investigate the properties of the interstellar medium in the direction of the source HESS J1809193.
Results. The new radio continuum image, obtained with a synthesized beam of 8′′ 4′′ and a sensitivity of 0.17 mJy beam-1, reveals with unprecedented detail all the intensity structures in the field. No radio counterpart to the observed X-ray emission supposed to be a pulsar wind nebula powered by PSR J18091917 is seen in the new JVLA image. We discovered a system of molecular clouds on the edge of the supernova remnant (SNR) G11.00.0 shock front, which is positionally coincident with the brightest part of the TeV source HESS J1809193. We determine, on the basis of kinematic and morphological evidences, a physical link of the SNR with the clouds for which we estimated a total (molecular plus atomic) mass of 3 M⊙ and a total proton density in the range 2-3 cm-3.
Conclusions. We propose as the most likely origin of the very high-energy -ray radiation from HESS J1809193 a hadronic mechanism through collisions of ions accelerated at the SNR G11.00.0 shock with the molecular matter in the vicinity of the remnant.
Key Words.:
ISM: individual objects:HESS~J1809$-$193- ISM: supernova remnants:G11.0$-$0.0- ISM: clouds ISM-Radio continuum: general1 Introduction
Since their discovery, Galactic -ray sources have been linked to a variety of astrophysical phenomena like X-ray binaries, star-forming material, remnants of supernova explosions, and pulsar wind nebulae (PWNs), among others (de Naurois 2015). The importance of a broadband approach using multiwavelength observations for understanding the -ray emission processes has been firmly demonstrated over the course of the last few years. Good examples of this class of studies performed especially in the radio and X-rays bands are those presented by Aharonian et al. (2008), H.E.S.S. Collaboration et al. (2011), Gotthelf et al. (2014), on the -ray sources named HESS~J1713$-$381 (linked to the supernova remnant (SNR) CTB~37B), HESS~J1731$-$347 (in SNR G353.6$-$0.7), and HESS~J1640$-$465 (in PSR~J1640$-$4631, SNR G338.3$-$0.0), respectively. Surprisingly, there is still a significant fraction of cases for which the production mechanisms of rays has not been established111For a list of the discovered VHE -ray sources see the online TeV -ray catalog TeVCat http://tevcat.uchicago.edu..
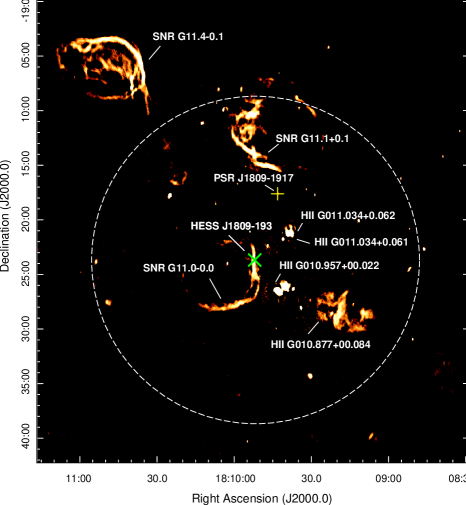
In this paper we focus on the very high-energy (VHE) source HESS J1809193. It was discovered during the systematic search for VHE radiation from pulsars in the Galactic plane survey performed by the High Energy Stereoscopic System (H.E.S.S.) Collaboration (Aharonian et al. 2007). Since its first detection, new data were recorded increasing the detection significance considerably to a value well above 10. The detection of the TeV source occurs in an area of radius . Fitting the excess map with a 2D symmetric Gaussian, Renaud et al. (2008) estimated its best-fit position at R.A.=, Dec.= (J2000.0).
The peak of the VHE emission lies about 6′ to the south of PSR~J1809$-$1917, a middle-aged ( =51 kyr) and energetic (spin-down luminosity = 1.8 erg s-1) 82.7 ms radio pulsar, discovered during the Parkes Multibeam Pulsar Survey of the Galactic Plane (Morris et al. 2002). Using dispersion measure data, distances of and kpc were derived to this pulsar by Cordes & Lazio (2002) and Morris et al. (2002), respectively. In the X-ray domain, on the basis of Chandra observations, Kargaltsev & Pavlov (2007) reported the detection of emission from PSR J18091917 and synchrotron emission from the associated pulsar wind nebula. The overall X-ray morphology of the nebula is dominated by a bright inner component, in diameter, elongated in the north-south direction (with the pulsar close to its south end), which in turn is immersed in a halo of lower surface brightness in size and elongated in the same direction. The energy spectrum of the PWN is characterized by a power law index , while its luminosity is erg s-1 between 0.8 and 7 keV at a distance of 3.5 kpc. The X-ray nebula is also embedded in a fainter but still clearly detectable emission that extends southward of the pulsar (Kargaltsev & Pavlov 2007). Later on, a study performed with the Suzaku satellite confirmed the existence of diffuse non-thermal X-ray emission away from the pulsar up to (Anada et al. 2010) in the direction of HESS J1809193. On the basis of this detection along with the fact that the pulsar is energetic enough to power the bulk of the observed -ray emission, PSR J18091917 and its nebula are considered the most likely counterpart to HESS J1809193 to date. The offset of the VHE centroid from the pulsar position is not atypical as is exemplified by Vela pulsar PSR~B0833$-$45 associated with HESS J0835455 (Aharonian et al. 2006a) and PSR~B1823$-$13 with HESS~J1825$-$137 (Aharonian et al. 2006b). This PWNe offset can be explained by either a high spatial velocity of the pulsar (van der Swaluw et al. 2004) or the evolution of the SNR blastwave into an inhomogeneous interstellar medium (ISM). Thus, an asymmetric reverse SNR shock reaches one side of the PWN sooner than the other side, crushing the PWN (Blondin et al. 2001). This scenario has been proposed for the PSR J18091917/HESS J1809193 system (Kargaltsev & Pavlov 2007) and could be tested through the detection of radio emission from the relic electrons of the crushed PWN.
Remarkably, the presence of other possible sites of energetic particles such as radio supernova remnants and HII regions within the extension of HESS J1809193 hampers a decisive conclusion on the origin of the rays and makes it necessary to revise the PWN scenario considered for the VHE source.
In this paper, we report on new high-quality synthesis imaging obtained from observations carried out with the Expanded Very Large Array (or the Karl G. Jansky Very Large Array as it is now commonly known) of a large region toward HESS J1809193. The purposes of our research are the detection of the radio counterpart to the proposed X-ray PWN powered by PSR B18091917 and/or any trace of the alleged host SNR of this pulsar, as well as the identification of other potential particle accelerators in the field as alternative candidates that produce the VHE -ray emission. Additionally, we outline the discovery of molecular material adjacent to the SNR G11.0$-$0.0 well within the perimeter of HESS J1809193 and analyze its relationship with the production of the detected -ray photons through a hadronic mechanism.
2 Data
2.1 New radio observations
The radio continuum observations at L-band were performed under the shared-risk commissioning phase with the Expanded Very Large Array (EVLA222Hereafter, we use the acronym JVLA to refer to either data or imaging products obtained from the Expanded Very Large Array observations carried out under our program code 12A-166.) of the National Radio Astronomy Observatory333The National Radio Astronomy Observatory (NRAO) is a facility of the National Science Foundation operated by Associated Universities, Inc. under cooperative agreement with the National Science Foundation. in its B and C array configurations as summarized in Table LABEL:evla-data (program code 12A-166). The phase center of the observations was located at R.A.=, Dec.= (J2000.0). The correlator was configured to give a 1 GHz wide-band in full polarization. The baseband was comprised of sixteen 64 MHz sub-bands or spectral windows (SPWs) containing 64 frequency channels. Both in B- and C-array data, significant interference was found especially affecting the SPWs in the frequency range 1.5-1.7 MHz, which was entirely removed. In addition, ten channels at the edges of the SPWs were flagged owing to the roll-off of the digital filters in the signal chain. Our target was observed at intervals of ten minutes, each bracketed by the phase calibrator source J1834$-$1237. The standard calibrator 3C~286 was used for flux and bandpass. The flux density scale was set according to the Perley-Butler coefficients derived at the JVLA in 2010.
| Configuration | Date | Hours |
|---|---|---|
| C | 2012 Feb 5 | 1.5 |
| C | 2012 Feb 18 | 1.5 |
| B | 2012 Jun 20 | 1.5 |
| B | 2012 Jun 21 | 1.0 |
Data processing for each observing run of the JVLA was fully performed with the Common Astronomy Software Applications (CASA) package. For each dataset, after updating the antenna positions and removing obviously corrupted data by hand, we determine appropriate complex antenna gains for the calibrators, which were then applied to the target data. The final calibrated visibility data from all the available observations for each configuration were combined into a single uv-data set, before starting the imaging process. During deconvolution we employed the Multi-Scale Multi-Frequency Synthesis imaging algorithm (Rau & Cornwell 2011) to simultaneously deal with the multiple scales and the variations of the spectral indices of the sources in the field. In addition, we used the CASA implementation of the W-Projection algorithm to correct for the sky curvature. The imaging process was performed by adopting the Briggs robust parameter equal to 0, a compromise between the natural and uniform weighting schemes of visibilities.
After combining the data from the C and B configurations the resulting FWHM of the synthesized beam is 8′′.34′′.4, P.A.=-169∘.62, and the noise level is 0.17 mJy beam-1. The final radio map of the field is shown in Fig. 1. This is the first high-resolution image of the region towards HESS J1809193 that provides unprecedented sensitivity to the radio emission surpassing by more than an order of magnitude the sensitivity of available radio images at the same frequency. As can be seen from this figure, this is a complex region of our Galaxy, full of SNRs and HII regions, all of them indicated in the figure.
2.2 Surrounding medium
The interstellar medium properties of the region around HESS J1809193 were investigated using the neutral hydrogen (HI) data from the Southern Galactic Plane Survey (McClure-Griffiths et al. 2005) which maps the atomic gas with an angular resolution of 2′, a velocity resolution of 0.82 km s-1, and an rms sensitivity of 1 K. We also explored the 12CO J= transition in the region using observations extracted from the data archive of the James Clerk Maxwell Telescope (JCMT, Mauna Kea, Hawaii). The observations (project ID: M10AU20) were obtained using the HARP-ACSIS instrument and have angular and spectral resolutions of 14′′ and 0.42 km s-1, respectively. We used the reduced data produced by the standard ORAC-DR pipelines, which are presented in units of corrected antenna temperature . To convert to main beam temperature , we applied the relation , where is the main beam efficiency. Following Buckle et al. (2009), we used .
3 Results and discussion
3.1 TeV emission from a PWN
Figure 1 shows the region covered by the PSR J18091917/HESS J1809193 system. From the new image no evidence is found, down to the noise level of our data, for the radio counterpart to either the X-ray PWN or the surrounding radio shell associated with its host SNR.
There are many pulsars for which the search of radio PWNe yielded negative results (e.g., Gaensler et al. 2000; Giacani et al. 2009, 2014). In these cases, the failure to detect the nebular emission has been explained as a consequence of two main physical conditions based on either a high magnetic field that inhibits the production of synchrotron radiation at longer wavelengths or severe adiabatic losses that occur in young and energetic pulsars lying in a very low ambient density ( 0.003 cm-3). In the case of PSR J18091917, using the parameters previously derived for this object (=82.7 ms, =2.551014, Morris et al. 2002), we obtain a pulsar magnetic field strength =3.210=1.5 1012 G in good agreement with that derived for most young pulsars in SNRs (Gaensler & Slane 2006). On the other hand, to quantify the properties of the ambient medium where the pulsar is propagating we inspected the structure of the HI emission in a large region surrounding PSR J18091917 in the velocity interval 28-31 km s-1 (all the velocities mentioned in this work are relative to the local standard of rest) corresponding to the distance range estimate to PSR J18091917 of 3.5-3.7 kpc (according to the rotation curve model of the Milky Way of Fich et al. 1989, with the galactic distance R0=8.5 kpc and the rotation velocity at the Sun =220 km s-1). Figure 2 shows a HI large-scale feature surrounding the pulsar, which at first glance looks like a blown wind bubble generated by the stellar wind of the progenitor star. We crudely estimate the volume density of the ambient atomic gas in the cavity by integrating the column density distribution within the mentioned velocity range and assuming for the cavity a spherical geometry with a radius of 9′ at a distance of 3.6 kpc (an average between the 3.5 and 3.7 kpc). After subtracting an appropriate background level to account for diffuse emission that may come from far gas whose emission is detected at the same radial velocities in this direction of the Galaxy, the obtained ambient medium density is 1.5 cm-3. Regardless of whether this HI structure represents the imprint left in the ISM by a past event that ended in a SN explosion or simply inhomogeneities in the medium, the obtained value rules out the possibility of an expansion in an area of very low density. We consequently note that the conditions invoked to account for the lack of an associated radio nebula fail to explain the case of PSR J18091917.

Nevertheless, we can still speculate that if the radio pulsar wind nebula existed and if it were at least 4′ across (that is, a size similar to that of the faintest X-ray emission observed with Chandra), then the resulting upper limit for the nebular flux density at 1.4 GHz – consistent with our non-detection (at a sensitivity of 0.2 mJy beam-1) – would be 250 mJy. Assuming a typical PWN radio spectral index =0.3 (S , Gaensler & Slane 2006), we find that the mentioned flux at 1.4 GHz corresponds to a broadband radio luminosity integrated between 107 and 1011 Hz of erg s-1 (at a distance of 3.6 kpc) and to an efficiency ; both estimates are significantly lower than the typical values of erg s-1 and observed in other radio PWNe (Gaensler & Slane 2006). However, this analysis should be taken with caution as exceptions exist; for example, the pulsars PSR~B1706$-$44 and PSR~B0906$-$49 both power observable radio nebulae with very low efficiencies of about (Giacani et al. 2001).
As mentioned in Sect. 1, PSR J18091917 appears to be the most viable counterpart to the HESS J1809193 source in a leptonic scenario where the reverse shock from a surrounding SNR has collided with the entire shock surface bounding the nebula powered by PSR J18091917. After this phase an offset nebula is formed and HESS J1809193 may correspond to such nebula emitting in the VHE domain. Numerical simulations of this process estimate a crushing timescale of yr, where is the total mechanical energy of the SN explosion in units of 1051 erg, is the ejected mass, and is the ambient hydrogen density in cm-3 (van der Swaluw et al. 2004). In the case of PSR J18091917, if we assume that is equal to unity, =10 and we use the hydrogen density derived from our study of the HI distribution in the region of the pulsar (=1.5 cm-3), we obtain a crushing timescale of 6 kyr. This time is considerably lower than the characteristic age of the pulsar even if we consider an initial energy of the explosion of 1050 erg. This relic PWN scenario requires the existence of a SNR, but taking into consideration the characteristic age of PSR J18091917, the radio emission of the alleged remnant might have dissipated through the action of radiative shocks, making the SNR forward shock undetectable. Thus, a relic TeV PWN origin for HESS J1809193 cannot be dismissed. It should be pointed, however, out that this scenario is not completely consistent with the location of the pulsar in the cometary shaped nebula observed in X-rays in the vicinity of PSR J18091917. Indeed, as noticed by Anada et al. (2010) both Chandra and Suzaku observations suggest that the pulsar is moving towards the center of the HESS J1809193 source.
3.2 TeV emission from a hadronic mechanism
In our search for an alternative explanation of the observed -ray emission, the SNR G11.00.0 that lies in projection within the brightest region of the VHE source appears to be a promising candidate for the acceleration of particles via -decay emission arising from proton-proton collisions. In this context, we search for spatial correspondences between matter concentration and the -ray photons observed in HESS J1809193.
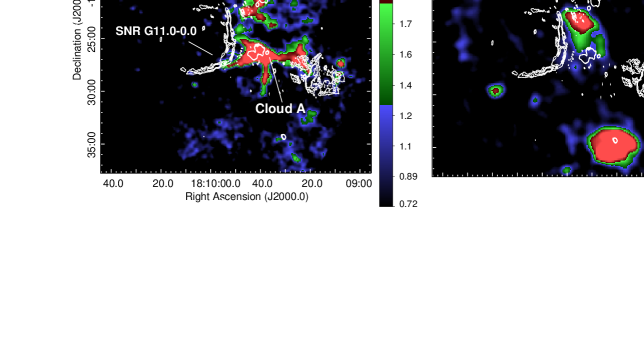
After a careful inspection of the whole 12CO (J=) data cube in the environment of HESS J1809193, we identified molecular material at different velocities that shows tight spatial correlation with both the SNR G11.00.0 and the -ray peak. The observed molecular clouds are limited to the velocity intervals (+16 km s-1, +27 km s-1) and (+71 km s-1, +78 km s-1). Figure 3(a) shows the distribution of the 12CO emission integrated in the lower velocity range overlaid with contours delineating the location of the SNR G11.00.0. At least three clouds, which we refer to in this work as A, B, and C for convenience, can be distinguished in the large-scale distribution of the molecular gas. These components seen in projection on the plane of the sky overlap the western outer border of G11.00.0 in all its extension. Feature A overlaps the flattened and intense region of the radio shell towards the south and delineates the western border of the SNR. Cloud B coincides with the brightest region of HESS J1809193 (depicted as a 5 significance contour in Fig. 1 of Komin et al. 2008) and one of its extremes is in contact with the northwestern rim of G11.00.0. Finally, the molecular component C, while located in the northern extreme of the remnant, still lies within the extension of the -ray emission. We adopt 21 km s-1 as the systemic velocity of the molecular material; because of the so-called kinematic distance ambiguity in the inner Galaxy, this results in a near and far kinematic distances of 2.9 and 13.6 kpc, respectively. Figure 3(b) shows the intensity of the 12CO integrated in the velocity range of 71-78 km s-1, superimposed with some contours of the radio continuum emission from G11.00.0. From this image, a good correspondence can be seen between the flat western boundary of the remnant and the molecular gas. Interestingly, part of the cloud projects onto the brightest -ray emission. For this cloud we adopt a systemic velocity of 75 km s-1, which corresponds to near/far distances of 6/11 kpc.
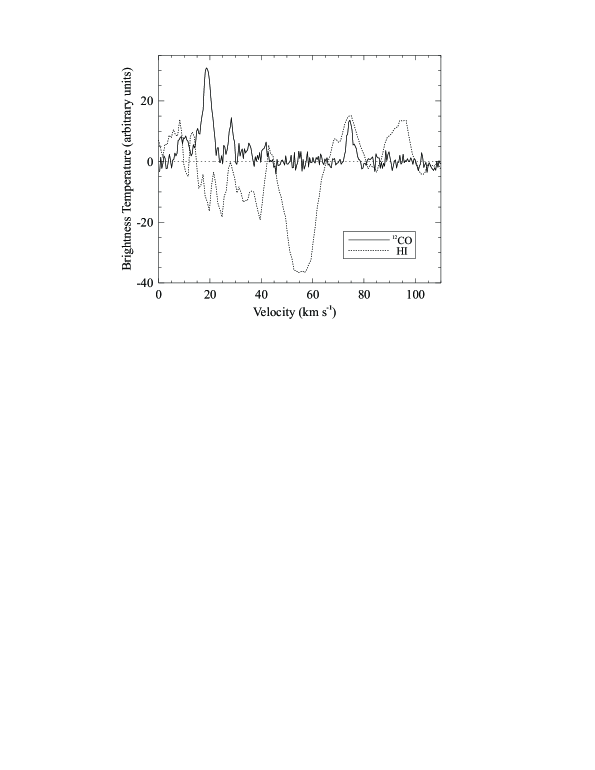
Following Roman-Duval et al. (2009) we resolved the kinematic distance ambiguity for each cloud using the 12CO information in conjunction with the cold atomic hydrogen gas embedded within the molecular cloud. Because HI is present throughout the Galaxy, if the cloud is located at a near distance, a correlation between the 12CO emission line from the cloud and an HI self-absorption feature should be noticed in the spectrum because the atomic gas in the interior of the cloud is colder than the rest of the Galactic atomic hydrogen located behind the cloud along the line of sight. On the contrary, no absorption feature in the HI spectrum should be present for a cloud placed at the far kinematic distance because there is no warm Galactic HI at the velocity of the molecular cloud to be absorbed. From the rotation curve it is evident that the warm HI that could be located beyond the far molecular cloud can only be associated with velocities completely different from the velocity of the cloud of interest. In Fig. 4 we show the HI 21 cm and 12CO spectra in the direction of the molecular clouds identified at 21 km s-1 and 75 km s-1. At the lower velocity, the HI 21 cm spectrum exhibits a deep self-absorption throughout the molecular emitting region and hence we assign to this cloud the near distance (d3 kpc). Conversely, the emission feature in the HI 21 cm spectrum centered at 75 km s-1, which is in coincidence with a peak in the 12CO emission, revealed that this cloud is located at the far kinematic distance (d11 kpc).
We estimate the mass of the structures A, B, and C observed at 21 km s-1 and the cloud identified at 75 km s-1. To do this, we first calculate the H2 column density using the empirical relation , where is the integrated line CO flux and XCO is the CO to H2 conversion factor for the 12CO J= transition. By assuming that the gas is in local thermodynamic equilibrium, it means that all molecular levels are expected to be equally populated, and hence we can use cm-2 K km s-1, which is the canonical conversion factor between the H2 and the 12CO in the J= transition (Bolatto et al. 2013). The mass for each cloud is then determined through the relation , with being the mean molecular mass equal to 2.8 assuming a relative helium abundance of 25%, the mass of the hydrogen atom, the angular area subtended by the source, and the distance to the cloud. In order to estimate the total ambient proton distribution, we extend our analysis of the ISM properties by exploring the contribution of the atomic gas to the mass and density of the clouds defined by the velocity ranges used for the 12CO data. Under the assumption that the neutral atomic gas is optically thin, the HI column density is given as (Dickey & Lockman 1990), where [K] and [km s-1] represent the intensity and velocity of the neutral gas, respectively. The volume densities were estimated assuming elliptic representations of each molecular cloud with a depth comparable to the size of the minor axis. The individual estimates for the mass and density of all the clouds are summarized in Table 2. The error in the cloud masses are estimated to be on the order of 45%, which mainly arises from the uncertainty in distance measurements (30%).
| Feature | Central Position | Mass | Total proton density | ||
|---|---|---|---|---|---|
| R.A., decl. (J2000.0) | 1021 [cm-2] | 1021 [cm-2] | 103 [] | 103 [cm-3] | |
| Cloud A at 21 km s-1 | , | 5.3 | 2.2 | 0.8 | 1.9 |
| Cloud B at 21 km s-1 | , | 9.6 | 2.1 | 1.3 | 3 |
| Cloud C at 21 km s-1 | , | 6.4 | 2.5 | 0.7 | 2.5 |
| Cloud at 75 km s-1 | , | 1.5 | 0.3 | 4.2 | 0.1 |
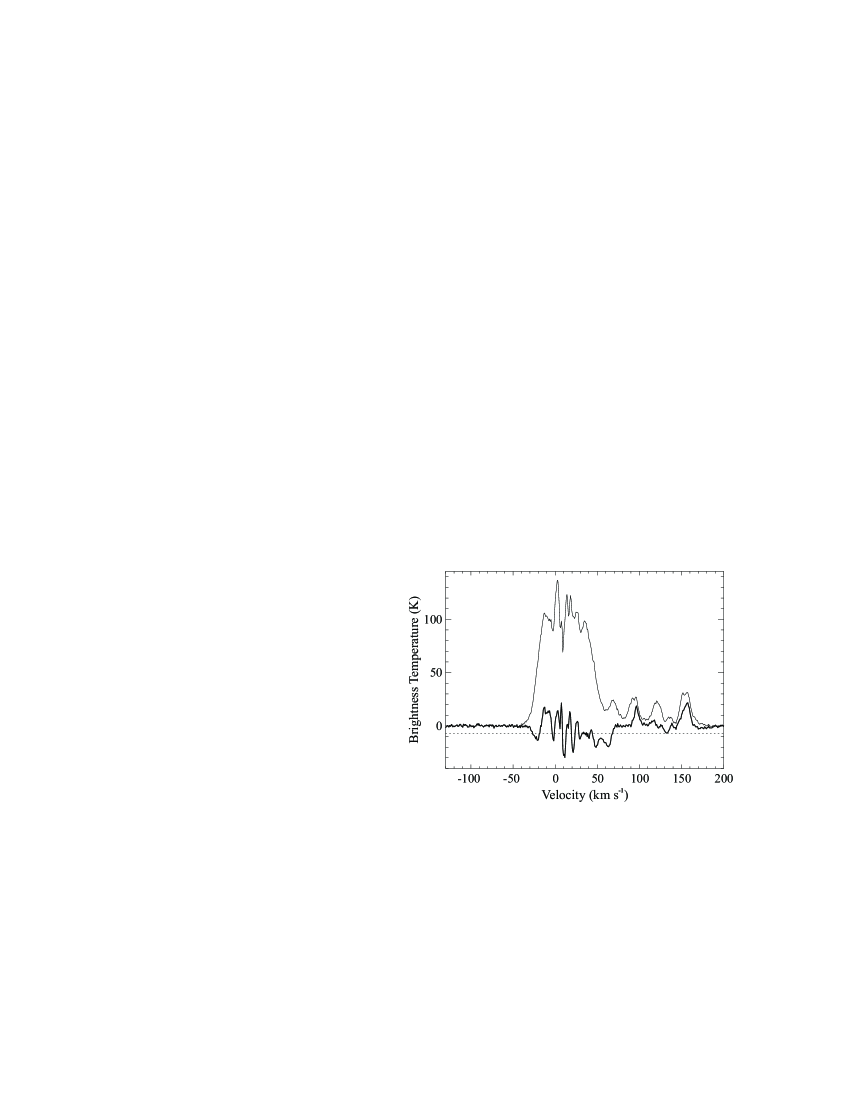
Before discussing the possible role of the identified molecular material as target ISM protons to produce the observed rays, we estimate the distance to SNR G11.00.0 using the HI absorption technique. While G11.00.0 itself is relatively weak and has a thin shell, we construct the emission spectrum against the southern part of the SNR shell where there is a dominant bright feature. The absorption profile was obtained by subtracting the bright radio shell emission from nearby regions devoid of continuum emission. Both spectra are shown in Fig. 5; the most positive-velocity reliable absorption feature is seen at 20 km s-1. Regarding the lower level absorption dip in the velocity range 50-65 km s-1, we believe that in view of its extent and its association with relative low-amplitude emission, this feature may represent fluctuations in the HI emission and hence we are not confident that the absorption is real. Additionally, no absorption is observed at negative velocities. Therefore, we consider the value 20 km s-1 as a lower limit to the systemic velocity of G11.00.0, corresponding to near and far kinematic distances of 3 and 13.8 kpc, respectively. However, if we regard the feature at 50-65 km s-1 as reliable, the absence of absorption between these velocities and the tangent point at 167 km s-1 indicates that an upper limit on the distance to the SNR of 5.2 kpc can be adopted. The distance of 17 kpc as derived by Brogan et al. (2004) using the -D correlation between the linear diameter of the G11.00.0 shell and its radio surface brightness is not consistent with the range of possible values (3.0-5.2 kpc) that we have determined for SNR G11.00.0 through HI absorption. Such a disagreement is not surprising, since it has long been known that the -D relationship has a large intrinsic dispersion.
Taking into account the good morphological correspondence between the remnant G11.00.0 and the molecular material located at the same systematic velocity, we therefore argue a physical connection between them. This allows us to resolve the ambiguity of the distance to G11.00.0: it is located at about 3 kpc.
The question to be addressed, therefore, is whether the cloud components traced by the 12CO emission at 21 km s-1 can be considered a plausible astronomical environment for producing the detected photons in HESS J1809193. To pursue this point we first calculate the -ray flux from HESS J1809193 taking into account that the spectrum of this source is fit well by a pure power law (dF/dE=N) with a photon index =2.23 and =6.4 TeV-1 cm-2 s-1 (Renaud et al. 2008), which implies F ph cm-2 s -1. Then, we quantify the ambient density required to power the observed -ray flux through the Eq. (16) of Torres et al. (2003), given our estimate of the distance to the molecular material (d3 kpc) along with other assumptions such as an efficiency =3% to convert the accelerated hadrons into cosmic rays and a supernova energy output of 1051 erg. We find that at a distance of 3 kpc an ambient density of 40 cm-3 it would be necessary to produce the -ray emission detected above 1 TeV. By comparing this density with that measured in the molecular material comprising Clouds A, B, and C, we conclude that it is dense enough to generate the VHE emission hadronically. We also infer an expected volume density 470 cm-3 for the molecular material identified at 75 km s-1, which favors our interpretation that this background gas at d11 kpc is not related to the production of -rays photons in HESS J1809-193.
4 Summary
At present, the most plausible origin for the -ray emission from HESS J1809193 has been explained by a PWN powered by the pulsar PSR J18091917; however, there is no conclusive observational evidence to support the proposed leptonic scenario. This motivated us to perform the first high-sensitivity radio study of a large region containing the TeV source at 1.4 GHz using the JVLA. In addition, we analyzed the ISM of this area. Although our radio observations surpass the sensitivity of available radio images by more than an order of magnitude (noise level of our image mJy beam-1), there is no trace of radio emission associated with the X-ray PWN driven by PSR J18091917 nor an indication of the existence of a host SNR. We also analyzed the 12CO in the vicinity of HESS J1809193 to investigate the possibility of any other candidate in the field of view that could explain the production mechanism of the high-energy -rays. As a result of this analysis, we discovered a system of molecular clouds (centered at v21 km s-1) that includes three main components (called in this work clouds A, B, and C). This material is well correlated with the TeV source and matches the morphology of the western edge of the SNR G11.00.0. The distance to these clouds was constrained to be 3 kpc based on the association between 12CO emission and HI-self absorption features, which also coincides within uncertainties with the kinematical distance derived for G11.00.0. We calculated the total mass and total proton density of the A, B, and C clouds (taking into account contributions from both HI and 12CO, the values are 103 and 103 cm-3, see Table 2), which we assumed are interacting with the remnant G11.00.0, and found that they indeed satisfy the required amount of target material to explain the observed TeV -ray flux from HESS J1809193 as produced by hadrons.
We finally note that our analysis does not rule out a hybrid scenario in which contributions from relativistic leptons via inverse Compton process in the PSR J18091971 operate together with the hadronic process that we have proposed in this work. In addition, star formation activity can play a role in HESS J1809193 as several bright HII regions lie within the boundary of the VHE source.
Acknowledgements.
This research was partially funded by Argentina Grants awarded by ANPCYT: PICT 0571/11 and 0902/13; CONICET: 0736/11; and University of Buenos Aires (UBACYT). G.C., E.G., and A.P. are Members of the Carrera del Investigador Científico of CONICET, Argentina.References
- Aharonian et al. (2008) Aharonian, F., Akhperjanian, A. G., Barres de Almeida, U., et al. 2008, A&A, 486, 829
- Aharonian et al. (2007) Aharonian, F., Akhperjanian, A. G., Bazer-Bachi, A. R., et al. 2007, A&A, 472, 489
- Aharonian et al. (2006a) Aharonian, F., Akhperjanian, A. G., Bazer-Bachi, A. R., et al. 2006a, A&A, 448, L43
- Aharonian et al. (2006b) Aharonian, F., Akhperjanian, A. G., Bazer-Bachi, A. R., et al. 2006b, A&A, 460, 365
- Anada et al. (2010) Anada, T., Bamba, A., Ebisawa, K., & Dotani, T. 2010, PASJ, 62, 179
- Blondin et al. (2001) Blondin, J. M., Chevalier, R. A., & Frierson, D. M. 2001, ApJ, 563, 806
- Bolatto et al. (2013) Bolatto, A. D., Wolfire, M., & Leroy, A. K. 2013, ARA&A, 51, 207
- Brogan et al. (2004) Brogan, C. L., Devine, K. E., Lazio, T. J., et al. 2004, AJ, 127, 355
- Buckle et al. (2009) Buckle, J. V., Hills, R. E., Smith, H., et al. 2009, MNRAS, 399, 1026
- Cordes & Lazio (2002) Cordes, J. M. & Lazio, T. J. W. 2002, ArXiv Astrophysics e-prints [arXiv:astro-ph/0207156]
- de Naurois (2015) de Naurois, M. 2015, ArXiv e-prints [arXiv:1510.00635]
- Dickey & Lockman (1990) Dickey, J. M. & Lockman, F. J. 1990, ARA&A, 28, 215
- Fich et al. (1989) Fich, M., Blitz, L., & Stark, A. A. 1989, ApJ, 342, 272
- Gaensler & Slane (2006) Gaensler, B. M. & Slane, P. O. 2006, ARA&A, 44, 17
- Gaensler et al. (2000) Gaensler, B. M., Stappers, B. W., Frail, D. A., et al. 2000, MNRAS, 318, 58
- Giacani et al. (2014) Giacani, E., Rovero, A. C., Cillis, A., Pichel, A., & Dubner, G. 2014, ArXiv e-prints [arXiv:1412.1673]
- Giacani et al. (2009) Giacani, E., Smith, M. J. S., Dubner, G., et al. 2009, A&A, 507, 841
- Giacani et al. (2001) Giacani, E. B., Frail, D. A., Goss, W. M., & Vieytes, M. 2001, AJ, 121, 3133
- Gotthelf et al. (2014) Gotthelf, E. V., Tomsick, J. A., Halpern, J. P., et al. 2014, ApJ, 788, 155
- H.E.S.S. Collaboration et al. (2011) H.E.S.S. Collaboration, Abramowski, A., Acero, F., et al. 2011, A&A, 531, A81
- Kargaltsev & Pavlov (2007) Kargaltsev, O. & Pavlov, G. G. 2007, ApJ, 670, 655
- Komin et al. (2008) Komin, N., Carrigan, S., Djannati-Ataĭ, A., & et al. 2008, International Cosmic Ray Conference, 2, 815
- McClure-Griffiths et al. (2005) McClure-Griffiths, N. M., Dickey, J. M., Gaensler, B. M., et al. 2005, ApJS, 158, 178
- Morris et al. (2002) Morris, D. J., Hobbs, G., Lyne, A. G., et al. 2002, MNRAS, 335, 275
- Rau & Cornwell (2011) Rau, U. & Cornwell, T. J. 2011, A&A, 532, A71
- Renaud et al. (2008) Renaud, M., Hoppe, S., Komin, N., et al. 2008, in American Institute of Physics Conference Series, Vol. 1085, American Institute of Physics Conference Series, ed. F. A. Aharonian, W. Hofmann, & F. Rieger, 285–288
- Roman-Duval et al. (2009) Roman-Duval, J., Jackson, J. M., Heyer, M., et al. 2009, ApJ, 699, 1153
- Torres et al. (2003) Torres, D. F., Romero, G. E., Dame, T. M., Combi, J. A., & Butt, Y. M. 2003, Phys. Rep, 382, 303
- van der Swaluw et al. (2004) van der Swaluw, E., Downes, T. P., & Keegan, R. 2004, A&A, 420, 937