Study of young stellar groupings in H ii regions based on the spectral and photometric data
A.S. Gusev1***Email: gusev@sai.msu.ru, F.Kh. Sakhibov2, A.E. Piskunov3, N.V. Kharchenko4, L.S. Pilyugin4, O.V. Ezhkova1, M.S. Khramtsova3, S.A. Guslyakova5, V.V. Bruevich1, S.N. Dodonov6, V. Lang2, E.V. Shimanovskaya1, Yu.N. Efremov1
1Sternberg Astronomical Institute, Moscow State University, Moscow, Russia
2University of Applied Sciences of Mittelhessen, Department of Mathematics, Natural Sciences and Data Processing, Friedberg, Germany
3Institute of Astronomy, Russian Academy of Sciences, Moscow, Russia
4Main Astronomical Observatory of National Academy of Sciences of Ukraine, Kiev, Ukraine
5Space Research Institute, Russian Academy of Sciences, Moscow, Russia
6Special Astrophysical Observatory, Russian Academy of Sciences, Nizhnij Arkhyz, Russia
(Received 15 September 2015)
We studied 102 star forming regions in seven spiral galaxies (NGC 628, NGC 783, NGC 2336, NGC 6217, NGC 6946, NGC 7331, and NGC 7678) on the basis of complex spectroscopic, photometric () and spectrophotometric (H line) observations. Using data on the chemical composition and absorption in H ii regions, obtained from spectroscopic observations, and using evolutionary models, we estimated physical parameters (ages and masses) of young stellar groupings embedded in H ii regions. We found that the gas extinction, , which determined from the Balmer decrement, does not correspond in some cases to the absorption in the young stellar associations (complexes). This is due to the spatial offset relative H ii cloud the stellar group related to him. It has been found that the condition does not satisfied for the star forming regions, in which: 1) the contribution to the total emission of gas in the and/or bands is higher than , and 2) EW(HÅ. Extinction in studied star forming regions corrected for the Galactic absorption ranges from 0 to 3 mag with a mean value mag. We estimated masses and ages for 63 star forming regions. The regions have ages from 1 to 10 Myr, the most part of them are younger than 6 Myr. The derived masses of young stellar groupings range from in the nearby galaxies NGC 628 and NGC 6946 to in the most distant NGC 7678. More than of groupings have masses between and . The lowest mass estimate of for the objects in NGC 628 and NGC 6946 belongs to the mass interval of the youngest Galactic open clusters.
Keywords: Galaxies; Star forming regions; H ii regions; Photometry; Spectroscopy
1 Introduction
We present the results of comprehensive study of star forming (SF) regions in seven spiral galaxies based on the obtained spectral and photometric data. We have observed emission line spectra of 102 giant H ii regions in seven spiral galaxies NGC 628 (10), NGC 783 (8), NGC 2336 (28), NGC 6217 (3), NGC 6946 (39), NGC 7331 (4), and NGC 7678 (10). We also carried out photometry and H spectrophotometry for the same SF regions in the galaxies.
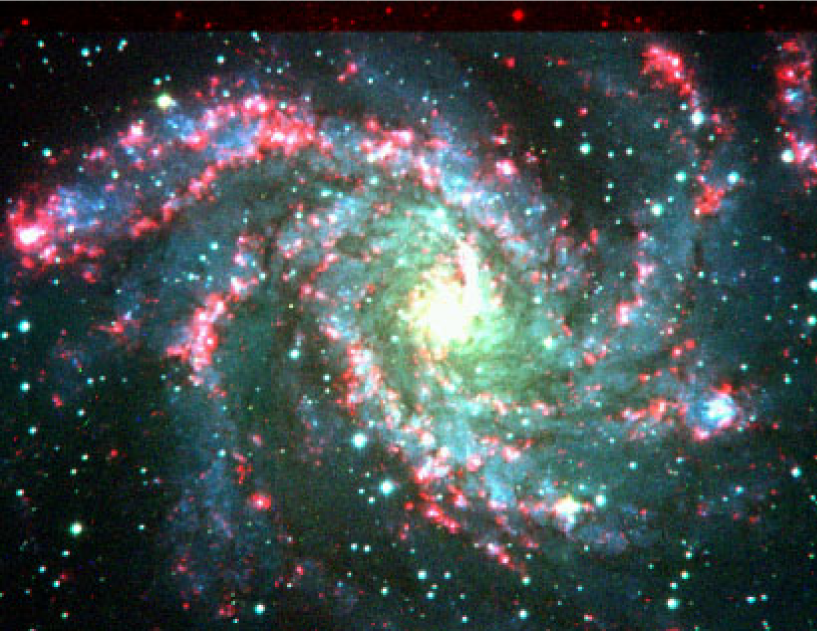
Star forming region in an other galaxy is a single conglomerate of newly formed star clusters, dust clouds and ionized gas. The SF region’s sizes are within the range from several tens to pc; the ages are typically do not exceed 10 Myr (Elmegreen and Efremov, 1996; Efremov and Elmegreen, 1998). Being bright, SF regions can be observed in nearby galaxies as objects of magnitudes in and bands with emission spectra, but they cannot be resolved into separate stars (see Fig. 1).
Accounting for the effects of gas and dust on observations of SF regions is very important for the interpretation of multicolour photometry in terms of the initial mass function (IMF) and the star formation rate (SFR) history. Despite a huge amount of both spectroscopic and photometric observations of the extragalactic giant H ii regions – SF regions, the overlaps of the spectroscopic observations of SF regions with the photometric ones are very poor. Using both techniques, we can eliminate the degeneracy between age and extinction, age and metallicity. Emission lines detected via spectroscopy can be used for disentangling the effects of extinction, accounting for the impact of the nebula emission on integrated broadband photometry and serve as valuable diagnostics of gas abundances (see Sakhibov and Smirnov, 1990; Reines et al., 2010, and references therein).
The galaxy sample is presented in Table 1, where fundamental parameters from the LEDA†††http://leda.univ-lyon1.fr/ data base (Paturel at al., 2003) are provided. The morphological type of galaxies is given in column (2), the apparent and absolute magnitudes are listed in columns (3) and (4), the inclination and position angles – in columns (5) and (6), and the isophotal radius in arcmin and kpc – in columns (7) and (8). Adopted distances are given in the column (9). Finally, the Galactic absorption and the dust absorption due to the inclination of a galaxy are presented in columns (10) and (11). The Galactic absorptions, , are taken from the NED‡‡‡http://ned.ipac.caltech.edu/ data base. Other parameters are taken from the LEDA data base. Adopted value of the Hubble constant is equal to km s-1Mpc-1.
| NGC | Type | PA | Ref.c | ||||||||
|---|---|---|---|---|---|---|---|---|---|---|---|
| (mag) | (mag) | (degr) | (degree) | (arcmin) | (kpc) | (Mpc) | (mag) | (mag) | |||
| 1 | 2 | 3 | 4 | 5 | 6 | 7 | 8 | 9 | 10 | 11 | 12 |
| 628 | Sc | 9.70 | –20.72 | 7 | 25 | 5.23 | 10.96 | 7.2 | 0.254 | 0.04 | 1 |
| 783 | Sc | 13.18 | –22.01 | 43 | 57 | 0.71 | 14.56 | 70.5 | 0.222 | 0.45 | 2 |
| 2336 | SB(R)bc | 11.19 | –22.14 | 55 | 175 | 2.51 | 23.51 | 32.2 | 0.120 | 0.41 | 3 |
| 6217 | SB(R)bc | 11.89 | –20.45 | 33 | 162 | 1.15 | 6.89 | 20.6 | 0.158 | 0.22 | 4 |
| 6946 | SABc | 9.75 | –20.68 | 31 | 62 | 7.74 | 13.28 | 5.9 | 1.241 | 0.04 | 5 |
| 7331 | Sbc | 10.20 | –21.68 | 75 | 169 | 4.89 | 20.06 | 14.1 | 0.331 | 0.61 | 5 |
| 7678 | SBc | 12.50 | –21.55 | 44 | 21 | 1.04 | 14.46 | 47.8 | 0.178 | 0.23 | 6 |
a Absolute magnitude of a galaxy corrected for Galactic extinction and inclination effect.
b Radius of a galaxy at the isophotal level 25 mag/arcsec2 in the band corrected for Galactic extinction and inclination effect.
2 Observations and reduction
The spectroscopic observations were carried out in 2006–2008 at the 6 m telescope of Special Astrophysical Obsevatory (SAO) of the Russian Academy of Sciences with spectral camera attached at the focal reducer SCORPIO () in the multislit mode; the field was about 6 arcmin and the pixel size was 0.178 arcsec on a EEV 42-40 ( pixels) CCD detector. We used the grism VPHG550G with a dispersion of 2.1Å/pixel and a spectral resolution of 10Å, which provided spectral coverage from [O ii]3727+3729 oxygen emission lines to [S ii]6717+6731 sulphur emission lines. As a result, we obtained 114 spectra for 102 H ii regions in seven galaxies. Detailed description of the observations and data reduction see in Gusev et al. (2012, 2013).
The photometric observations of the galaxies were obtained in 1988–2006 with the 1 m and 1.5 m telescopes of the Maidanak Observatory (Uzbekistan) and 1.8 m telescope of the Bohyunsan Optical Astronomy Observatory (South Korea). We used a photometric system close to the standard Johnson–Cousins system. The seeing during observations was ′′. Detailed description of the observations and data reduction see in references in the last column of Table 1.
Spectrophotometric H observations of three galaxies (NGC 628, NGC 6946, and NGC 7331) from our sample were made in 2006 with the 1.5 m telescope of the Mt. Maidanak Observatory with the SI-4000 CCD camera. The wide-band interference H filter ( = 6569Å, FWHM = 44Å) was used for the observations. The filter parameters provides H+[N ii] imaging for these nearby galaxies. Detailed description of H observations and data reduction see in Gusev and Efremov (2013) and Gusev et al. (2016).
The reduction of the spectroscopic, photometric and spectrophotometric data was carried out using standard techniques, with the European Southern Observatory Munich Image Data Analysis System§§§http://www.eso.org/sci/software/esomidas/ (eso-midas).
We identified the SF regions in NGC 628 and NGC 6946 using the list of H ii regions of Belley and Roy (1992). Identification of SF regions in other galaxies was made by eye.
We took the geometric mean of the star forming complex major and minor axes for the SF region’s characteristic diameter : . We measured and from the radial profiles at the half-maximum brightness level (FWHM) for regions having a starlike profile, or by the distance between the points of maximum flux gradient for regions having extended (diffuse) profiles. We adopted the seeing as the error of the size measurements, which definitely exceeds all other errors.
Measurements of the apparent total magnitude and colour indices , , , and were made within a round aperture. To measure magnitudes, we used the aperture size equal to the sum of the and the seeing in the band; in the case of measurements of colour indices, the aperture size is equal to the . Use of smaller aperture for measurement of colour indices provides the spectral energy distribution in the brightest central part of SF regions, i.e. in the young massive star clusters embedded in giant H ii regions. The galactic background is taken into account through the subtraction of the average flux, coming from the local surrounding region around the same area, from the flux, measured inside the round aperture.
We obtained magnitudes and colour indices for 101 of 102 studied SF regions. One object in NGC 7331 is out of the image in the bands.
3 Methods
Combination of spectroscopic and multicolour photometric observations of SF regions provides true colours and metallicities of young stellar groupings. That is necessary to account for the nebular emission impact and to eliminate ”age–extinction” and ”age–metallicity” degenerations in the comparative analysis with theoretical evolutionary models of star clusters.
SF regions, studied here, constitute a single conglomerate of clouds of interstellar dust, ionised hydrogen, and newly formed star clusters. Much of the light emitted by stars in SF region’s clusters undergoes absorption inside rather than outside the region itself. Therefore, if a SF region contains the significant amount of the interstellar dust, then the light from SF region stars is strongly attenuated even if the host galaxy is seen face-on. We assume that the emission from stars embedded in the SF region is absorbed in the same way as the emission in lines of ionised hydrogen surrounding the star clusters in the SF region. In other words, the light extinction for stars is equal to the light extinction for the emission of ionised gas .
However, in some cases the gas extinction does not correspond to the absorption in the young stellar associations (complexes). The purpose of our study was to find the criteria for which the condition is performed in the SF region.
In the first, we determine the relative contributions of stellar continuum, nebular continuum, and emission lines fluxes to the total observed flux in the broadband filters (see Sakhibov and Smirnov, 1990).
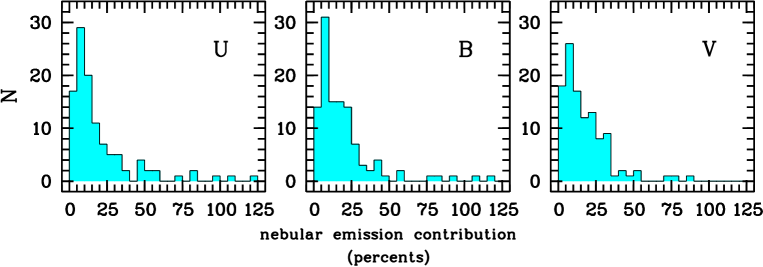
Fig. 2 shows the distributions of studied SF regions over relative contribution of the nebular emission to , , and fluxes. The number of objects decreases with the increase of relative contributions of the nebular emission. Some objects show extremely high nebular emission fluxes (), which are sometimes comparable or even more than total fluxes of SF regions at least in one of bands. The most part of these objects has extremely red colours (out of limits of model colours for the young stellar populations). However, according to Reines et al. (2010) the objects with a nebular emission contribution more than in , passbands have ages Myr. We suggest that the condition is not valid in such SF regions.
Some information about objects with very high nebular emission flux can be obtained from the comparison of the equivalent width EW(H), independently measured from our spectroscopic data, and the relation of the H flux to star emission flux in the band, estimated from spectrophotometric and photometric observations.
Fig. 3 shows that most objects (black squares) located in the left lower part of the diagram under the upper limits of the equivalent width EW(H) (horizontal dot dashed line) and of the ratio of the H flux to star emission flux in the band (vertical dot dashed line), computed in Reines et al. (2010). A distribution on the diagram of these SF regions (black squares) can be described by the following linear regression (red solid line): . Errors of values of EW(H) are used as weights by the linear fitting. The value of constant is in a good agremeent with the effective bandwidth (Å) and photometric zero-point of the filter determined by Bessell (1990) ().
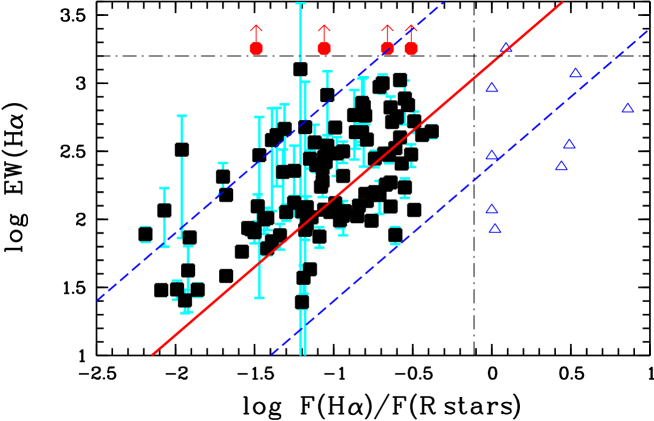
Most part of objects which are located outside of this area (i.e. SF regions with EWÅ and regions with an unreasonable ratio ) shows extremely blue or extremely red colours in the colour-magnitude diagram (see below). It indicates either overestimated or underestimated light absorption for these objects. Note, that the discrepancy in estimations of the gas contribution in the SF regions obtained from the and H photometry and spectroscopic data may indicate the spatial deviation between positions of the H ii region and the star cluster associated with it. For these SF regions the slit of spectrograph crosses the centre of H ii region, but covers the edge of star cluster. Maíz-Apellániz et al. (1998) obtained the two-dimensional spectrophotometric map of the central region of NGC 4214 and showed that stars, gas, and dust clouds in the brightest SF regions near the galactic nucleus are spatially separated. The dust is concentrated at the edges of the region of ionization and primarily influences nebular emission lines, whereas the stellar continuum is located in a region that is relatively free of dust and gas. Thus, the adopted here, assumption of is not valid in such SF regions.
4 Results
We estimated the oxygen and nitrogen abundances and the electron temperatures in 80 out of 102 H ii regions through the recent variant of the strong-line method (NS calibration; Pilyugin and Mattsson, 2011).
The parameters of the radial distribution (the extrapolated central intercept value and the gradient) of the oxygen and nitrogen abundances in the discs of six galaxies (all except NGC 6217) have been determined. The abundances in NGC 783, NGC 2336, NGC 6217, and NGC 7678 are measured for the first time. The extrapolated central oxygen and nitrogen abundances in studied galaxies are in the range from 8.73 to 8.94, and from 8.21 to 8.49, respectively (see Table 2); radial gradients of oxygen and nitrogen abundances are in the range from –0.65 to –0.38 dex/, and from –1.34 to –0.90 dex/, respectively. The only exception is SBc galaxy NGC 7678 with flat radial distribution of oxygen and nitrogen (Table 2).
| Galaxy | O/H | O/H | N/H | N/H |
|---|---|---|---|---|
| centera | gradientb | centera | gradientb | |
| NGC 628 | 8.740.02 | –0.430.03 | 8.260.05 | –1.340.08 |
| NGC 783 | 8.940.12 | –0.650.16 | 8.490.19 | –1.070.26 |
| NGC 2336 | 8.790.05 | –0.380.07 | 8.250.10 | –0.900.15 |
| NGC 6946 | 8.730.02 | –0.430.06 | 8.210.08 | –1.250.19 |
| NGC 7331 | 8.750.18 | –0.490.36 | 8.230.36 | –1.030.74 |
| NGC 7678 | 8.610.03 | –0.150.05 | 7.890.17 | –0.340.27 |
a in unit of 12+log(X/H). b in unit of dex/.
All galaxies from our sample follow well the general trend in the ”luminosity – central metallicity” diagram for spiral and irregular galaxies.
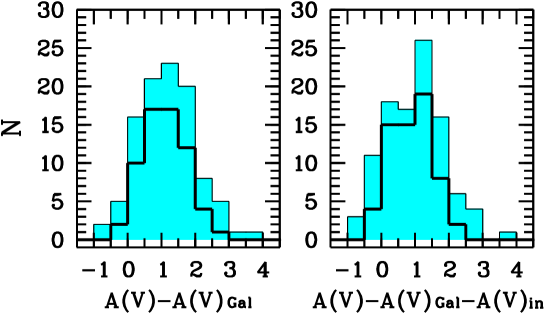
Extinction in studied H ii regions, obtained from the Balmer decrement, varies greatly, from 0 up to 3 mag. Frequency distributions of extinction in SF regions corrected for the Galactic absorption and the dust absorption due to the inclination of a galaxy are presented in Fig. 4. The distributions show Gauss profiles with the mean mag and mag. This result is in a good agreement with reddening measurements for the sample of 49 disc, halo and nuclear star clusters in M82 (Konstantopoulos et al., 2009).
For the further study we excluded SF regions in which , or was overestimated or underestimated (i.e. SF regions with the contribution to the total emission of gas in the and/or passbands is higher than , EWÅ, unreasonable ratio , and SF regions with the spatial deviation between positions of the H ii region and the star cluster associated with it). We also excluded SF regions with large errors of estimations. We believe that the condition is satisfied in the remaining 63 SF regions.
The mean extinction for the sample of 63 SF regions in which is mag and mag.
Two objects in NGC 6946 have unreasonable value (Fig. 4). Apparently, we underestimated the values of in these regions. Remark that one of them has the nebular emission contribution in the band , and the second region has EWÅ.
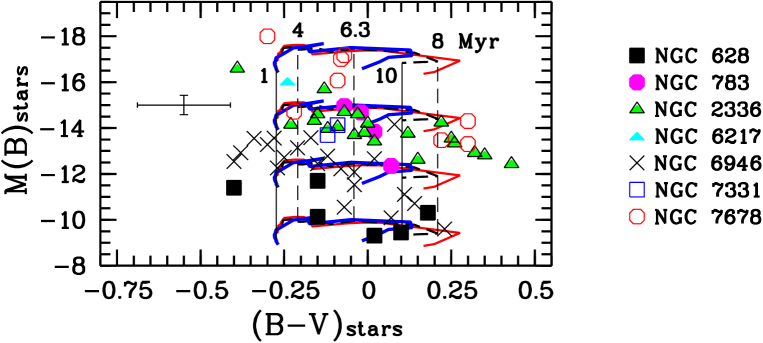
In Fig. 5 we compare the true colours and luminosities of 63 SF regions in galaxies with SSP models with Salpeter IMF slope in the colour-magnitude diagram. The age of models, shown in the diagram, ranges from 1 Myr up to 10 Myr. The figure shows that the objects occupate the models area. Displacements of the objects from the models area lie within the errors interval.
Several objects in distant galaxies NGC 2336 and NGC 7678 are located out of area of young models ( Myr), and can be fitted with older models. As sizes of all these objects belong to the range from 300 pc till 1000 pc, they are cluster complexes. There are two possible interpretation of their location. Firstly, it may indicate the underestimated light extinction and . Secondly, it may indicate on possible coexistence of old and extremely young star clusters in the same SF region.
We estimated masses and ages for 63 SF regions. The regions have ages from 1 to 10 Myr, the most part of them are younger than 6 Myr (Fig. 5). The derived masses of young stellar groupings range from in the nearby galaxies NGC 628 and NGC 6946 to in the most distant NGC 7678. More than of groupings have masses between and (see Fig. 5). The lowest mass estimate of for the objects in NGC 628 and NGC 6946 belongs to the mass interval of the youngest Galactic open clusters.
5 Conclusions
We have presented a combination of the spectroscopic and photometric studies of the disc cluster population in seven spiral galaxies. Our primary goal was to derive spectroscopic information on star forming regions (extinction, chemical abundance, relative contributions of nebular continuum and emission lines to the total observed flux) and photometric information on young stellar groupings (true colours, luminosity, mass, age) embedded in H ii regions.
We estimated the oxygen and nitrogen abundances and the electron temperatures in 80 out of 102 H ii regions in seven spiral galaxies.
We determined the parameters of the radial distribution of the oxygen and nitrogen abundances in the discs of six galaxies. The abundances in NGC 783, NGC 2336, NGC 6217, and NGC 7678 are measured for the first time.
We obtained magnitudes and colour indices for 101 SF regions.
We found the criteria for which the condition is not performed in the SF region.
We estimated masses and ages for 63 star forming regions. The regions have ages from 1 to 10 Myr, the most part of them are younger than 6 Myr. The derived masses of young stellar groupings range from to . More than of groupings have masses between and .
Acknowledgement
The authors acknowledge the usage of the HyperLeda data base (http://leda.univ-lyon1.fr), the NASA/IPAC Extragalactic Database (http://ned.ipac.caltech.edu), and the Padova group online server CMD (http://stev.oapd.inaf.it). This study was supported by the Russian Science Foundation (project no. 14–22–00041).
References
- Artamonov et al. (1997) Artamonov B. P., Bruevich V. V., Gusev A. S. (1997) ARep 41, 577
- Artamonov et al. (1999) Artamonov B. P., Badan Yu. Yu., Bruyevich V. V., Gusev A.S. (1999) ARep 43, 377
- Belley and Roy (1992) Belley J., Roy J.-R. (1992) ApJS 78, 61
- Bessell (1990) Bessell M. S. (1990) PASP 102, 1181
- Bruevich et al. (2007) Bruevich V. V., Gusev A. S., Ezhkova O. V. et al. (2007) ARep 51, 222
- Efremov and Elmegreen (1998) Efremov Yu. N., Elmegreen B. G. (1998) MNRAS 299, 588
- Elmegreen and Efremov (1996) Elmegreen B. G. Efremov Yu. N. (1996) ApJ 466, 802
- Gusev (2006a) Gusev A. S. (2006a) ARep 50, 167
- Gusev (2006b) Gusev A. S. (2006b) ARep 50, 182
- Gusev and Efremov (2013) Gusev A. S., Efremov Yu. N. (2013) MNRAS 434, 313
- Gusev and Park (2003) Gusev A. S., Park M.-G. (2003) A&A 410, 117
- Gusev et al. (2012) Gusev A. S., Pilyugin L. S., Sakhibov F. et al. (2012) MNRAS 424, 1930
- Gusev et al. (2013) Gusev A. S., Sakhibov F. H., Dodonov S. N. (2013) AstBull 68, 40
- Gusev et al. (2015) Gusev A. S., Gyslyakova S. A., Novikova A. P. et al. (2015) ARep 59, 899
- Gusev et al. (2016) Gusev A. S., Sakhibov F., Piskunov A. E. et al. (2016) MNRAS submitted
- Konstantopoulos et al. (2009) Konstantopoulos I. S., Bastian N., Smith L. J. et al. (2009) ApJ 701, 1015
- Maíz-Apellániz et al. (1998) Maíz-Apellániz J., Mas-Hesse J. M., Muñoz-Tuñón C. et al. (1998) A&A 329, 409
- Paturel at al. (2003) Paturel G., Petit C., Prugniel Ph. et al. (2003) A&A 412, 45
- Reines et al. (2010) Reines A. E., Nidever D. L., Whelan D. G., Johnson K. E. (2010) ApJ 708, 26
- Pilyugin and Mattsson (2011) Pilyugin L. S., Mattsson L. (2011) MNRAS 412, 1145
- Sakhibov and Smirnov (1990) Sakhibov F., Smirnov M. A. (1990) SvA 34, 236