Recurring X-ray Outbursts in the Supernova Impostor SN 2010da in NGC 300
Abstract
We present new observations of the “supernova impostor" SN 2010da using the Chandra X-ray Observatory and the Hubble Space Telescope. During the initial 2010 outburst, the 0.3-10 keV luminosity was observed by Swift to be erg s-1 and faded by a factor of 25 in a four month period. Our two new Chandra observations show a factor of 10 increase in the 0.35-8 keV X-ray flux, from 4 erg s-1 to erg s-1 in 6 months, and the X-ray spectrum is consistent in both observations with a power law photon index of . We find evidence of X-ray spectral state changes: when SN 2010da is in a high-luminosity state, the X-ray spectrum is harder ( ) compared to the low-luminosity state ( ). Using our Hubble observations, we fit the color magnitude diagram of the coeval stellar population to estimate a time since formation of the SN 2010da progenitor system of 5 Myr. Our observations are consistent with SN 2010da being a high-mass X-ray binary (HMXB) composed of a neutron star and a luminous blue variable-like companion, although we cannot rule out the possibility that SN 2010da is an unusually X-ray bright massive star. The 5 Myr age is consistent with the theoretically predicted delay time between the formation of a massive binary and the onset of the HMXB phase. It is possible that the initial 2010 outburst marked the beginning of X-ray production in the system, making SN 2010da possibly the first massive progenitor binary ever observed to evolve into an HMXB.
keywords:
X-rays: binaries, individual (SN 2010da) – stars: early-type, massive1 Introduction
On 2010 May 24, an optical transient () was detected in the nearby spiral galaxy NGC 300 (Monard, 2010) and given the supernova (SN) designation SN 2010da. Subsequent observations revealed that the event was not a true SN, but a supernova impostor111The term SN “impostor” was first coined by Van Dyk et al. (2000), although the category was initially referred to as “Type V” SNe by Zwicky (1964).: optical spectroscopy revealed that the transient was more similar to a luminous blue variable (LBV)-like outburst from a dust enshrouded massive star (Chornock & Berger, 2010; Elias-Rosa et al., 2010a, b). The outburst was additionally observed by the Swift X-ray Telescope, which found an X-ray source with a 0.2-10 keV luminosity of erg s-1 coincident with the position of the optical outburst (Immler et al., 2010). Four months after the outburst, SN 2010da was observed with Chandra and found to have decreased in luminosity by a factor of 25 (Binder et al., 2011).
Prior to the initial outburst, no X-ray emission from the location of SN 2010da had been detected, despite having been observed four times by XMM-Newton. The progenitor optical counterpart was not detected in archival Magellan/Megacam images to a limiting magnitude of 24 AB mag (Berger & Chornock, 2010). The progenitor was, however, detected in the mid-IR by Spitzer and found to be consistent with an LBV-like star enshrouded in dust (Khan et al., 2010); the Swift UVOT observations indicated that some of the dust was destroyed during the outburst (Brown, 2010), although follow-up observations by Prieto et al. (2010) are consistent with some of the circumstellar dust having survived the event. Archival IR observations with Spitzer additionally showed a significant brightening of the progenitor system 6 months prior to the outburst (Laskar et al., 2010). Follow-up spectroscopy with GMOS on Gemini-South reported by Chornock & Berger (2010) in an Astronomer’s Telegram revealed H emission (with a FWHM of 660 km s-1), as well as emission lines of He I, Fe II, Ca II K and H, O I, and He II 4648, with no strong absorption from Na I D seen. However, the spectrum was not formally published, and no other line velocities have been reported. Monitoring of this system with the Magellan/Clay 6.5-m telescope by Chornock et al. (2011) revealed a re-brightening of the optical counterpart from 20.7 on 2011 January 13 to on 2011 October 21. This second re-brightening event was also followed up by Swift, but no accompanying X-ray emission was detected (down to a 0.3-10 keV limiting luminosity of erg s-1; Chornock et al., 2011).
There are three main scenarios that can explain X-ray emission from massive stars: intrinsic X-ray emission, colliding winds in binary systems, and accretion onto compact objects. The intrinsic X-ray emission from early type stars is typically thermal in origin with keV and X-ray luminosities of erg s-1 (Lucy et al., 1980; Wang et al., 2007; Skinner et al., 2010). Harder X-ray emission can be produced in a massive binary, where the winds generated from two stars collide and with luminosities in the range of erg s-1 (Mauerhan et al., 2010). Neither intrinsic X-ray emission nor emission arising from a colliding wind has been observed to exceed luminosities of erg s-1 (see Guerrero & Chu, 2008, their Figure 6), and no known LBV has been observed to have an X-ray luminosity above 1034 erg s-1 (Nazé et al., 2012), although the X-ray properties during and immediately following an eruption are largely unknown. The high X-ray luminosities, even when not in optical outburst (2 orders of magnitude higher than even the most luminous colliding wind binaries or single stars), could be explained by the presence of a neutron star (NS) in a binary system as was suggested in Binder et al. (2011), and the presence of the He II 4686 emission line in the optical spectrum of SN 2010da (Chornock & Berger, 2010; Elias-Rosa et al., 2010b; Chornock et al., 2011) is consistent with hotspots in a NS accretion disk (Still et al., 1997; Val Baker et al., 2005; Pearson et al., 2006).
Although the high X-ray luminosity of SN 2010da is consistent with outbursting high mass X-ray binary (HMXB) with a NS primary and an LBV-like companion (Binder et al., 2011), many details of the system are not yet known. Roughly 60% of known HMXBs contain fast-rotating Be stars and a NS in a wide, moderately eccentric orbit (e.g, BeXBs, Liu et al., 2006), and analysis of the coeval stellar populations have revealed a preferred age of 40-55 Myr (Antoniou et al., 2009; Williams et al., 2013). In these systems, X-ray outbursts reaching erg s-1 are observed to correspond with the periastron passage of the NS (e.g, “Type I” outbursts), and even more luminous “Type II” outbursts are observed to last over several orbital periods (Reig, 2008). HMXBs containing supergiant OB companions are less numerous, and most are thought to undergo bright ( erg s-1) and short X-ray flares lasting from minutes to hours (see Ducci et al., 2014, and references therein). Swift monitoring of supergiant fast X-ray transients (SFXTs) has revealed that shorter X-ray flares are frequently part of much longer outburst events, which may last for several days (Romano et al., 2007; Sidoli et al., 2008; Romano et al., 2008). The mechanism by which these flares are produced is not certain, although eruptions from the donor star or changes in the stellar wind properties may contribute to the observed X-ray variability (Ducci et al., 2014, and references therein).
We have obtained two new Chandra observations of SN 2010da, as well as four orbits on the Hubble Space Telescope (HST). This is the first time the SN 2010da region has been imaged with HST, and SN 2010da is clearly detected in both new Chandra observations. By analyzing the resolved stellar population in the vicinity of SN 2010da, we are able to put limits on the age of the system. Throughout this work, we assume a distance to NGC 300 of 2.0 Mpc (Dalcanton et al., 2009). Our observations and data reduction procedures are described in Section 2. In Section 3 we present an analysis of the X-ray data, including imaging, spectral fitting, and variability measurements. In Section 4 we present optical imaging of the companion star and constrain the age of the SN 2010da system. We conclude with a discussion of our findings in Section 5.
| Obs. ID | Date | Exposure | # Sources Used | rms Residuals | SN 2010da Position | Net Counts | |
|---|---|---|---|---|---|---|---|
| Time (ks) | for Alignment | (arcsec) | R.A. (J2000) | Decl. (J2000) | (0.35-8 keV) | ||
| (1) | (2) | (3) | (4) | (5) | (6) | (7) | (8) |
| 12238 | 2010 Sept. 24 | 63.0 | 7 | 0267 | 00:55:04.87 | -37:41:44.1 | 779 |
| 16028 | 2014 May 16-17 | 63.9 | 5 | 0429 | 00:55:04.93 | -37:41:43.9 | 255 |
| 16029 | 2014 Nov. 17-18 | 61.3 | 9 | 0423 | 00:55:04.83 | -37:41:43.6 | 13712 |
 |
2 Observations and Data Reduction
2.1 X-ray Observations from Chandra
Two new 65 ks observations of the nearby Sculptor group galaxy NGC 300 were obtained with the Chandra Advanced CCD Imaging Spectrometer (ACIS-I) on 2014 May 16-17 and 2014 November 17-18. An additional 65 ks observation with ACIS-I from 2010 is additionally available in the literature (Binder et al., 2011). All three observations contained SN 2010da within the field of view. All three exposures were reprocessed from the evt1 level files with the Chandra Interactive Analysis of Observations (CIAO) software package version 4.6.1 and CALDB version 4.6.3 using the task chandra_repro. We inspected background light curves for all three observations and did not find any significant flaring events. The task lc_clean and 5 clipping was used to generate good time intervals (GTIs) for each observation, and all event data were filtered on these GTIs.
We performed relative astrometry to align the Chandra evt2 data for all three observations to the USNO-B1.0 catalog using wcs_match and wcs_update in CIAO, and fluximage was used to construct exposure maps for all three exposures. We produced exposure-corrected images using a custom instrument map, where we assume a power-law spectrum with =1.7 absorbed by the average foreground column density = 4.09 cm-2 (Kalberla et al., 2005, appropriate for both XRBs and AGN). The wavdetect task was used to detect point sources, and sources with a signal-to-noise ratio were considered significant.
Table 1 provides an observation log of all three observations of SN 2010da, including: the observation ID number (hereafter referred to as the “ObsID”), the date of the observation, the effective exposure time, number of sources used for our relative astrometry, the root-mean-square (rms) residuals for our alignment after aligning to USNO-B1.0, the wavdetect position of the X-ray point source (RA and Decl.), and the number of 0.35-8 keV net counts detected in each ObsID. SN 2010da was detected at high significance in all three observations, at positions in excellent agreement with the position reported in SIMBAD (Wenger et al., 2000).
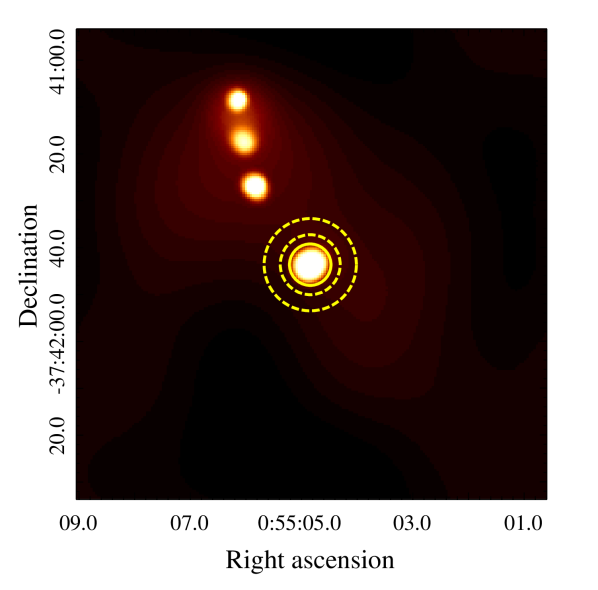
Figure 1 shows the exposure-corrected, adaptively smoothed 0.35-8 keV Chandra image of SN 2010da, generated using the CIAO task csmooth, from the combined image from all three observations (hereafter referred to as the “merged” image). To determine source and background extraction regions, we extracted the 0.35-8 keV radial surface brightness profile centered on the position of SN 2010da. The circular source extraction region was defined by the radius that enclosed 90% of the Chandra point spread function (PSF) at the source position. The background region was a circular annulus with the inner radius set at the distance where the surface brightness profile reached the background level. The outer radius was determined such that the source and background regions contained roughly equal numbers of pixels. Source and background regions were visually inspected to ensure that no obvious spurious sources were contained within either region. Three fainter X-ray sources were detected in the merged image, but were outside our source and background extraction regions.
2.2 Optical Observations from HST
In addition to our two new Chandra exposures, we obtained HST imaging to study the resolved stellar populations in the immediate vicinity of SN 2010da. The observations were taken with ACS on 2014 July 2 using the and filters and on 2014 September 5 using the UVIS filter.
To measure resolved stellar photometry in our HST images, we apply the same technique as used for the ACS imaging of the Panchromatic Hubble Andromeda Treasury (Williams et al., 2014). Briefly, we used the point spread function photometry package DOLPHOT (an updated version of HSTPHOT; Dolphin, 2000). In DOLPHOT, all of the individual CCD exposures are aligned and stacked in memory to search for any significant peaks, and then each significant peak above the background level is fitted with the appropriate point spread function. The measurements are corrected for charge transfer efficiency and calibrated to infinite aperture. The measurements are then combined into a final measurement of the photometry of the star, and include a combined value for all data in each band for the count rate, rate error, VEGA magnitude and error, background, of the PSF fit, sharpness, roundness, crowding, and signal-to-noise. For the photometry reported here, we use the combined VEGA magnitude in each observed band.
To directly compare our X-ray observations with the optical ones, we first needed to place both sets of observations on the same coordinate system. Directly aligning both the Chandra and HST images was not reliable due to the difficulty matching X-ray sources with optical counterparts in the HST field. We therefore aligned both the X-ray and optical images to the same large-field optical reference image and coordinate system. To do this, we retrieved a publicly-available -band image from NED222http://ned.ipac.caltech.edu/ (Larsen & Richtler, 1999). The reference -band image was aligned using the USNO-B1.0 catalog using the positions of six stars. The IRAF task ccmap was used to compute the plate solution and to update the image header with corrected WCS information; the root-mean square (rms) residuals of the fit were 016 in both right ascension and in declination. We next aligned our HST fields to the ground-based -band image by identifying five matched sources with the USNO-B1.0 catalog. The resulting positional uncertainty in our HST field is 021 in right ascension and 017 in declination.
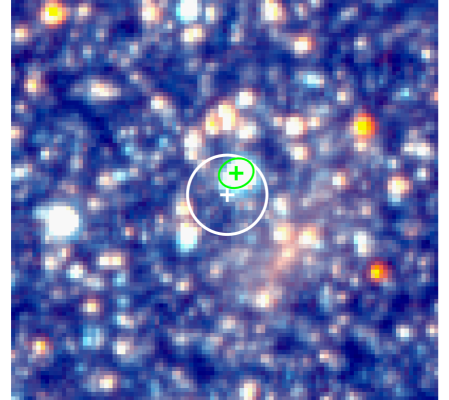
Figure 2 shows a 5′′ 5′′, RGB rendered image of the optical counterpart. To create an RGB-rendered image from our HST observations, the image is set to the red channel, the filter is used for the green channel, and the blue channel is estimated by taking . The X-ray error circle is shown in white and has a radius of 047. The optical counterpart is detected at R.A. (J2000) 00:55:0.482 and Decl. (J2000) -37:41:43.0, with and magnitudes of and . This is comparable to the AB mag measured in 2011 January (ATel #3726; Chornock et al., 2011), before the star exhibited a re-brightening of 2 mag by October of the same year (ATels #2636 and 2637 Chornock & Berger, 2010; Elias-Rosa et al., 2010a, b).
3 Analysis of the Chandra X-ray Observations
Directly fitting the X-ray spectrum of SN 2010da is not feasible for the ObsID 16028 observation, as only 25 net counts were detected in the 0.35-8 keV band. We extract spectra and response files for the ObsID 16029 observation (containing 140 net counts) in the 0.35-8 keV band using specextract, and XSPEC (Arnaud, 1996) v.12.6.0q was used to perform all spectral fitting. The spectrum was fit using two methods: binning the spectrum to contain 10 counts per bin and using standard statistics, and fitting the unbinned spectrum using -statistics (Cash, 1979). When using -statistics, the XSPEC command “goodness” was used to generate Monte Carlo realizations of the SN 2010da spectrum using the current best-fit model and return the percentage of simulated spectra that had a fit statistic less than that obtained from the fit to the observed data. Values near 50% are indicative of a model that well describes the observed data (very low percentages indicate that the data is over-parameterized by the assumed model, while very high percentages indicate the model is a poor fit to the data). Both methods yielded similar fit parameters; we report the best-fit parameters and goodness of fit statistic obtained by the fitting method.

The ObsID 16029 spectrum was found to be hard, similar to what was observed in ObsID 12238 (Binder et al., 2011) and during the initial outburst with Swift (Immler et al., 2010). We first fit the spectrum with two simple models: a power law and a blackbody, both with a column of neutral absorption fixed at the Galactic column ( = 4.09 cm-2; Kalberla et al., 2005). The power law model was consistent with a photon index of (/dof = 16/11), and the simple blackbody model yielded a best-fit temperature of keV and a /dof = 18/11. Allowing the absorbing column to vary did not improve the quality of either fit.
In addition to significant hard X-ray emission near 6-8 keV, the spectrum shows an excess of soft emission near 0.7-1 keV. We therefore added a soft blackbody component to our simple power law ( 0) model. We find keV and /dof = 5/8, and find an upper limit on the absorbing column of cm-2. Nearly identical fit parameters are found when we replace the blackbody component with a thermal bremsstrahlung component. We used the XSPEC routine ftest to compare the power law-only model to the power law plus thermal component model, and found an -probability of 2%. We therefore find marginal evidence of both thermal and hard X-ray emission in the spectrum of SN 2010da. The predicted model (unabsorbed) 0.35-8 keV flux is erg s-1 cm-2, corresponding to an unabsorbed luminosity of erg s-1 at the distance of NGC 300 (comparable to what was observed in ObsID 12238), with 90% of the X-ray flux originating in the power law component. The 0.35-8 keV spectrum of SN 2010da, with the best-fit model superimposed, is shown in Figure 3.
Although we cannot directly model the X-ray spectrum of ObsID 16028, we can use X-ray hardness ratios to search for evidence of spectral variability as a function of the observed flux. We define a hardness ratio as , where is defined as the medium energy 1-2 keV band and is defined as the hard 2-8 keV band. These energy bands were chosen because the SN 2010da count rate in the soft 0.35-1 keV band was low in all three observations, leading to large uncertainties in the hardness ratio when the soft band was used. Using WebPIMMS, we estimated the Chandra ACIS-I count rates in the and bands for a source with power law indices ranging from (as our spectral fitting indicates that absorption intrinsic to the source is low, we fix in our calculations to the Galactic column) and computed the corresponding hardness ratios. Our calculations are summarized in Table 2.
| Power Law | (H-M)/(H+M) |
|---|---|
| (1) | (2) |
| 0.0 | 0.59 |
| 0.2 | 0.54 |
| 0.4 | 0.46 |
| 0.5 | 0.42 |
| 0.8 | 0.29 |
| 1.0 | 0.20 |
| 1.2 | 0.12 |
| 1.5 | 0.00 |
| 2.0 | -0.24 |
| 2.5 | -0.43 |
Our measured hardness ratios for SN 2010da using the definition above are 0.56 in ObsID 12238, 0.12 in ObsID 16028, and 0.60 in ObsID 16029. The uncertainties were estimated from the (assumed Poisson) uncertainties in the count rate in each energy band. The hardness ratios in ObsID 12238 and 16029, when the 0.35-8 keV X-ray luminosity was a few erg s-1, are similar, while the hardness ratio measured when SN 2010da was fainter is consistent with a slightly softer spectrum. Using the predicted values of the hardness ratio, we infer the power law photon index during ObsID 16028 to be . The inferred values of for the two more luminous detections are consistent with the results of our spectral modeling. Using the observed 0.35-8 keV count rate and the inferred value of for ObsID 16028, we estimate the corresponding unabsorbed luminosity during this observation to be erg s-1.
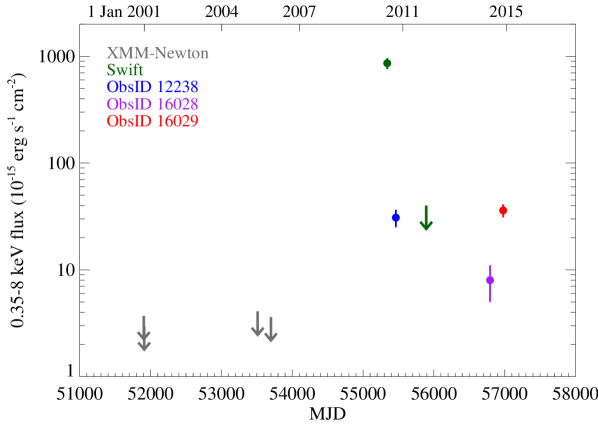
Figure 4 shows the long-term luminosity evolution of SN 2010da, constructed using all available XMM-Newton, Swift, and Chandra data. Prior to the optical outburst that led to this source’s discovery, it was undetected in four XMM-Newton exposures; the 3 upper limits were estimated using the Flux Limits from Images from XMM-Newton (FLIX)333http://www.ledas.ac.uk/flix/flix.html. The more recent Swift observation, taken in 2011 following the observed re-brightening of the optical companion, also failed to detect SN 2010da, although the exposure was significantly shallower than the Chandra observations. The upper limits in Figure 4 represent 3 significance. To search for rapid variability in SN 2010da, we extracted 0.35-8 keV light curves from all three Chandra observations using the CIAO tool dmextract. The light curves were analyzed using the Gregory-Loredo variability program glvary in CIAO, and no evidence of rapid variability was found in any of the observations (the probability of the light curves being variable was 17% in all observations). The lack of rapid variability is likely due to the low number of counts observed in each observation. In ObsID 16029, the X-ray emission from SN 2010da would have needed to vary by a factor of 20 to be detected at 95% significance. We estimate that in order to observe variability with a factor of 5 change over a few ks at 95% confidence would require 400 counts.
4 The Age of SN 2010da
Most stars form in stellar clusters, which share a common age and metallicity (Lada & Lada, 2003), and these stars remain spatially correlated on scales of up to 100 pc for 100 Myr after their formation (Bastian & Goodwin, 2006). The age of an individual HMXB can therefore be recovered from the color-magnitude diagram (CMD) of the surrounding coeval stellar population. Williams et al. (2013) used this technique to measure the ages of 18 HMXB candidates in NGC 300 and NGC 2403, and found a typical HMXB age of 40-55 Myr. This same approach was also used to constrain the mass of the 2008 optical transient in NGC 300 (Gogarten et al., 2009).
 |
 |
We use the same technique here to determine the age of SN 2010da; for the remainder of this work, we define the age as the time since the formation of the progenitor binary. The CMD for all stars located within 50 pc of SN 2010da was modeled using the MATCH software package (Dolphin, 2002), which produces a star formation history (SFH) that best describes the observed CMD. The fitting technique is described in detail in Williams et al. (2009), and has been applied to a large number of galaxies as part of the ANGST survey (Dalcanton et al., 2009). Updates to the uncertainty estimation are described in Williams et al. (2013). In addition to deriving the SFH at the location of SN 2010da, we also find the best-fitting mean foreground extinction to be , equivalent to cm-2 (Güver & Özel, 2009). This value is consistent with the low absorbing columns found in Section 3.
We additionally include differential reddening in the model Hess diagrams using the MATCH dAv flag. We find a differential extinction (e.g., internal to NGC 300) of 0.4 mag at the location of SN 2010da, indicating that the majority of the dust surrounding the system prior to the 2010 outburst was indeed destroyed (e.g., Berger & Chornock, 2010, found a value of mag for the progenitor system). With the extinction values applied, we then run a series of 100 Monte Carlo tests. To assess the full combination of systematic errors due to model deficiencies as well as random errors due to the depth and size of the sample, realizations of the best-fitting model solution are fitted with the models shifted in bolometric magnitude and effective temperature (Dolphin, 2012, 2013). These shifts account for the uncertainties due to any potential systematic offsets between the data and models.
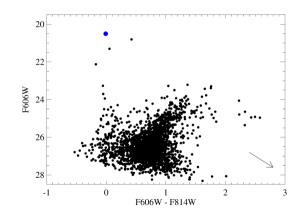
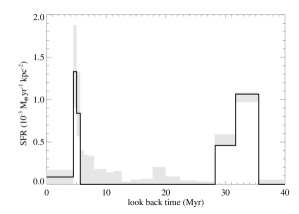
The CMD and resulting SFH, with the full error estimate, of the young coeval stellar population are shown in Figure 5. The SFH shows a sharp increase in the star formation rate (SFR) at 5 Myr, and a second peak at 35 Myr. An age of 5 Myr is consistent with zero-age main sequence mass of 20 . Foley et al. (2011) compared the and magnitudes of two SN impostor progenitors to stellar evolutionary tracks of Schaller et al. (1992) to determine the masses of the progenitor stars prior to outburst (their Figure 3); using the and , we can constrain the mass of the LBV-like star to 15-25 . The optical companion is most likely an LBV and not a Be star; thus, the sibling population is likely the young 5 Myr one.
5 Discussion and Conclusions
5.1 The Origin of the X-ray Outbursts
The new Chandra X-ray observations provide the first evidence that the SN 2010da X-ray source, like the optical companion, may exhibit recurring outbursts in which the spectrum hardens at high luminosity. Furthermore, it is not known whether these X-ray outbursts occur simultaneously with brightening or erupting events from the LBV-like star, as the only simultaneous optical and X-ray observations are those obtained by the Swift XRT/UVOT during the initial 2010 outburst. There are two possible scenarios for the origin of the X-rays from SN 2010da: either the X-rays are produced by eruptions or mass ejection events from a massive star or massive binary, or they originate from accretion onto a compact object. Our observations alone cannot definitively rule out the stellar origin scenario. However, if the X-ray outbursts are from a massive star (or massive stellar binary), it would be extremely interesting given that such high X-ray luminosities have not yet been reported for any class of massive star (even in the case of highly magnetized massive stars; see Petit et al., 2015, and references therein).
This is opposite of what is observed in black hole transients, in which the low-luminosity state is associated with a harder energy spectrum dominated by Comptonized emission that then transitions to a higher luminosity dominated by a softer accretion disk component (McClintock & Remillard, 2006). Recently, some low-mass X-ray binaries with NS primaries have been observed to follow a similar low/hard-high/soft pattern (Muñoz-Darias et al., 2014). If SN 2010da is indeed an HMXB, the observed X-ray emission may be related to the orbital period of the NS. No rapid variability was observed in any of our three Chandra observations, indicating that the outburst duration is likely longer than the 60 ks Chandra exposure times. Type I outbursts are commonly observed in HMXBs, reach peak X-ray luminosities of a few 1037 erg s-1 for 20-30% of the orbital period, and exhibit simultaneous brightening in the optical (Reig, 2008). In known BeXBs, the orbital periods typically range from 20 to several hundred days (Reig, 2011, and references therein), while HMXBs with supergiant companions can have orbital periods of 10 days or less (Reig, 2011, their Figure 2). Assuming a NS mass of 1.4 , the observed X-ray luminosities can be explained by mass accretion rates of 2-15% of the Eddington limit.
Whether the X-ray outbursts in SN 2010 are periodic cannot be determined from the available data. Further optical and X-ray monitoring of this system is needed to determine whether the X-ray outbursts are periodic, if they correspond to optical outbursts, and may help to distinguish between the stellar or compact object scenarios for the observed X-ray emission.
5.2 Binary Interactions as Drivers of LBV Outbursts
LBVs represent a late stage of massive star evolution, lasting only 104 yr (Humphreys & Davidson, 1994; Smith & Owocki, 2006; Harpaz & Soker, 2009). Their frequent eruptions can often mimic SN explosions, leading to numerous LBVs with SN designations (Smith & Owocki, 2006; Davidson & Humphreys, 2012; Kochanek et al., 2012). While the continually growing list of “SN impostors” is likely a heterogeneous mix of many varieties of transient sources, a large fraction of these events are likely related to eruptions of LBVs and other massive stars.
There is growing evidence that binary companions play a significant role in setting the conditions for giant LBV eruptions to occur (e.g., through tidal interactions, see Kashi et al., 2013, and references therein). For example, Car and P Cygni (Kashi, 2010; Kashi & Soker, 2010), SN 2009ip in NGC 7259 (Kashi et al., 2013), and the LBV + Wolf-Rayet binary in NGC 3432 (Pastorello et al., 2010) are all systems where observed outbursts from the LBV can be explained by disturbances from a companion. While other impostors are known or suspected binary systems, the X-ray properties of these objects is largely unknown. If SN 2010da is a compact object accreting material from an LBV, the extreme gravitational environment of the NS would make SN 2010da an especially valuable target to study the effects of binary interactions and the evolution of massive close binaries. Alternatively, if the X-ray emission from SN 2010da originates from a massive star, it could provide a useful laboratory for studying recurring mass ejection events on a scale not observed in Galactic sources.
5.3 The Onset of the HMXB Phase?
One extremely interesting possibility is that we are witnessing the birth of an HMXB. HMXBs dominate the X-ray emission from non-active star forming galaxies, and models of HMXB formation indicate that X-ray production first arises in these systems 5 Myr after the progenitor binary forms (Linden et al., 2010; Postnov & Yungelson, 2014). Although the typical timescale from compact object formation until X-ray production is expected to be 1-2 Myr (e.g., see Shtykovskiy & Gilfanov, 2005; Bodaghee et al., 2012, and references therein), other observations of young HMXBs, notably Cir X-1 (Heinz et al., 2013), indicate that the onset of the HMXB phase may occur much more rapidly (within yr). Stellar evolution models have been used to constrain the ages of dozens of HMXBs (including those in NGC 300 Williams et al., 2013) and found them to have an average age of 40-55 Myr. In the LMC, HMXBs are found to only be associated with OB associations that are at least 10 Myr old (Shtykovskiy & Gilfanov, 2005).
With an age (e.g., the time since the formation of the progenitor binary) of 5 Myr, SN 2010da represents an extremely young X-ray emitting HMXB. No X-ray emission was detected from the location of SN 2010da prior to the 2010 outburst, despite having been observed previously by both XMM-Newton (Carpano et al., 2005) and ROSAT (Read & Pietsch, 2001). It is possible that the 2010 outburst represented the initial onset of the HMXB phase in this system, possibly making SN 2010da the first massive evolved binary ever directly observed to enter the HMXB phase.
Acknowledgements
We would like to thank the anonymous referee for suggestions that helped improve this manuscript. Support for this work was provided by the National Aeronautics and Space Administration through Chandra Award Number G04-15088X issued by the Chandra X-ray Observatory Center, which is operated by the Smithsonian Astrophysical Observatory for and on behalf of the National Aeronautics and Space Administration under contract NAS8-03060. TJG and PPP acknowledge support under NASA contract NAS8-03060. This research has made use of the NASA/IPAC Extragalactic Database (NED) which is operated by the Jet Propulsion Laboratory, California Institute of Technology, under contract with the National Aeronautics and Space Administration. This research has made use of the SIMBAD database, operated at CDS, Strasbourg, France.
References
- Antoniou et al. (2009) Antoniou V., Hatzidimitriou D., Zezas A., Reig P., 2009, ApJ, 707, 1080
- Arnaud (1996) Arnaud K. A., 1996, in Jacoby G. H., Barnes J., eds, Astronomical Society of the Pacific Conference Series Vol. 101, Astronomical Data Analysis Software and Systems V. p. 17
- Bastian & Goodwin (2006) Bastian N., Goodwin S. P., 2006, MNRAS, 369, L9
- Berger & Chornock (2010) Berger E., Chornock R., 2010, The Astronomer’s Telegram, 2638, 1
- Binder et al. (2011) Binder B., Williams B. F., Kong A. K. H., Gaetz T. J., Plucinsky P. P., Dalcanton J. J., Weisz D. R., 2011, ApJ, 739, L51
- Bodaghee et al. (2012) Bodaghee A., Tomsick J. A., Rodriguez J., James J. B., 2012, ApJ, 744, 108
- Brown (2010) Brown P. J., 2010, The Astronomer’s Telegram, 2633, 1
- Carpano et al. (2005) Carpano S., Wilms J., Schirmer M., Kendziorra E., 2005, A&A, 443, 103
- Cash (1979) Cash W., 1979, ApJ, 228, 939
- Chornock & Berger (2010) Chornock R., Berger E., 2010, The Astronomer’s Telegram, 2637, 1
- Chornock et al. (2011) Chornock R., Czekala I., Berger E., 2011, The Astronomer’s Telegram, 3726, 1
- Dalcanton et al. (2009) Dalcanton J. J., et al., 2009, ApJS, 183, 67
- Davidson & Humphreys (2012) Davidson K., Humphreys R. M., 2012, Nature, 486, 1
- Dolphin (2000) Dolphin A. E., 2000, PASP, 112, 1383
- Dolphin (2002) Dolphin A. E., 2002, MNRAS, 332, 91
- Dolphin (2012) Dolphin A. E., 2012, ApJ, 751, 60
- Dolphin (2013) Dolphin A. E., 2013, ApJ, 775, 76
- Ducci et al. (2014) Ducci L., Doroshenko V., Romano P., Santangelo A., Sasaki M., 2014, A&A, 568, A76
- Elias-Rosa et al. (2010a) Elias-Rosa N., Mauerhan J. C., van Dyk S. D., 2010a, Central Bureau Electronic Telegrams, 2292, 2
- Elias-Rosa et al. (2010b) Elias-Rosa N., Mauerhan J. C., van Dyk S. D., 2010b, The Astronomer’s Telegram, 2636, 1
- Foley et al. (2011) Foley R. J., Berger E., Fox O., Levesque E. M., Challis P. J., Ivans I. I., Rhoads J. E., Soderberg A. M., 2011, ApJ, 732, 32
- Galloway et al. (2008) Galloway D. K., Muno M. P., Hartman J. M., Psaltis D., Chakrabarty D., 2008, ApJS, 179, 360
- Gogarten et al. (2009) Gogarten S. M., Dalcanton J. J., Murphy J. W., Williams B. F., Gilbert K., Dolphin A., 2009, ApJ, 703, 300
- Grindlay et al. (1980) Grindlay J. E., et al., 1980, ApJ, 240, L121
- Guerrero & Chu (2008) Guerrero M. A., Chu Y.-H., 2008, ApJS, 177, 216
- Güver & Özel (2009) Güver T., Özel F., 2009, MNRAS, 400, 2050
- Harpaz & Soker (2009) Harpaz A., Soker N., 2009, New Astron., 14, 539
- Heinz et al. (2013) Heinz S., et al., 2013, ApJ, 779, 171
- Hoffman et al. (1980) Hoffman J. A., Cominsky L., Lewin W. H. G., 1980, ApJ, 240, L27
- Humphreys & Davidson (1994) Humphreys R. M., Davidson K., 1994, PASP, 106, 1025
- Immler et al. (2010) Immler S., Brown P., Russell B. R., 2010, The Astronomer’s Telegram, 2639, 1
- Kajava et al. (2014) Kajava J. J. E., et al., 2014, MNRAS, 445, 4218
- Kalberla et al. (2005) Kalberla P. M. W., Burton W. B., Hartmann D., Arnal E. M., Bajaja E., Morras R., Pöppel W. G. L., 2005, A&A, 440, 775
- Kashi (2010) Kashi A., 2010, MNRAS, 405, 1924
- Kashi & Soker (2010) Kashi A., Soker N., 2010, ApJ, 723, 602
- Kashi et al. (2013) Kashi A., Soker N., Moskovitz N., 2013, MNRAS, 436, 2484
- Khan et al. (2010) Khan R., Stanek K. Z., Kochanek C. S., Thompson T. A., Prieto J. L., 2010, The Astronomer’s Telegram, 2632, 1
- Kochanek et al. (2012) Kochanek C. S., Szczygieł D. M., Stanek K. Z., 2012, ApJ, 758, 142
- Lada & Lada (2003) Lada C. J., Lada E. A., 2003, ARA&A, 41, 57
- Larsen & Richtler (1999) Larsen S. S., Richtler T., 1999, A&A, 345, 59
- Laskar et al. (2010) Laskar T., Berger E., Chornock R., 2010, The Astronomer’s Telegram, 2648, 1
- Linden et al. (2010) Linden T., Kalogera V., Sepinsky J. F., Prestwich A., Zezas A., Gallagher J. S., 2010, ApJ, 725, 1984
- Liu et al. (2006) Liu Q. Z., van Paradijs J., van den Heuvel E. P. J., 2006, A&A, 455, 1165
- Lucy et al. (1980) Lucy L. B., White R. L., 1980, ApJ, 241, 300
- Mauerhan et al. (2010) Mauerhan J. C., Muno M. P., Morris M. R., Stolovy S. R., Cotera A., 2010, ApJ, 710, 706
- McClintock & Remillard (2006) McClintock J. E., Remillard R. A., 2006, Black hole binaries. pp 157–213
- Monard (2010) Monard L. A. G., 2010, Central Bureau Electronic Telegrams, 2289, 1
- Muñoz-Darias et al. (2014) Muñoz-Darias T., Fender R. P., Motta S. E., Belloni T. M., 2014, MNRAS, 443, 3270
- Nazé et al. (2012) Nazé Y., Rauw G., Hutsemékers D., 2012, A&A, 538, A47
- Pastorello et al. (2010) Pastorello A., et al., 2010, MNRAS, 408, 181
- Pearson et al. (2006) Pearson K. J., et al., 2006, ApJ, 648, 1169
- Petit et al. (2015) Petit V., et al., 2015, MNRAS, 453, 3288
- Postnov & Yungelson (2014) Postnov K. A., Yungelson L. R., 2014, Living Reviews in Relativity, 17, 3
- Prieto et al. (2010) Prieto J. L., Bond H. E., Kochanek C. S., Khan R., Stanek K. Z., Thompson T. A., 2010, The Astronomer’s Telegram, 2660, 1
- Read & Pietsch (2001) Read A. M., Pietsch W., 2001, A&A, 373, 473
- Reig (2008) Reig P., 2008, A&A, 489, 725
- Reig (2011) Reig P., 2011, Ap&SS, 332, 1
- Romano et al. (2007) Romano P., Sidoli L., Mangano V., Mereghetti S., Cusumano G., 2007, A&A, 469, L5
- Romano et al. (2008) Romano P., et al., 2008, ApJ, 680, L137
- Schaller et al. (1992) Schaller G., Schaerer D., Meynet G., Maeder A., 1992, A&AS, 96, 269
- Schlafly & Finkbeiner (2011) Schlafly E. F., Finkbeiner D. P., 2011, ApJ, 737, 103
- Shtykovskiy & Gilfanov (2005) Shtykovskiy P., Gilfanov M., 2005, A&A, 431, 597
- Sidoli et al. (2008) Sidoli L., et al., 2008, ApJ, 687, 1230
- Skinner et al. (2010) Skinner S. L., Zhekov S. A., Güdel M., Schmutz W., Sokal K. R. 2010, AJ, 139, 825
- Smith & Owocki (2006) Smith N., Owocki S. P., 2006, ApJ, 645, L45
- Still et al. (1997) Still M. D., Quaintrell H., Roche P. D., Reynolds A. P., 1997, MNRAS, 292, 52
- Val Baker et al. (2005) Val Baker A. K. F., Norton A. J., Quaintrell H., 2005, A&A, 441, 685
- Van Dyk et al. (2000) Van Dyk S. D., Peng C. Y., King J. Y., Filippenko A. V., Treffers R. R., Li W., Richmond M. W., 2000, PASP, 112, 1532
- Wang et al. (2007) Wang J. X., et al., 2007, ApJ, 669, 765
- Wenger et al. (2000) Wenger M., et al., 2000, A&AS, 143, 9
- Williams et al. (2009) Williams B. F., et al., 2009, AJ, 137, 419
- Williams et al. (2013) Williams B. F., Binder B. A., Dalcanton J. J., Eracleous M., Dolphin A., 2013, ApJ, 772, 12
- Williams et al. (2014) Williams B. F., et al., 2014, ApJS, 215, 9
- Zwicky (1964) Zwicky F., 1964, ApJ, 139, 514