First-principles derived complexion diagrams for phase boundaries in doped cemented carbides
Abstract
This article reviews a method for calculating an equilibrium interfacial phase diagram depicting regions of stability for different interface structures as function of temperature and chemical potentials. Density functional theory (DFT) is used for interfacial energies, Monte Carlo simulations together with cluster expansions based on DFT results for obtaining configurational free energies, and CALPHAD-type modeling for describing the thermodynamic properties of the adjoining bulk phases. An explicit case, vanadium doped cemented carbides, is chosen to illustrate the progress in the research field and the interfacial diagram, a complexion diagram, for the phase boundary WC(0001)/Co is constructed as function of temperature and chemical potentials.
keywords:
complexion , interfacial phase diagram , density functional theory , thermocalc , cemented carbides , doping , grain growth1 Introduction
Computational techniques have been developed to model properties of complex multicomponent materials. Methods such as CALPHAD are used to describe the thermodynamic phase behavior [1]. Experimental data and in some cases results from first-principles methods are then utilized in an efficient way to compute the corresponding phase diagrams.
For a polycrystalline material, not only the phase behavior is important, but also the structure, composition and energetics of its internal interfaces are decisive for the properties of the material. The study of interfaces is hence of great importance and is a growing and rapidly advancing field within materials science. It has been well established that the appearance of certain interfacial “phases” different from those of the adjoining bulk phases (e. g. segregation structures, amorphous wetting films, etc.) can be understood from thermodynamic considerations [2, 3, 4, 5, 6, 7, 8, 9, 10, 11, 12, 13, 14, 15]; the disparate interfacial phases are equilibrium states stabilized by the interface. The term complexion has been suggested to separate these interfacial phases from ordinary bulk phases [16, 17, 18].
Development of computational methods to derive the corresponding interfacial phase diagrams has therefore become important. In contrast to the bulk behavior experimental data for the interfacial properties are scarce and hence one may expect results from first-principles methods to become more critical and decisive in the development of interfacial phase diagrams compared with ordinary bulk phase diagrams.
Here we review how interfacial phase diagrams can be constructed by combining results from first-principles density functional theory (DFT) calculations together with thermodynamic modeling of the adjoining bulk phases. An explicit case, vanadium doped cemented carbides, is chosen to illustrate the progress in the research field [5, 8, 10].
2 Cemented carbides
Cemented carbides is a class of materials which consists of fine particles of a carbide cemented into a composite by a binder metal. The most common cemented carbide is produced by combining tungsten carbide (WC) with the binder metal cobalt (Co). Cemented carbides combine excellent hardness with high toughness and wear resistance [19]. They are used in cutting and wear resistant tools and are of considerable industrial importance [20].
The material is produced in a sintering process, in which carbide and metal powders densify into a microstructure of faceted WC grains embedded in the Co binder. Considerable research work has been focused on producing cemented carbides with WC grain sizes in the nanometer scale, since such a fine microstructure has the potential to dramatically improve on the mechanical properties of the material [21]. To mitigate WC grain growth and retain the fine structure of the starting powder, additions of VC, , NbC, TiC, TaC, etc. are made, of which especially VC works effectively as grain growth inhibitor [22]. The effects on microstructure of the additions have to large extent been empirically investigated, but still the exact mechanism behind the grain growth inhibition is unknown.
Several high-resolution electron microscopy studies have shown WC/Co interfaces that contain films with a thickness of a few atomic layers having an atomic arrangement incompatible with the underlying hexagonal WC lattice. The films have been seen especially in VC-doped WC-Co [23, 24, 25, 26, 27, 28, 29, 30, 31, 32], where they have been associated with the cubic VC phase [25]. Thin films in WC/Co interfaces have also been imaged in - [33] and TiC-doped [34] cemented carbides.
It has been suggested, that thin films in WC/Co interfaces hinder the WC grain growth by forming a diffusion barrier for dissolving and/or reprecipitating W atoms [26]. However, the observed thin films at the WC/Co interface in the final material does not necessarily correspond to the equilibrium state during sintering [35]. The sintering process occurs at high temperature – including temperatures above the melting of the Co binder phase – where solubilities of W, C and dopant atoms in Co are high and where the interface region can be expected to be in a state of local chemical equilibrium. During cooling in the end of the sintering cycle, most of the dissolved atoms leave the Co binder phase [36] and reprecipitate onto existing carbide grains. It is thus conceivable that experimentally observed atomic structures and dopant segregation correspond to a low-temperature equilibrium or some frozen-in state from the end of the cooling [37, 38]. However, experimental studies using rapid temperature quench of the samples give strong evidence for the existence of thin films in WC/Co interfaces at the holding temperature during liquid phase sintering [30].
As most of the microstructural development occurs at high temperatures, it is essential to know the equilibrium state of the WC/Co interface in a doped WC-Co system as function of temperature and dopant addition i.e. one has to know the corresponding interfacial phase diagram. Only with this knowledge can a connection between WC growth kinetics and WC/Co interfacial structure and segregation eventually be established.
3 Simplified modeling
WC has a hexagonal lattice structure in cemented carbides. In the phase diagram, WC exists in a very small range of homogeneity with a carbon content corresponding to nearly perfect stoichiometry, meaning that in practice W and C vacancies can be assumed not to occur [39]. Furthermore, the solubility of transition metal atoms in WC is small. For V it is found to be only about 10-3 atomic fractions at 1410 [40].
The hexagonal WC structure is the stable structure over the whole temperature interval relevant for sintering (below 2000). However, a cubic WC phase can be obtained at sufficiently high temperatures (above 2500) [41]. In contrast, the stable structures for other carbides, such as VC, TiC, and TaC, are cubic and the stoichiometry can deviate substantially from perfect.
During sintering, the WC grains develop a faceted triangular shape, bounded by basal {0001} and prismatic {100} planes. Theoretical data for the WC/Co interface energies for the basal and prismatic planes are in the range 0.9-1.5 J/m2 [42]. For the cubic WC structure the WC/Co interface energies are lower, about 0.5 J/m2 for the WC(100)/Co interface [43].
In cemented carbides the stable lattice structure for WC is the hexagonal one. However, due to the lower WC/Co interface energy for cubic WC compared with hexagonal WC, one could speculate that the atomic stacking of the carbide near a WC/Co interface could transform locally into cubic to lower the interface energy. Indeed, experimentally a few layers of cubic stacking has been identified at some WC/Co interfaces in undoped WC-Co [44].
An intriguing scenario is then that in doped cemented carbides at low doping conditions the dopants may preferentially segregate to WC/Co interfaces and locally form intermixed cubic structures at the interface, interface complexions, stabilized by interfacial effects. At higher doping conditions the corresponding cubic carbide phase would precipitate, which may give undesirable properties to the cemented carbide material. With carefully controlled doping it would then be possible to preferentially influence the properties of the interfaces in the cemented carbide, while limiting the precipitation of the cubic carbide phase.
3.1 Simplified modeling
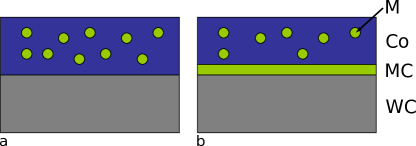
To model the possibility to create intermixed cubic structures, interface complexions, at WC/Co interfaces in doped cemented carbides we start with a very simple model. Consider a sharp interface between WC and the binder phase. The latter consists of mainly Co but also some dissolved metal atoms M, such as V, Ti or Ta, the dopants (see Fig. 1(a)). We then assume that the interface is replaced by a thin film of a cubic MC phase (see Fig. 1(b)). For a sufficiently thick film the interface can be regarded as split into a WC/MC interface and a MC/Co interface separated by a slab of MC. The energy for such a film-covered interface can then be decomposed as
| (1) |
where () is the interface energy between WC and MC (MC and Co). The last term of Eq. (1) represents the energetic cost per layer of building the MC phase and, thus, depends linearly on the number of layers of the film. The energy is the negative of the driving force of nucleation of the bulk MC phase. It is positive if the MC bulk phase is unstable, if we are below the solubility limit of the metal atoms M in the binder phase. We consider coherently strained thin films and the last quantity of Eq. (1), , is the strain energy per layer needed to bring the film into epitaxy with the underlying hexagonal WC phase.
The energy should be compared with the energy of a WC/Co interface not covered by any MC film. The film coveraged interface is stable if and, hence, a necessary condition for film formation in this simplified model is that
| (2) |
i.e. one has to gain interfacial energy when the two interfaces WC/MC and MC/Co are created from the original WC/Co interface. In Tab. 1 we give the result for for V, Ti, and Ta doped materials. The result is obtained from density functional theory (DFT) calculations and some computational details are given in A. In the calculations the bulk phases that are joined together are strained into coherency. The corresponding strain energy is cancelled, so that , , and only represent the chemical contributions to the interface energy. The interface energy can then become negative and to model the true interfaces (see below) the elastic contribution has to be added. For all three dopants; V, Ti, and Ta, is positive and there is a substantial energy gain when the films are formed.
| V | ||||||
|---|---|---|---|---|---|---|
| Ti | ||||||
| Ta |
The positive values of are mainly due to the large interface energy for the WC/Co interface compared with the interface energies containing the cubic carbide phases (cf. Tab.1). An interface energy can be expressed in terms of surface energies and the work of adhesion according to the Dupré equation
| (3) |
In Tab.2 the data both for the WC/Co interface with a basal (0001) hexagonal WC plane and for MC/Co interfaces (M=V, Ti, or Ta) with a cubic (111) plane are presented. Some computational details are given in A. The work of adhesion is a direct measure of the interface bond strength. Both for the hexagonal carbide WC and the cubic carbides MC (M=V, Ti, or Ta) the work of adhesion is similar, the interface bond strengths are similar. However, the surface energy for hexagonal WC is quite large and following the Dupré equation the large WC surface energy implies a large WC/Co interface energy (and vice versa).
The computed interface energies , and in Tab.1 only contain the chemical part. To make the results more realistic the elastic contribution has to be added. In Tab.1 we give the computed values for the elastic energy per layer needed to bring the cubic films into epitaxy with the hexagonal WC phase. The mismatch varies considerably. It is , and for VC, TiC and TaC, respectively, and hence the elastic energy also varies substantially. In Tab.1 we have explicitly added the effect of two cubic layers in the last column. The interface energy gain () is now only positive for VC. The prediction is therefore that for V doped material epitaxial thin film formation is possible, for Ti doped material maybe, but most likely not for Ta doped material [8]§.
| structure | |||||
|---|---|---|---|---|---|
| hexagonal | W | ||||
| cubic | V | ||||
| cubic | Ti | ||||
| cubic | Ta |
3.2 Layer-by-layer approach
The next step in the modeling is to take the atomic scale layered structure into account. The decomposition of in Eq. (1) is valid only if the film is sufficiently thick, so that the interior of the film is bulk-like and the interface energies are well-defined. For thin films, will deviate from the linear dependence on . An atomic-scale layer-by-layer calculation has therefore been performed in Ref. [5]. In Fig. 2 the result for is shown for a stoichiometric cubic VC film on the WC (0001) basal plane. The VC film is stacked in the direction with alternating layers of metal and carbon atoms. All different stacking sequences and the two different terminations of the WC basal plane have been investigated and the results for the lowest energy stacking sequence are presented in Fig. 2 as function of the number of V layers. The theoretically predicted lowest energy stacking sequence for is identical to the stacking sequence suggested from a high resolution transmission electron microscopy (HRTEM) study [28].

The filled circles in Fig. 2 show the result with no energetic cost per layer added to build up the thin film (i.e. ). The result should converge to () for sufficiently thick films (the dashed line). We notice that the layer-by-layer result is close to the asymptotic value already after two V layers. It implies that interface energy gain is essentially obtained already after the addition of two layers. The relevant interactions are short ranged. Additional layers will then only add the energy cost () per layer and we expect to obtain a minimum in energy for a thin film with two V layers.
The energetic cost depends on the temperature and on the chemical composition in the binder phase. At liquid phase sintering temperatures around 1400 and for relevant doping concentrations, varies between 0 and about 0.2 J/m2 (0 to 0.09 eV per formula unit) [5]. This has been determined using the Thermo-Calc software [46] with a database for V additions in the W-C-Co system [47]. We have added () = 0.12 J/m2 per layer (0.055 eV per formula unit) to the data in Fig. 2. The result is shown as open circles. It is clearly seen that the thin film structure has a minimum for 2 layers of V. Furthermore, this minimum will be present over a quite large temperature range. When the temperature is increased/decreased the slope of the dotted line will increase/decrease, but 2 layers of V will be the stable interfacial structure over a large temperature interval. When cooling and approaches zero the VC phase becomes stable and it can precipitate and start to grow, most likely on the thin films at WC/Co interfaces.
The two atomic layer thick VC film at the WC/Co interface is stabilized by interfacial effects and it is thermodynamically stable over a quite large temperature range. For this structure we may use the notion, an interface complexion.
4 Interfacial phase diagram
We now would like to construct the actual interfacial phase diagram. It should describe the equilibrium structure and composition of the WC(0001)/Co interface in vanadium doped cemented carbides as function of the intensive thermodynamic variables temperature , pressure and chemical potentials . For more details, we refer to Ref. [10].
The propensity of the dopant to segregate to the interface is governed by its effect on the interface energy . In general, can be written as [48]
| (4) |
Here, is the Gibbs energy for the considered interface system, which contains a planar interface of area . is the number of atoms in the system of component with a corresponding chemical potential determined by the reservoirs with which the interface is in equilibrium. The equilibrium interfacial state is given by the minimum of under fixed , and .
4.1 Interface structural models
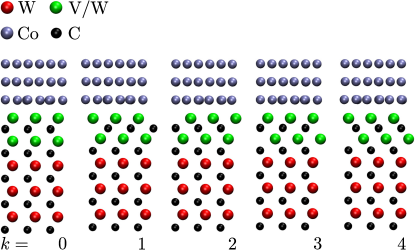
The first step is to define an interface structural model for which an expression of for the WC(0001)/Co interface can be formulated. We are then guided by both results from high-resolution transmission electron microscope (HRTEM) imaging [25, 26] and from theoretical investigations [5]. The interface is assumed to have a layered geometry where each layer has well-defined atomic lattice sites. The structural model contains a set of WC layers with hexagonal stacking, mixed layers, and Co layers describing the binder phase. The mixed layers are in epitaxy with the hexagonal WC layers and consist of two metal layers and a carbon layer in between. The metal layers can have a mixed composition of V and W atoms and the corresponding site fractions are denoted and . We assume that , and hence, we neglect any metal vacancies and assume no Co occupancy in the mixed layers. We also neglect any carbon vacancies in the mixed region. The carbide phase is metal terminated against the binder phase and the Co binder phase may contain dissolved W, V and C atoms. However, in the present modelling we do not explicitly include these dissolved atoms in the binder phase. As usual, the hexagonal WC bulk phase is assumed to be perfectly stoichiometric.
Several different interface structural models are constructed (cf Fig. 3). They are denoted as . The model corresponds to hexagonal stacking in the mixed region and with () we recover the unreconstructed WC(0001)/Co interface without any segregation of V. The model corresponds to cubic stacking in the mixed region and with () the model derived in the layer-by-layer approach [5] (see subsection 3.2) is obtained.
For each structural model there is a corresponding equilibrium interfacial state with energy . The interface energy depends on the composition in the mixed region and the equilibrium energy is obtained by minimizing with respect to that composition. The final equilibrium interface energy and corresponding equilibrium structure are then given by the minimization with respect to
| (5) |
The computation of the interface energy can be separated into three parts, a temperature independent part , a temperature dependent part and an environment dependent part ,
| (6) |
This is schematically illustrated in Fig. 4, where is the Gibbs energy for the interface system and represents the Gibbs energy for a reference system used in the computations.

4.2 Reference states
The Gibbs energy for the reference system can be expressed as
| (7) |
The use of well-defined and suitable reference states with chemical potentials is an important part of the modeling strategy.
In the W-C-Co system, the WC+Co two-phase field borders to the three-phase fields WC+Co+graphite and WC+Co+ for high and low C content, respectively [39] (where is a carbide phase). We use graphite as our reference state for carbon, i.e.
| (8) |
where is the Gibbs energy per atom of graphite. The interface system is in equilibrium with a stoichiometric WC bulk phase, hence
| (9) |
where is the Gibbs energy per formula unit of hexagonal WC.
The amount of V added to the WC-Co system will affect , and thereby the interface system. A maximum of is attained when the addition of V is so large, that a secondary carbide bulk phase forms. For V, this phase corresponds to (at typical sintering temperatures and C contents) a cubic sub-stoichiometric () carbide of NaCl structure. To determine the vanadium reference state we use the corresponding stoichiometric carbide phase VC and define
| (10) |
where is the Gibbs energy per formula unit of fully stoichiometric cubic VC. Finally, for cobalt we use solid fcc Co as reference state,
| (11) |
where is the Gibbs energy per formula unit of fcc Co.
4.3 Temperature independent part
The temperature independent part in Eq. (6) corresponds to the thermodynamic ground state of the interface at K, i.e. the lowest energy configuration for given , , etc. For this part straight-forward DFT calculations are used to compute the energy difference
| (12) |
within the methodology presented in earlier papers [49, 50, 5, 8].
4.4 Temperature dependent part
The temperature dependent part in Eq. (6) can be written as
and it is equal to the difference of temperature dependence of the Gibbs energy between the interface system and the chosen reference system . The temperature dependence of Gibbs energy can be caused by configurational changes, vibrational motion, magnetic and electronic effects as well as melting of the binder phase.
The configurational changes in the solid phases are only present in the interface system, not in the reference system, and they are due to varying degree of W-V ordering in the mixed lattice sites. This effect is important and has been thoroughly taken into account. A cluster expansion (CE) has been developed for the mixed layers based on DFT calculated energies for a large set of different V-W configurations. The ATAT package [51, 52, 53, 54] is used to derive the parameters in the CE by fitting to the DFT data. The CE coefficients are allowed to be different in the two different mixed layers. Monte Carlo (MC) simulations are then performed within the canonical ensemble and both the contribution to the temperature dependence of the energy (enthalpy) and entropy are determined [10].
Another contribution to the temperature dependence of the Gibbs energy is the vibrational motion. The contribution to will depend on the difference in the vibrational motion for the atoms in the interface system compared with the atoms in the reference system. Due to the similarities between the interface system and the corresponding reference system we expect a large degree of cancellation to be present. In Ref. [5] the vibrational contribution to was estimated to be at maximum 0.3 J/m2. It can be obtained from phonon spectrum calculations but the computational effort is substantial. In the present study we have therefore chosen to neglect the vibrational contribution to .
More complex is the deviation that arises from the temperature dependent magnetic structure of Co. From theoretical calculations, it is known that the magnetic state of Co influences Co/carbide interface energies [55]. The absolute value of a Co/carbide interface energy can change substantially () when treating Co as either ferro- or nonmagnetic [55, 8], although the relative differences between various Co/carbide interfaces do not [8]. Another complication is posed by the melting of Co that appear in the temperature interval relevant for sintering.
Accurate absolute values of WC/Co interface energies are therefore difficult to obtain, in particular at high temperatures. However, both the effect of Co magnetism and the liquid phase of Co should to large degree cancel when considering a difference between interfaces of different atomic setups and site fractions calculated at the same thermodynamic conditions and . Therefore, in the following, we will concentrate on the relative interface energies
| (14) |
i.e. the difference in energy between an interface containing V at site fraction and the unreconstructed () interface containing no segregation of V. Strictly speaking, this means that we are calculating free energy differences between systems containing an interface rather than the actual interface energy.
Furthermore, we do not consider any segregation of Co atoms into the mixed region. Neither do we consider W or V segregation on the binder phase side of the interface. Consequently, the number of Co atoms is the same in the two systems and , and hence the value for in Eq. (14) will be independent on the chemical potential for Co. It implies that the particular choice of for the current results for is of no importance.
4.5 Environment dependent part
The environment dependent part of Eq. (6) introduces the connection between the DFT computations and CALPHAD-type modeling. This is independent on the chosen structural model . It is given by the difference between the chemical potentials for the chosen reference states in the DFT modeling and the actual experimental chemical potentials ,
| (15) |
Calculating chemical potentials with respect to chosen reference states is a standard procedure in thermodynamic software. For well-defined experimental conditions (temperature, pressure and composition), the difference can thus be obtained given databases for the system at hand. An example is provided in subsection 4.6.
4.6 Interfacial phase diagram
The final step is the actual construction of the interfacial phase diagram. We will make predictions for a real V-doped WC-Co material, which was produced and investigated by Weidow et al. [56, 57]. The composition of their material is given in Tab. 3 and details regarding its manufacture can be found in Ref. [56]. The V addition used is rather typical for WC grain growth inhibition and a signicantly smaller WC grain size was reported for this material compared with a reference straight WC-Co [56].
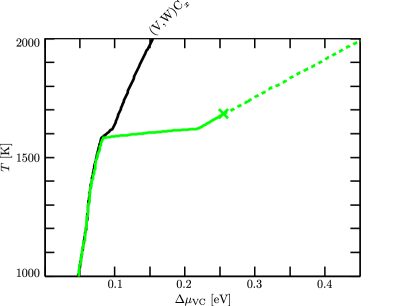
We first determine the thermodynamic bulk behavior. For a small addition of V atoms is low and the V atoms will be dissolved in the binder phase. By increasing the amount of V will increase and a maximum will be attained when the secondary cubic bulk phase is formed. This defines the stability line. Using the Thermo-Calc software [46] with appropriate databases [39, 47], we have determined the location of the stability line. It is shown in Fig. 5 (black curve) as function of the difference
| (16) |
where is the Gibbs energy per formula unit of the (hypothetical) stoichiometric cubic VC phase and and are the chemical potentials for V and C, respectively. The exact location of the stability line in the - diagram depends also on the chemical potential for C. In Fig. 5 we have used the same value for as derived from the experimental set up in Refs [56, 57].
With increasing temperature for the stability line increases more and more indicating that the real non-stoichiometric phase becomes more and more stable compared with the (hypothetical) stoichiometric cubic VC phase. To the right of the stability line V is predicted to be dissolved in the binder phase. If approaching the stability line from right the bulk phase would start to nucleate and the size and thickness of such precipitates would not directly depend on thermodynamic parameters.
We can now plot in the same figure the - path that the system in the experimental study [56, 57] follows. This path is also determined from Thermo-Calc modeling and the result is shown as the green curve. Following the green curve from low temperatures the bulk phase is stable up to . Above this temperature the bulk phase is dissolved in the binder. At 1582 K the Co binder phase start to melt (the solidus temperature for the binder) and it is completely melted at 1620 K (the liquidus temperature for the binder). This is seen as two kinks along the - curve. Within the solidus-liquidus region, increases sharply due to the larger V solubility in liquid Co than in solid Co. The holding temperature during liquid phase sintering is , marked by a green cross in Fig. 5. If one would had continued to increase the temperature in the experimental study the system would had followed the - curve shown as a dashed green line.
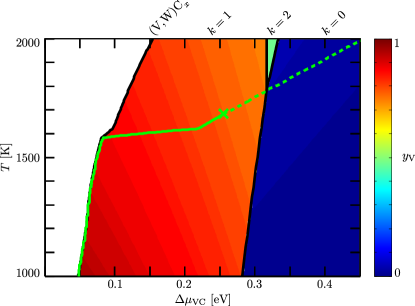
We are interested in the region to the right of the stability line in Fig. 5 and the possibility of substantial segregation of V to interfaces and the formation of intermixed cubic structures, thin films, in that region. In Fig. 6 we show our results for the WC(0001)/Co interface, superimposed on the bulk result. Three different regions exist in the relevant part of the - diagram. For low , the structural model , a thin film with cubic stacking, is associated with the lowest free energy. The two metal layers have mixed composition but are V-rich with ranging from to in the depicted region. Appearing only as a thin wedge in Fig. 6, a region with the structural model expands at higher and is associated with a lower V content than with about . At around , the structural model region appears which has a low V content of, at its limits, and at and , respectively. This corresponds to an interface with hexagonal WC stacking with a small segregation tendency of V to the topmost layer. Thus, the three different stackings are well separated in terms of total V content; to (), () or less than () equivalent V monolayers, and the use of the concept complexions and thermodynamic complexion transitions are well justified in the present case.
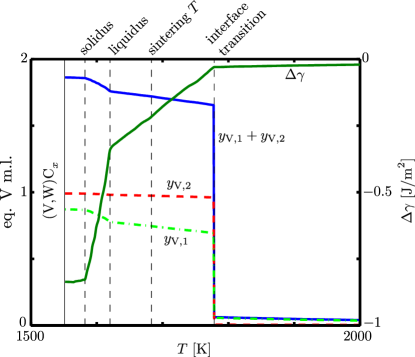
The V concentration along the experimental - path is shown in Fig. 7 (blue curve). At the concentration corresponds to 1.93 equivalent V monolayers (eq. V m.l.). It decreases to 1.88 eq. V m.l. when the Co binder phase has melted and it decreases further to 1.86 at , the holding temperature at the liquid-phase sintering stage. The layer-dependent site fractions are also shown as function of temperature. At , the holding temperature, the reduction of the V concentration is located exclusively in the topmost layer (). If one would have continued to increase the temperature in the experimental study the theoretical prediction is that the film would have dissolved at and above that temperature the topmost layer () would have contained only a very minor concentration of V atoms.
In the same figure we also show the temperature dependence of , the difference between the interface energy and the interface energy for an unreconstructed WC(0001)/Co interface (k=0) without any V segregation (cf. Eq. 14). At the reduction is quite large, 0.84 J/m2. The reduction decreases with increasing temperature and at , the holding temperature, it is only 0.14 J/m2.
5 Future challenges
The presented interfacial phase diagram is a first step towards a complete complexion diagram for the doped WC-Co system, a technologically relevant material. A straightforward improvement of the calculation methodology would be to add an explicit calculation of the vibrational motion of the solid phases to obtain a more accurate description of the temperature dependence of the free energies. Addition of carbon vacancies in the cluster expansion would also improve the modelling and will be important when considering the effect of varying the carbon content in the WC-Co system.
More challenging is a proper description of the magnetic structure of cobalt and its liquid phase. Progress is being made in modelling paramagnetic systems [58, 59] and for the modelling of the liquid state it may be necessary to make use of DFT-based inter-atomic potentials [60, 61] and the molecular-dynamics technique to obtain sufficient sampling of relevant configurations. However, here we have focused on the calculation of free energy differences between systems containing an interface (cf Eq. 14) and rely on substantial cancelation effects. Accurate computations of the absolute value of interface energies at high temperatures for complex structures constitutes an outstanding challenge.
Our method is based on the use of defined interfacial structural models for which a quantitative expression for Gibbs energy can be formulated. Input from experiments with atomic scale structural resolution has been important to guide the construction of the interfacial structural models [28]. The research area would benefit from further experimental studies, in particular on the direct identification of both the atomic structure and its chemical nature of boundaries in various doped cemented carbides. Segregation in the binder phase of metal atoms and carbon to the phase boundaries should also be taken into account in future developments of the methodology. One may also envisage the use of DFT-based machine learning techniques to improve on the interfacial structural modelling.
Another key ingredient in our methodology is the use of CALPHAD-type of modelling of the adjoining bulk phases together with well-defined and appropriate reference states in the DFT calculations. The connection to real systems can then be made using available thermodynamic software [46]. It relies on developed databases and application to other dopants and materials may require development and refinement of appropriate databases. In general, a challenge is to apply the presented methodology to other dopants and to other phase boundaries in cemented carbides. By comparing with experimental information it would then be possible to establish the validity of our approach.
Doping of cemented carbides is used to mitigate the WC grain growth in the sintering process [22]. The phenomenon is experimentally well-established but the exact mechanism behind the grain growth inhibition is still unclear. The interfacial phase diagram can be used to tune sintering temperature and dopant addition to perform interfacial engineering. The diagrams are important as they provide information at the sintering temperature, where most of the grain growth occurs and where experimental tools with atomic scale resolution are rare [30]. Outstanding challenges in the future are to establish the connection between the segregated interfacial structures, the interface complexions, and the growth mechanism as well as their influence on the mechanical properties of cemented carbides.
6 Summary
We have here reviewed a method for calculating an equilibrium interfacial phase diagram, a complexion diagram, depicting regions of stability for different interface structures as function of temperature and chemical potentials. We use DFT for interfacial energetics, Monte Carlo simulations together with cluster expansions based on DFT results for obtaining configurational free energies, and CALPHAD-type modeling for describing the thermodynamic properties of the adjoining bulk phases.
The concept interface complexion is also demonstrated using a simplified model. We then show that atomically thin VC films can be stabilized at WC/Co boundaries by interfacial effects and that two VC layers become the thermodynamically stable configuration over a wide temperature range.
Acknowledgments
Financial support from the Swedish Research Council (VR 621-2013-5768), Sandvik and Seco Tools is gratefully acknowledged. Computations have been performed on resources provided by the Swedish National Infrastructure for Computing (SNIC) at C3SE and NSC. Prof. Susanne Norgren and late Prof. Bo Jansson are acknowledged for providing thermodynamic data, Prof. Hans-Olof Andrén and Dr. Jonathan Weidow for fruitful discussions.
Appendix A Computational details
All DFT calculations have been performed using the Vienna ab-initio simulation package (VASP) [62]. For the exchange-correlation effects, we employ the generalized gradient approximation (GGA). The exchange-correlation functional is approximated in the Perdew-Burke-Ernzerhof (PBE) scheme [63] and the calculations are performed non-spinpolarized. A plane-wave implementation with projector augmented wave (PAW) potentials is used [64, 65] and the plane-wave energy cutoff is set to 400 eV in all calculations. Partial occupancies are set with the method of Methfessel-Paxton [66] of first order with a smearing parameter of 0.2 eV. Atomic relaxations are performed until all atomic forces are smaller than 0.02 eV/Å.
For the interface energies presented in Tabs 1 and 2, the modeled interface orientation is the same as in Ref. [10]. For the carbide/Co calculations, we use metal-terminated carbide slabs containing 5 M + 4 C atomic (for cubic MC) or (for WC) layers each with 3 atoms. The Co slab contains 7 layers each with 4 atoms. For the carbide/Co calculations, a slab+slab setup without any vacuum region is used. For the WC/MC calculations, we use a setup with a total of 4 M, 4 W, and 7 C atomic layers. For consistency, we keep the supercell dimensions in the interface plane the same as in the MC/Co calculations, but due to incompatible stacking sequences between WC and MC, a slab+slab+vacuum ( Å vacuum) setup is used in the direction perpendicular to the interface plane. The values presented in Tab. 1 corresponds to the stacking sequence of lowest energy and the C chemical potential is assumed to be in the graphite limit. For the corresponding free surfaces, separate carbide and Co slabs with the same number of atoms as in the interface calculations are used. The -point sampling is done with a -centered grid with a division of to converge all interface energies to an estimated computational error within .
References
- [1] H. L. Lukas, S. G. Fries, B. Sundman, Computational thermodynamics - The Calphad method, Cambridge University Press, Cambridge, United Kingdom, 2007.
- [2] P. R. Cantwell, M. Tang, S. J. Dillon, J. Luo, G. S. Rohrer, M. P. Harmer, Grain boundary complexions, Acta Mater. 62 (2014) 1.
- [3] J. Luo, Stabilization of nanoscale quasi-liquid interfacial films in inorganic materials: A review and critical assessment, Crit. Rev. Solid State Mater. Sci. 32 (2007) 67.
- [4] L. P. H. Jeurgens, Z. Wang, E. J. Mittemeijer, Thermodynamics of reactions and phase transformations at interfaces and surfaces, Int. J. Mater. Res. 100 (2009) 1281.
- [5] S. A. E. Johansson, G. Wahnström, Theory of ultrathin films at metal-ceramic interfaces, Phil. Mag. Lett. 90 (2010) 599.
- [6] M. P. Harmer, The phase behavior of interfaces, Science 332 (2011) 182.
- [7] M. Baram, D. Chatain, W. D. Kaplan, Nanometer-thick equilibrium films: The interface between thermodynamics and atomistics, Science 332 (2011) 206.
- [8] S. A. E. Johansson, G. Wahnström, A computational study of thin cubic carbide films in WC/Co interfaces, Acta Mater. 59 (2011) 171.
- [9] J. Luo, Developing interfacial phase diagrams for applications in activated sintering and beyond: Current status and future directions, J. Am. Ceram. Soc. 95 (2012) 2358.
- [10] S. A. E. Johansson, G. Wahnström, First-principles study of an interfacial phase diagram in the V-doped WC-Co system, Phys. Rev. B 86 (2012) 035403.
- [11] T. Frolov, D. L. Olmsted, M. Asta, Y. Mishin, Structural phase transformations in metallic grain boundaries, Nat. Commun. 4 (2013) 1899.
- [12] Q. Gao, M. Widom, First-principles study of bismuth films at transition-metal grain boundaries, Phys. Rev. B 90 (2014) 144102.
- [13] A. Tewari, F. Nabiei, S. C. Parker, M. Cantoni, M. Stuer, P. Bowen, C. Hébert, Toward knowledge-based grain-boundary engineering of transparent alumina combining advanced TEM and atomistic modeling, J. Am. Ceram. Soc. 98 (2015) 1959.
- [14] W. Rheinheimer, M. J. Hoffmann, Non-Arrhenius behavior of grain growth in strontium titanate: New evidence for a structural transition of grain boundaries, Scripta Mater. 101 (2015) 68.
- [15] A. Khalajhedayati, T. J. Rupert, High-temperature stability and grain boundary complexion formation in a nanocrystalline Cu-Zr alloy, JOM 67 (2015) 2788.
- [16] M. Tang, W. C. Carter, R. M. Cannon, Diffuse interface model for structural transitions of grain boundaries, Phys. Rev. B 73 (2006) 024102.
- [17] S. J. Dillon, M. Tang, W. C. Carter, M. P. Harmer, Complexion: A new concept for kinetic engineering in materials science, Acta Mater. 55 (2007) 6208.
- [18] S. J. Dillon, M. P. Harmer, J. Luo, Grain boundary complexions in ceramics and metals: An overview, JOM 61 (2009) 40.
- [19] V. K. Sarin (Ed.), Comprehensive Hard Materials, Elsevier, 2014.
- [20] S. Norgren, J. García, A. Blomqvist, L. Yin, Trends in the P/M hard metal industry, Int. J. Refract. Met. Hard Mater. 48 (2015) 31.
- [21] Z. Z. Fang, X. Wang, T. Ryu, K. S. Hwang, H. Y. Sohn, Synthesis, sintering, and mechanical properties of nanocrystalline cemented tungsten carbide - a review, Int. J. Refract. Met. Hard Mater. 27 (2009) 288.
- [22] W. D. Schubert, A. Bock, B. Lux, General aspects and limits of conventional ultrafine WC powder manufacture and hard metal production, Int. J. Refract. Met. Hard Mater. 13 (1995) 281.
- [23] A. Jaroenworaluck, T. Yamamoto, Y. Ikuhara, T. Sakuma, T. Taniuchi, K. Okada, T. Tanase, Segregation of vanadium at the WC/Co interface in VC-doped WC-Co, J. Mater. Res. 13 (9) (1998) 2450.
- [24] T. Yamamoto, Y. Ikuhara, T. Sakuma, High resolution transmission electron microscopy study in VC-doped WC-Co compound, Sci. Technol. Adv. Mater. 1 (2000) 97.
- [25] S. Lay, S. Hamar-Thibault, A. Lackner, Location of VC in VC, Cr3C2 codoped WC-Co cermets by HREM and EELS, Int. J. Refract. Met. Hard Mater. 20 (2002) 61.
- [26] S. Lay, J. Thibault, S. Hamar-Thibault, Structure and role of the interfacial layers in VC-rich WC-Co cermets, Philos. Mag. 83 (10) (2003) 1175.
- [27] S. Lay, M. Loubradou, P. Donnadieu, Ultra fine microstructure in WC-Co cermet, Adv. Eng. Mater. 6 (10) (2004) 811.
- [28] S. Lay, S. Hamar-Thibault, M. Loubradou, Accomodation of the lattice mismatch at the interface, Interface Sci. 12 (2004) 187.
- [29] S. Lay, M. Loubradou, S. A. E. Johansson, G. Wahnström, Interface structure in a WC-Co alloy co-doped with VC and , J. Mater. Sci. 47 (2012) 1588.
- [30] I. Sugiyama, Y. Mizumukai, T. Taniuchi, K. Okada, F. Shirase, T. Tanase, Y. Ikuhara, T. Yamamoto, Formation of layers at the WC/Co interfaces in VC-doped WC-Co cemented carbide, Int. J. Refract. Metals Hard Mater. 30 (2012) 185.
- [31] I. Sugiyama, Y. Mizumukai, T. Taniuchi, K. Okada, F. Shirase, T. Tanase, Y. Ikuhara, T. Yamamoto, Three-dimensional morphology of in VC-doped WC-Co hard metals, Scripta Mater. 69 (2013) 473.
- [32] I. Sugiyama, Y. Mizumukai, T. Taniuchi, K. Okada, F. Shirase, T. Tanase, Y. Ikuhara, T. Yamamoto, Carbon content dependence of grain growth mode in VC-doped WC-Co hardmetals, Int. J. Refract. Met. Hard Mater. 52 (2015) 245.
- [33] A. Delanoë, M. Bacia, E. Pauty, S. Lay, C. H. Allibert, Cr-rich layer at the WC/Co interface in Cr-doped WC-Co cermets: segregation or metastable carbide?, J. Cryst. Growth 270 (2004) 219.
- [34] M. Kawakami, O. Terada, K. Hayashi, HRTEM microstructure and segregation amount of dopants at WC/Co interfaces in TiC and TaC mono-doped WC-Co submicro-grained hardmetals, J. Jpn. Soc. Powder Powder Metall. 53 (2006) 166.
- [35] M. Kawakami, O. Terada, K. Hayashi, Effect of sintering cooling rate on V segregation amount at WC/Co interface in VC-doped WC-Co fine-grained hardmetal, J. Jpn. Soc. Powder Powder Metall. 51 (2004) 576.
- [36] S. Haglund, J. Ågren, W content in Co binder during sintering of WC-Co, Acta Mater. 46 (8) (1998) 2801.
- [37] M. Kawakami, K. Kitamura, Segregation of dopants at WC/Co and WC/WC interfaces in solid-state-sintered WC-VC-Cr3C2-Co cemented carbides, Mater. Trans. 56 (2015) 1880.
- [38] M. Kawakami, K. Kitamura, Segregation layers of grain growth inhibitors at WC/WC interfaces in VC-doped submicron-grained WC-Co cemented carbides, Int. J. Refract. Met. Hard Mater. 52 (2015) 229.
- [39] A. Markström, B. Sundman, K. Frisk, A revised thermodynamic description of the Co-W-C system, J. Phase Equilib. Diffus. 26 (2005) 152.
- [40] J. Weidow, S. Johansson, H.-O. Andrén, G. Wahnström, Transition metal solubilities in WC in cemented carbide materials, J. Am. Ceram. Soc. 94 (2011) 605.
- [41] P. Gustafson, Thermodynamic evaluation of the C-W system, Mater. Sci. Technol. 2 (1986) 653.
- [42] M. Petisme, S. A. E. Johansson, G. Wahnström, A computational study of interfaces in WC-Co cemented carbides, Model. Simul. Mater. Sci. Eng. 23 (2015) 045001.
- [43] M. Christensen, S. Dudiy, G. Wahnström, First-principles simulations of metal-ceramic interface adhesion: Co/WC versus Co/TiC, Phys. Rev. B 65 (2002) 045408.
- [44] V. Bounhoure, S. Lay, M. Loubradou, J. M. Missiaen, Special WC/Co orientation relationships at basal facets of WC grains in WC-Co alloys, J. Mater. Sci. 43 (2008) 892.
- [45] The slight differences between the data for , , and in Ref. [5] and in Tabs. 1 and 2 are explained by a difference in interface structure. In Ref. [5], a mean value of energies for several coherent carbide/Co interfaces was taken as the carbide/Co interface energy, whereas here we use an incoherent carbide/Co interface with a more realistic Co atomic density at the interface.
- [46] B. Sundman, B. Jansson, J. O. Andersson, Thermocalc databank system, CALPHAD 9 (1985) 153.
- [47] K. Frisk, A. Markström, Effect of Cr and V on phase equilibria in Co-WC based hardmetals, Int. J. Mater. Res. 99 (2008) 287.
- [48] A. P. Sutton, R. W. Balluffi, Interfaces in Crystalline Materials, Oxford University Press, Oxford, 1996.
- [49] M. Christensen, G. Wahnström, C. Allibert, S. Lay, Quantitative analysis of WC grain shape in sintered WC-Co cemented carbides, Phys. Rev. Lett. 94 (2005) 066105.
- [50] M. Christensen, G. Wahnström, S. Lay, C. H. Allibert, Morphology of WC grains in WC-Co alloys: Theoretical determination of grain shape, Acta Mater. 55 (2007) 1515.
- [51] A. van de Walle, G. Ceder, Automating first-principles phase diagram calculations, J. Phase Equilib. 23 (2002) 348.
- [52] A. van de Walle, M. Asta, Self-driven lattice-model Monte Carlo simulations of alloy thermodynamic properties and phase diagrams, Modelling Simul. Mater. Sci. Eng. 10 (2002) 521.
- [53] A. van de Walle, M. Asta, G. Ceder, The alloy theoretic automated toolkit: A user guide, CALPHAD 26 (2002) 539.
- [54] A. van de Walle, Multicomponent multisublattice alloys, nonconfigurational entropy and other additions to the alloy theoretic automated toolkit, CALPHAD 33 (2009) 266.
- [55] S. V. Dudiy, Effects of Co magnetism on Co/TiC(001) interface adhesion: a first-principles study, Surf. Sci. 497 (2002) 171.
- [56] J. Weidow, S. Norgren, H.-O. Andrén, Effect of V, Cr and Mn additions on the microstructure of WC-Co, Int. J. Refract. Met. Hard Mater. 27 (2009) 817.
- [57] J. Weidow, H.-O. Andrén, Grain and phase boundary segregation in WC-Co with small V, Cr and Mn additions, Acta Mater. 58 (2010) 3888.
- [58] F. Körmann, A. Dick, B. Grabowski, B. Hallstedt, T. Hickel, J. Neugebauer, Free energy of bcc iron: Integrated ab initio derivation of vibrational, electronic, and magnetic contributions, Phys. Rev. B 78 (2008) 033102.
- [59] P. Steneteg, B. Alling, I. A. Abrikosov, Equation of state of paramagnetic CrN from ab initio molecular dynamics, Phys. Rev. B 85 (2012) 144404.
- [60] N. Juslin, P. Erhart, P. Träskelin, J. Nord, K. O. E. Henriksson, K. Nordlund, E. Salonen, K. Albe, Analytical interatomic potential for modeling nonequilibrium processes in the W-C-H system, J. Appl. Phys. 98 (2005) 123520.
- [61] M. V. G. Petisme, M. A. Gren, G. Wahnström, Molecular dynamics simulation of WC/WC grain boundary sliding resistance in WC-Co cemented carbides at high temperature, Int. J. Refract. Met. Hard Mater. 49 (2015) 75.
- [62] G. Kresse, J. Furthmüller, Efficient iterative schemes for ab initio total-energy calculations using a plane-wave basis set, Phys. Rev. B 54 (1996) 11169.
- [63] J. P. Perdew, K. Burke, M. Ernzerhof, Generalized gradient approximation made simple, Phys. Rev. Lett. 77 (1996) 3865.
- [64] P. E. Blöchl, Projector augmented-wave method, Phys. Rev. B 50 (1994) 17953.
- [65] G. Kresse, D. Joubert, From ultrasoft pseudopotentials to the projector augmented wave method, Phys. Rev. B 59 (1999) 1758.
- [66] M. Methfessel, A. T. Paxton, High-precision sampling for Brillouin-zone integration in metals, Phys. Rev. B 40 (1989) 3616.