Incipient triple point for adsorbed xenon monolayers:
Pt(111) versus graphite substrates
Abstract
Simulation evidence of an incipient triple point is reported for xenon submonolayers adsorbed on the (111) surface of platinum. This is in stark contrast to the “normal” triple point found in simulations and experiments for xenon on the basal plane surface of graphite. The motions of the atoms in the surface plane are treated with standard 2D “NVE” molecular dynamics simulations using modern interactions. The simulation evidence strongly suggests an incipient triple point in the – K range for adsorption on the Pt (111) surface while the adsorption on graphite shows a normal triple point at about K.
pacs:
68.43.-h, 68.35.Md, 68.35.Rh, 64.70.RhThe adsorption of xenon on the (111) surface of platinum (Xe/Pt) is one of the more interesting cases of physical adsorption. The potential energy surface is very strongly corrugated and a wide variety of monolayer structures occur.Bruch et al. (2007) The binding to the surface is relatively large, so that the vapor pressure coexisting with the monolayer remains small enough at temperatures approaching monolayer melting that experimental probes such as low energy electron diffraction and helium atom scattering remain viable. Thus, direct measurements of monolayer dynamics near melting, which are very scarce in the family of nominally two-dimensional systems, may be feasible in this case.
The corrugation for Xe/Pt is much larger than it is for xenon on the basal plane of graphite (Xe/Gr).Barker and Rettner (1992); *BarRet94; Bruch and Novaco (2000, 2008); Novaco and Bruch (2014) The Xe/Pt minimum barrier to translation from one adsorption site to the next is roughly K, whereas the minimum in the effective interaction between two Xe atoms is about K (for Xe/Gr, the barrier is about K.). This should produce strong competition between atom-atom forces and atom-substrate forces. However, there is a reportPoelsema et al. (1985) that the Xe/Pt triple point temperature is K, essentially equal to that of Xe/Gr,Bruch et al. (2007); Novaco and Bruch (2014) a surface with a smaller corrugationBruch and Novaco (2000, 2008) by a factor of about or . While it is expected that thermal excitations will somewhat smooth the effects of substrate corrugation,Bruch and Novaco (2000) and this indeed is the case with Xe/Gr,Bruch and Novaco (2008); Novaco and Bruch (2014) results of preliminary molecular-dynamics calculationsNot (a) for Xe/Pt indicate there is insufficient smoothing to explain such similar triple point temperatures. The results of those preliminary calculations suggest there should be a measurable effect upon the triple point of Xe/Pt as a result of this corrugation. Dilemma: Why should a system with such strong corrugation behave so like a system with rather weak corrugation?Novaco and Bruch (2014)
The strong corrugation of the Xe/Pt system and the fact that the monolayer apparently melts from the commensurate solid phasePoelsema et al. (1985) suggests an interesting possibility: the existence of an incipient triple point. This can occur if the substrate corrugation is strong enough to sufficiently lower the free energy of the solid phase so as to maintain a direct transition from the solid phase into the gas phase, bypassing the liquid phase altogether.Niskanen (1986); Niskanen and Griffiths (1985) With Xe/Pt, we not only have strong corrugation, but also a dilated Xe lattice which weakens the effects of the attractive region of the Xe-Xe interaction. This dilation is due to the -R phase ( phase) having a lattice spacingKern et al. (1988) of Å, which is significantly larger than the “natural” lattice spacing of the Xe, that being in the – Å range.Novaco and Bruch (2014) This implies Xe atoms, when they are located on the adsorption sites, tend to be kept away from the hard-core region of their mutual interaction and found in the weaker region of their attractive well. Therefore, there exists the possibility that this system will, at high temperatures, act much like a lattice gas on a triangular lattice (here, exhibiting repulsive nearest neighbors and attractive next-nearest neighbor interactions). This is an interesting possibility since transitions in similar systems have been examined theoretically,Schick and Siddon (1973) including renormalization group calculations.Schick et al. (1977a, b) The results reported in this communication are part of a much larger studyNot (b) of the structure and thermodynamics of Xe/Pt. The results reported here for Xe/Gr build upon the analysis reported in Ref. Novaco and Bruch, 2014.
The simulation model for Xe/Pt is the Xe/Gr modelNovaco and Bruch (2014) adapted to Xe/Pt with new parameters for the substrate-mediated interaction and a much larger potential energy corrugation.Bruch and Novaco (2000); Bruch et al. (2000) Validation of the resulting model for Xe/Pt is mainly based on the analysisBruch et al. (2000) of the stability and dynamics of a compressed triangular lattice of Xe/Pt with nearest neighbor spacing Å. The Barker-Rettner (BR) modelBarker and Rettner (1992); *BarRet94 is used for the 3D potential energy surface of Xe/Pt as in Ref. Bruch and Novaco, 2000. In this work, the BR interaction is simplified by first using a 2D version of the 3D Steele expansion,Steele (1974) and then truncating the sum in reciprocal space (consistent with the substrate’s -fold symmetry). Thus
| (1) |
where is the potential energy of the Xe atom in the field of the substrate, is the displacement vector of the atom parallel to the surface, and is a member of the set of the six shortest reciprocal lattice vectors defined for the surface lattice.
The simulations carried out are standard NVE molecular dynamics simulations in 2D (here NVE being the 2D version: Number-Area-Energy). The implementation of the basic simulation is exactly as per Refs. Bruch and Novaco, 2008 and Novaco and Bruch, 2014, using essentially the same set of parameters. As in those works, we examined both constrained geometries (a single phase filling the simulations box) and unconstrained geometries (an isolated patch surrounded by vapor). The density of the structure is denoted by for Xe/Pt and by for Xe/Gr. Simulations for the unconstrained geometries are for average densities that are roughly half that of the corresponding phase. In addition to the thermodynamic quantities calculated in Ref. Novaco and Bruch, 2014 (such as the hexatic order parameter ), calculations are carried out for the specific heat at constant area and a second order parameter: the “Net-Domain-Phase” (NDP) order parameter. The set of case studies reported here are detailed in Table 1.
Calculations for use the fluctuations in the kinetic energy of the system.Lebowitz et al. (1967) As a consequence of this approach, there are some problems in evaluating when the drift in the energy is too large over the averaging time interval, as this can result in negative values for . Nevertheless, most of the calculations result in values that are consistent with the slope of the total energy versus temperature data.Not (c) However, the latter approach also generates some values which are negative (resulting from statistical uncertainty in the thermodynamic quantities). Negative values for (as well as some very large positive values) are not included in the plots.
The NDP order parameter is important in determining and understanding the nature of the order-disorder transition in Xe/Pt. It is defined by:
| (2) |
where is the number of Xe atoms and is a primitive reciprocal lattice vector for the Xe structure. This order parameter is, of course, nothing more than the basic structure factor evaluated at and is a sensitive test of the lattice gas ordering in the commensurate lattice. If all the atoms are placed on the ideal lattice sites of a phase single domain, this order parameter takes on a value in the set: (, , and ); the particular value depends upon which of the three possible site types (sub-lattices) is occupied. The NDP order parameter is zero if each adsorption site type is populated with equal probability, even if that phase is not one of true disorder, e.g. the hexagonal incommensurate phase (HIC) or the striped incommensurate phase (SI).
| Case Study | Substrate | Projection | Size | |
|---|---|---|---|---|
| U36-64K111Constrained geometry with 65536 adatoms. | Pt (111) | U36 | 64K | |
| U36H-20K222Unconstrained geometry with 20064 adatoms. | Pt (111) | U36H | 20K | |
| U15H-20K222Unconstrained geometry with 20064 adatoms. | Pt (111) | U15H | 20K | |
| U6H-78K333Unconstrained geometry with 78000 adatoms. | Graphite | U6H | 78K |
Simulations of constrained geometries are used to determine the stable low temperature phase for the classical system and in the interpretation of the high temperature behavior for a parallel set of unconstrained geometries. The constrained geometries are also used to test the sensitivity of the simulations to system size and to follow the system in a simpler context (having only one phase present at any given temperature). However, the transition temperature for the constrained geometries is quite high, and not relevant to the experimental conditions. In fact, it would be expected that layer promotion would become quite important well before the transition would be reached for these constrained geometries. Simulations of the unconstrained geometries are used to examine both the thermal behavior and the structural properties of the submonolayer patch. These configurations generally show 2-phase coexistence of a 2D gas and a 2D dense phase (most cases follow the 2D sublimation curve).
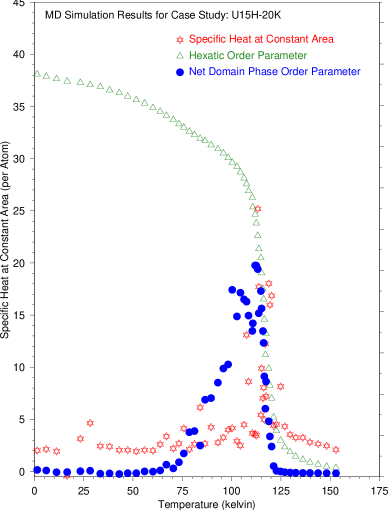
The 2D projection (at very low temperatures) of the BR model for Xe/Pt givesNot (d) K K. This is obtained by assigning the BR energy barrier to the corrugation given by Eq. (1). For Xe/Pt, this corrugation produces a structure for the ground state. However, simulations carried out for smaller corrugations test both the stability of the ground state to variations in the corrugation and address the issue of the effective corrugation being dependent on temperature due to the thermal motion of the Xe in the direction normal to the surface.Seyller et al. (1999); Bruch and Novaco (2000); Not (b) Thermal vibration of the adatom normal to the surface causes the effective corrugation to decrease as the temperatures increases.Bruch and Novaco (2000); Not (b) Although we have examined a number of corrugation values, we report only those listed in Table 1. While the HIC structure is the ground state for the smaller corrugation, both high and low corrugation cases for the unconstrained geometries exhibit a stable structure below melting. This behavior is independent of the different initialization structures ( or HIC) generated for the system. However, for the U15H case the transition from HIC to occurs just below melting.
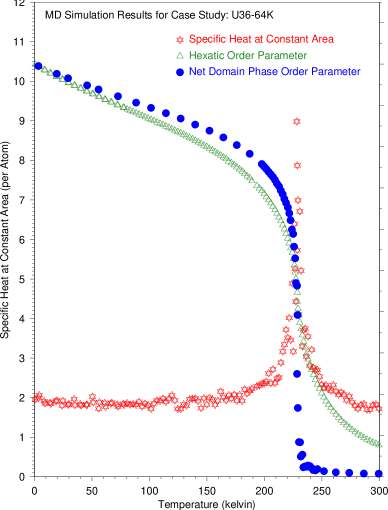
Examination of the heating data for case study U36-64K shows a distinct transition from an ordered to a disordered state at about K. Figure 1 shows the specific heat and the magnitudes of the order parameters and . The specific heat shows clear signs of a transition, with a moderate to large increase in the its value and a classic shape. As the temperature is increased, clearly shows a sharp drop in its value while displays a more gradual decrease in the orientational order of the system. The specific heat peak is aligned very nicely with the sharp decrease in and suggests that is a good measure of this order-disorder transition. Furthermore, the specific heat is more suggestive of a classic continuous transition than of the traditional discontinuous transition of a triple point constrained by a fixed area (which would have a trapezoidal profile). It is relevant here to be mindful that the natural spacing of the Xe atoms is smaller than the spacing in the structure. Thus the usual situation of a triple point being associated with an increase in area is not relevant and the structure seems to be dominated by the corrugation of the substrate even at the (incipient) triple point.
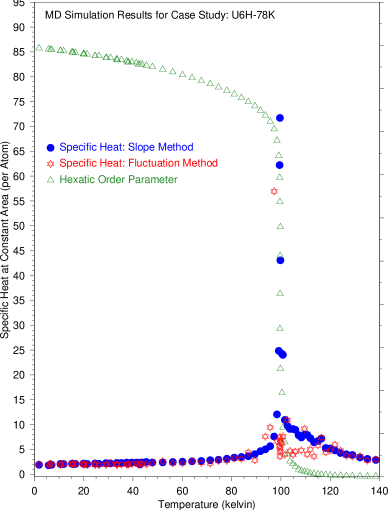
The results for Xe/Pt are different from those obtained for Xe/Gr, where there is clear evidence, within statistical uncertainty, of a vertical rise in the energy at a fixed temperature.Novaco and Bruch (2014) This results in a specific heat that has a sharp (almost vertical) rise in the specific heat and a much smaller precursor to this sharp rise as seen in Fig. 2, where the hexatic order parameter shows a sharp drop in its value. This drop is well aligned with the vertical rise in the total energy, implying that is a good measure of the order-disorder in the Xe/Gr system.Novaco and Bruch (2014)
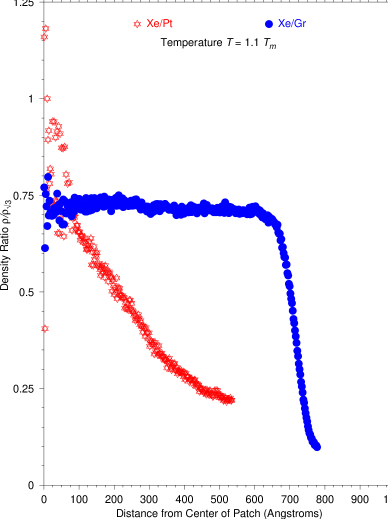
All these behaviors are consistent with structure factor plots of each system showing a clear loss of order as the system moves through the corresponding transition.Novaco and Bruch (2014); Not (b) However, for Xe/Pt, there is no clear indication of a self-bound liquid state in the spatial plots of the system as there isBruch and Novaco (2008); Novaco and Bruch (2014) for Xe/Gr. Figure 3 shows a distinct liquid-gas interface for Xe/Gr just above its triple point, but no hint of such an interface for Xe/Pt just above its order-disorder transition. In both cases, these plots are for initially hexagonal patches centered in the simulation cell.
For Xe/Pt, there is no evidence of a discontinuous transition; rather there is evidence of a likely continuous one. For the unconstrained geometries, there tends to be more scatter in the data, and both order parameters drop more gradually to zero (as compared to the constrained geometries). For U36H-20K, the transition temperature is K, significantly lower than that for U36-64K, but still significantly higher than the experimental valuePoelsema et al. (1985) of K.
At temperatures near the transition temperature, the corrugation is smoothed by the thermal motion perpendicular to the surface (lateral motion smoothing is part of the MD simulation). Preliminary estimates of smoothingNot (b) at these high temperatures result in values in the – K range, corrugations which still produce order-disorder temperatures higher than the experimental value. Question: How large must the smoothing be to bring the simulation results closer to the experimental temperature? In Fig. 4, the effects of extreme smoothing are shown using a of K. The transition temperature is about K, significantly lower than that of the U36H-20K case study.
The order parameter appears to be a better measure than for the order-disorder associated with the transition from solid to fluid in the Xe/Pt system. The drop in the order parameter with increasing temperature near the transition is steeper and more complete for than it is for . Furthermore, is more sensitive than is to system size,Not (b) and this is what would be expected if is the more thermodynamically relevant order parameter. This is in stark contrast to the results for Xe/Gr,Novaco and Bruch (2014) where is a very good measure of the order-disorder near the triple point of that system as shown in Fig. 2.
The melting of Xe/Pt is clearly of a different nature than the true triple point melting of Xe/Gr. This can be seen by the differences in the specific heats, order parameters, and structural orderings of the two systems. These calculations and other observations of the solidSeyller et al. (1999); Ward (2013) above K make it likely the phenomenon at K in Ref. Poelsema et al., 1985 is not triple point melting. These simulations suggest that a Xe/Pt triple point at K is inconsistent with the observation of a phase at K. The case of Xe/Pt has all the earmarks of an incipient triple point as described in Ref. Niskanen, 1986, having a specific heat that looks much like that of a lattice gas transition as described in Ref. Schick et al., 1977b. Since there are finite-size effects (as there are in any simulation), it is not possible to rule out a normal triple point and a normal critical point separated by a small temperature gap. However, such effects would also bedevil the experimental systems. Studies on larger systems having longer run times would be welcome, as well as a better understanding of the thermal smoothing of the corrugation. More thorough experimental studies of the dense monolayer at – K (such as measurements of diffusive motions) might be decisive in establishing the way in which the monolayer disorders.
Acknowledgements.
We would like to acknowledge and thank C. Chen and S. Kapita for the work they did on the preliminary studies that preceded this work. We also thank Lafayette College for its generous support and the Computer Science Department of Lafayette College for use of their research computer cluster. Jessica Bavaresco’s exchange visit to Lafayette College during the calendar year was sponsored by the Brazilian government agency CAPES as part of the Science Without Borders program.References
- Bruch et al. (2007) L. W. Bruch, R. D. Diehl, and J. A. Venables, Rev. Mod. Phys. 79, 1381 (2007).
- Barker and Rettner (1992) J. A. Barker and C. T. Rettner, J. Chem. Phys. 97, 5844 (1992).
- Barker and Rettner (1994) Erratum: J. A. Barker and C. T. Rettner, J. Chem. Phys. 101, 9202 (1994).
- Bruch and Novaco (2000) L. W. Bruch and A. D. Novaco, Phys. Rev. B 61, 5786 (2000).
- Bruch and Novaco (2008) L. W. Bruch and A. D. Novaco, Phys. Rev. B 77, 125435 (2008).
- Novaco and Bruch (2014) A. D. Novaco and L. W. Bruch, Phys. Rev. B 89, 125431 (2014).
- Poelsema et al. (1985) B. Poelsema, L. Verheij, and G. Comsa, Surf. Sci. 152–153, Part 2, 851 (1985).
- Not (a) A. D. Novaco, C. Chen, and S. Kapita (unpublished).
- Niskanen (1986) K. J. Niskanen, Phys. Rev. B 33, 1830 (1986).
- Niskanen and Griffiths (1985) K. J. Niskanen and R. B. Griffiths, Phys. Rev. B 32, 5858 (1985).
- Kern et al. (1988) K. Kern, R. David, P. Zeppenfeld, and G. Comsa, Surf. Sci. 195, 353 (1988).
- Schick and Siddon (1973) M. Schick and R. L. Siddon, Phys. Rev. A 8, 339 (1973).
- Schick et al. (1977a) M. Schick, J. S. Walker, and M. Wortis, Phys. Rev. B 16, 2205 (1977a).
- Schick et al. (1977b) M. Schick, J. S. Walker, and M. Wortis, J. Phys. (Paris) C-4, 121 (1977b).
- Not (b) A. D. Novaco and J. Bavaresco (unpublished).
- Bruch et al. (2000) L. W. Bruch, A. P. Graham, and J. P. Toennies, J. Chem. Phys. 112, 3314 (2000).
- Steele (1974) W. A. Steele, in The Interaction Of Gases With Solid Surfaces (Pergamon Press, Oxford, New York, 1974), vol. 3 of The International Encyclopedia Of Physical Chemistry And Chemical Physics. Topic 14: Properties Of Interfaces (Pergamon Press, Oxford, New York, 1974).
- Lebowitz et al. (1967) J. L. Lebowitz, J. K. Percus, and L. Verlet, Phys. Rev 153, 250 (1967).
- Not (c) The slope is determined by a numerical derivative of the total energy, using second order fits to sequencial sets of data triplets.
- Not (d) The exact value depends upon the calculational details. These include: how to assign the corrugation to a single Fourier amplitude, what approximations are made for the variation of the Fourier amplitudes in the direction normal to the surface, and how the zero-point energy associated with that direction is treated.
- Seyller et al. (1999) T. Seyller, M. Caragiu, R. D. Diehl, P. Kaukasoina, and M. Lindroos, Phys. Rev. B 60, 11084 (1999).
- Ward (2013) D. J. Ward, D. phil., University of Cambridge, England (2013), and J. E. Ellis (private communication).