Centrality and pseudorapidity dependence of the transverse energy flow in pPb collisions at TeV
Abstract
The almost hermetic coverage of CMS is used to measure the distribution of transverse energy as a function of pseudo-rapidity for pPb collisions at TeV. For minimum bias collisions reaches 23 GeV which implies an per participant pair comparable to that of peripheral PbPb collisions at TeV. The centrality dependence of transverse energy production has been studied using centrality measures defined in three different angular regions. There is a strong auto-correlation between and the range used to define centrality for data and the EPOS-LHC and HIJING event generators. The centrality dependence of the data is much stronger for values on the lead side than the proton side and shows significant differences from that predicted by either event generator.
keywords:
CMS , Heavy Ions , pPb , Transverse EnergyNuclear Physics A \runauth \jidnupha \jnltitlelogoNuclear Physics A
The total transverse energy, or , produced in a heavy ion or proton nucleus event is a measure of the energy density produced in that event. This energy density is estimated by Bjorken to be where A is the transverse area of the nuclear overlap zone and represents a time. For TeV PbPb collisions energy densities up to 14 GeV/fm3 are observed [1], assuming fm/c. This value is much higher than the threshold for the production of a quark gluon plasma. It has been suggested that collective phenomena such as azimuthal flow have been observed in pPb collisions. It is interesting to see if large energy densities are also observed in pPb collisions. When using a particular region to define centrality there is obviously an auto correlation with the transverse energy measured in that region. The very large angular coverage of CMS allows for the study of these effects over a very wide range and compare them to predictions from event generators. Full details of the analysis are in Ref [2].
This analysis is based upon 1.14 nb-1 of pPb data from the LHC 2013 run. A sample of Pbp events was used to check the symmetry of the calorimeters. For this analysis the hardware-based Level 1 zero bias trigger required only that two beams be present in CMS. The High Level Trigger then reconstructs these events and requires at least one track with and GeV/c. This guarantees that a collision occurred. Offline cuts are made in order to ensure that the collision is a nuclear pPb collision rather than a beam gas or electromagnetic interaction. The noise is estimated from a sample of empty events collected using the coincidence of a random trigger with the requirement that no beams be present. CMS defines positive as the proton going direction. A detailed description of CMS can be found in Ref. [3].
1 Analysis
This analysis is based upon objects produced by the CMS Particle-Flow algorithm which uses information from the tracker, calorimeters and muon chambers to identify and reconstruct individual particles from collisions. The transverse energy density is calculated using the following equation
| (1) |
where is the of a particular particle flow object, N is the number of good events and accounts for the acceptance of CMS. The correction is deduced from Monte Carlo simulations. and is defined as
| (2) |
Correction factors were generated using the EPOS-LHC and HIJING generators[4, 5]. The main sources of systematic error on are:
-
1.
Differences in spectra and particle composition between data and the Monte Carlos;
-
2.
Different ways of handling the noise;
-
3.
Any asymmetries between the positive and negative sides of CMS;
-
4.
Uncertainties in the calorimeter energy scale;
For the analysis of the reconstructed Monte Carlo events, the event selectioncuts are the same as for the data. No noise cuts are applied to the Monte Carlo events. The corrections are calculated by using EPOS-LHC events with that have been weighted to have the same per charged hadron as the data. Systematics due to the slight differences in particle composition between EPOS-LHC and data were estimated using correction factors derived from HIJING events. The systematic errors as a function of centrality are listed in Table 1.
| Centrality | MC | Noise | pPb -Pbp | E scale | Total |
| Min. bias | 2.7 | 1.7 | 2.4 | 1.0 | 4.2 |
| 0 –10% | 2.9 | 0.9 | 1.8 | 1.0 | 3.7 |
| 10 – 20% | 2.8 | 1.1 | 2.0 | 1.0 | 3.8 |
| 20 – 30% | 2.7 | 1.3 | 2.1 | 1.0 | 3.8 |
| 30 – 40% | 2.6 | 1.5 | 2.1 | 1.0 | 3.8 |
| 40 – 50% | 2.5 | 1.8 | 2.7 | 1.0 | 4.2 |
| 50 – 60% | 2.4 | 2.3 | 2.9 | 1.0 | 4.5 |
| 60 – 70% | 2.3 | 3.1 | 3.2 | 1.0 | 5.1 |
| 70 – 80% | 2.2 | 4.2 | 5.0 | 1.0 | 7.0 |
2 Results
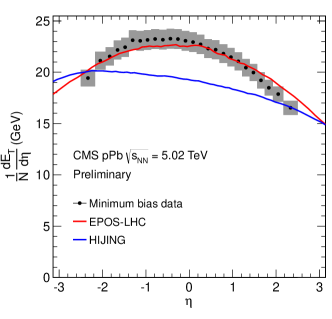
Figure 1 shows the corrected 5.02 TeV pPb minimum bias versus and centrality for data, EPOS-LHC and HIJING. At is 23 GeV. This is 1/40 times the value observed for central PbPb collisions. However we expect that the cross sectional area of a pPb collision should is of the order 50 times smaller than for PbPb. This implies that the energy density in pPb collisions is comparable to that achieved in PbPb. EPOS-LHC is consistent with the data over almost the whole region while HIJING is both below the data and is peaked more on the Pb side than the data.
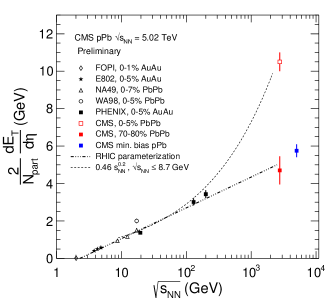
The right hand side of Fig. 1 compares the pPb 5.02 TeV results to lower energy heavy ion results, [1]. To account for the different system sizes the values are normalized to the number of participants in the collisions. The pPb value of GeV per participant pair is consistent with the peripheral PbPb result at TeV [1].
For this paper three different measures of centrality are used;
-
1.
HF-Single: the deposited in lead going side of HF with ,
-
2.
HF-Double the deposited in both sides of HF with , and
-
3.
: the number of offline tracks with MeV and
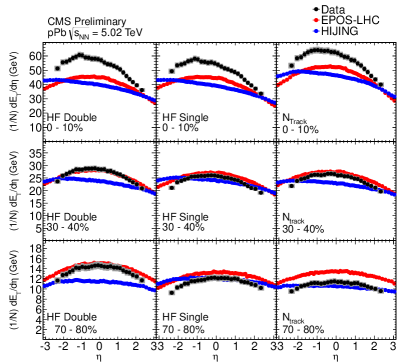
Figure 2 (Left) shows versus and centrality for pPb collisions selected with three centrality definitions. As the centrality increases at increases rapidly and the peak moves backwards in . Near the increase with centrality is stronger for the centrality definition. As the centrality increases at increases faster for the centrality definition than for the HF-single or HF-double definitions. For the HF-double reaches 60 GeV at implying a very high energy density in such collisions. Both EPOS-LHC and HIJING show a large increase of and a shift toward in towards the Pb side as the centrality increases. EPOS-LHC does better at reproducing the shape of the data than does HIJING. As in the data near is larger for more central events selected by than for the cases where the centrality is deduced from HF.
In order to focus on the dependence of the centrality dependence the ratio SPC is defined as
| (3) |
Since SPC depends upon the ratio of data samples and correction factors, correlated errors tend to cancel. SPC is by construction equal to unity for central events and decreases for more peripheral events.
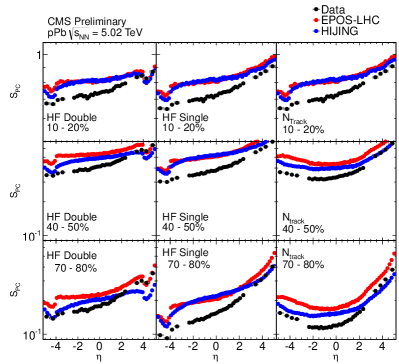
Figure 2 (Right) shows SPC as a function of for 3 centrality ranges and for all three centrality definitions for data EPOS-LHC and HIJING. SPC tends to rise with , i.e. as one moves from the lead to the proton rapidity since the centrality dependence of is stronger on the lead side. The effect of the autocorrelations is a dip in the region where the centrality is defined. The autocorrelation in causes a dip in the peripheral distribution but a bump in the central distribution and so the ratio of peripheral/central shows a dip. This dip in SPC is larger for more peripheral events because the effect of the centrality selection is more pronounced. For HF-double and HF-Single SPC tends to fall with but this is not the case when is used to define centrality. For this definition of centrality SPC is smallest near .
For both EPOS and HIJING the general shapes of the curves are the same for the data and the models but SPC is smaller for the most peripheral data than in the models. For the HF-double definition of centrality both models show a more pronounced dip on the proton side than is seen in the data. This implies that the models predict a larger change in with centrality for the proton region than is seen in the data.
3 Summary
Proton lead collisions at TeV produce a large transverse energy over a very wide pseudo-rapidity range. The transverse energy per participant pair in minimum bias pPb collisions at TeV is comparable to that of peripheral PbPb collisions at TeV. As the centrality of the collision increases the total increases dramatically and the mean of the moves towards the lead side. The EPOS-LHC event generator gives a good description of the minimum bias distribution and peaks at an value close to that of the data for all centralities. However EPOS-LHC under predicts the magnitude for central collisions. HIJING consistently under predicts the magnitude of and has a peak that significantly to the left of the data for central collisions. The region used to define centrality has a strong influence on the nature of the events selected. There is a strong auto-correlation between and the range used to define centrality both for data and the EPOS-LHC and HIJING event generators. The centrality dependence of the data is much stronger for values on the lead side than the proton side and shows significant differences from that predicted by either of the event generators.
References
- [1] S. Chatrchyan, et al., Measurement of the pseudorapidity and centrality dependence of the transverse energy density in PbPb collisions at TeV, Phys. Rev. Lett. 109 (2012) 152303. arXiv:1205.2488, doi:10.1103/PhysRevLett.109.152303.
-
[2]
CMS Collaboration, Centrality and
pseudorapidity dependence of transverse energy flow in ppb collisions at 5.02
tev with cms, CMS Physics Analysis Summary CMS-PAS-HIN-14-014, (2015).
URL http://cdsweb.cern.ch/record/2055755 - [3] S. Chatrchyan, et al., The CMS experiment at the CERN LHC, JINST 3 (2008) S08004. doi:10.1088/1748-0221/3/08/S08004.
- [4] T. Pierog, I. Karpenko, J. M. Katzy, E. Yatsenko, K. Werner, EPOS LHC: Test of collective hadronization with data measured at the CERN Large Hadron Collider, Phys. Rev. C92 (3) (2015) 034906. arXiv:1306.0121, doi:10.1103/PhysRevC.92.034906.
- [5] X.-N. Wang, M. Gyulassy, HIJING: A Monte Carlo model for multiple jet production in p p, p A and A A collisions, Phys. Rev. D44 (1991) 3501–3516. doi:10.1103/PhysRevD.44.3501.