Gamma-ray and optical oscillations in the blazar PKS 0537-441
Abstract
We have considered the Fermi -ray light curve of the blazar PKS 0537-441 during a high state extending from 2008/08/10 to 2011/08/27. The periodogram exhibits a peak at T 280 d, with a significance of 99.7 %. A peak of similar relevance at T is found in the optical light curves. Considering the entire duration of the Fermi light curve 2008-2015, no significant peak is revealed, while the optical one remains meaningful. Comparing with recent observations of PKS 2155-304 and PG 1553+113 it seems that month-year oscillations can characterize some blazars. Month-scale oscillations can also show up only during phases of enhanced or bursting emission like in the case of PKS 0537-441.
1 Introduction
Blazars are jet dominated active galactic nuclei with the jet pointing in the observer direction. A characteristic of the class is a large variability on various timescales and in all spectral bands (see for a recent review Falomo, Pian, & Treves, 2014). Periodicities have been searched for, since the discovery of the first members of the class. No convincing period was found, with the possible exception of the case of OJ 287, where the claim of a 12 year period (e.g. Sillanpää et al., 1988) appears rather robust, but not uncontroversial (e.g. Hudec et al., 2013) .
The situation has changed significantly in recent years, because it has become clear that blazars are the main constituents of the extragalactic -ray sky and the Fermi mission, since its launch has monitored the entire celestial sphere every 3 hours. The consequence is that -ray light curves of blazars are easily available. The Fermi Large Area Telescope (LAT) observations and light curve extraction procedures are described in detail e.g. in Abdo et al. (2010). The Fermi Collaboration provides daily and weekly flux light curves of monitored sources of interest in automated analysis111http://fermi.gsfc.nasa.gov/ssc/data/access/lat/msl_l/. The available energy ranges are 1-300 GeV, 300 MeV-1GeV, 100 MeV-300 GeV. At the same time robotic optical telescopes have become rather common, so that the monitoring time dedicated to blazars has substantially increased.
Sandrinelli et al. (2014a) examined the Fermi light curves of the prototypical BL Lac object PKS 2155-304 (redshift z=0.116, R magnitude 13) and discovered a significant periodicity of T 630 d, which is twice that obtained by Zhang et al. (2014) making a collection of all the published optical photometry of the source in 35 years. The existence of the optical periodicity was confirmed by our independent Rapid Eye Mounting Telescope (REM, Zerbi et al., 2004; Covino et al., 2004) photometry, which covered the source from 2008 to 2015/03 (Sandrinelli et al., 2014b, 2015). Recent papers (Ackermann et al., 2015; Hughes et al., 2015) considered the Fermi light curves of another bright BL Lac object PG 1553+113 (z0.4, R14). A periodicity of 2.18 years is found with interesting significance 99%, which shows up clearly also in the R-monitoring. In Sandrinelli et al. (2015) we examined the -ray and optical light curves of PKS 0537-441, OJ 287, 3C 279, PKS 1510-089, PKS 2005-489 and PKS 2155-304. While the power spectra indicated several peaks in all sources, sometimes at related frequencies in -ray and optical filters, with the exception PKS 2155-304 the significance is not very high. Short duration oscillatory patterns have been reported in various light curves of blazars, both in the optical and X-rays, e.g. in PKS 2155-304 (Urry et al., 1993; Lachowicz et al., 2009), OJ 287 (Kinzel et al., 1988), S5 0716+714 (Rani et al., 2010). Year time scale modulations were found in GB6 J1058+5628 (Nesci, 2010), and also in radio bands, e.g. J1359+4011 (King et al., 2013), and PKS 1156+295 (Wang et al., 2014) Quasi-periodical outbursts were observed occurring in e.g. S5 0716+714 Raiteri et al. (2003) and AO 0235+164 (Raiteri et al., 2008, and references therein).
In this paper we refocus the case of PKS 0537-441, concentrating only on a rather high state.
2 PKS 0537-441
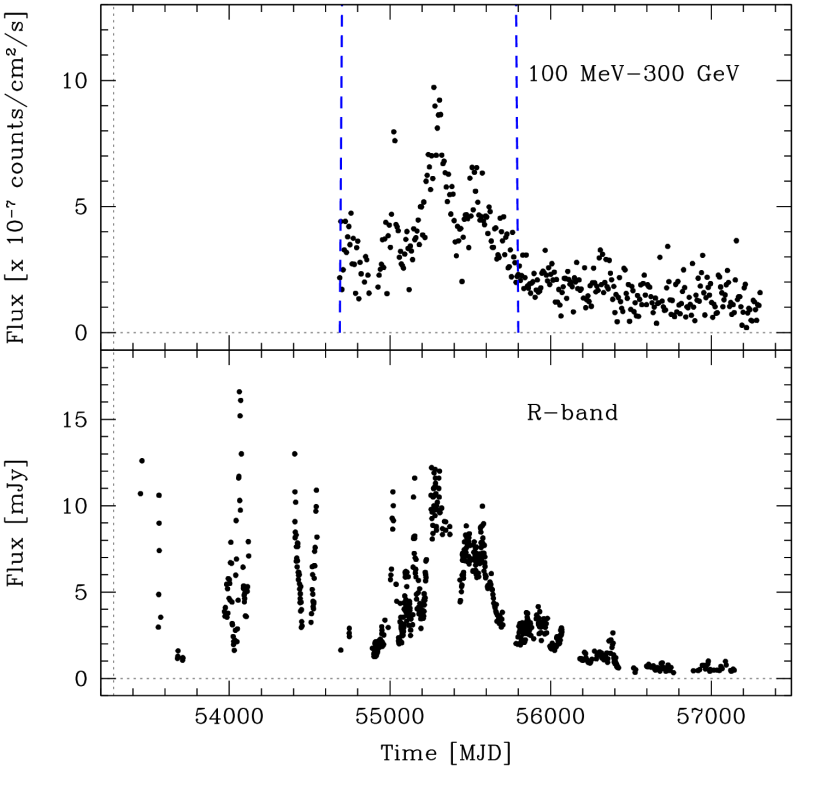
It is a very well studied object (z=0.896, R14), with characteristics intermediate between Optically Violently Variable Quasars and BL Lacs. It was observed in all spectral bands from radio to GeV -rays. Detailed information on the source can be found in Pian et al. (2007) and D’Ammando et al. (2013). In Figure 1 we report the Fermi -ray light curve with one-week integration in the 100 MeV-300 GeV energy band, as provided by the Fermi LAT team (see above). We report also the R-band light curve obtained combining REM and Small & Moderate Aperture Research Telescope System data (SMARTS222http://www.astro.yale.edu/smarts/glast/home.php, Bonning et al., 2012). Details can be found in Sandrinelli et al. (2015).
3 Search for periodicities
Our procedure for searching for regular oscillations follows closely that of Sandrinelli et al. (2015) and is based on the scheme proposed by Schulz & Mudelsee (2002). Shortly, 1) it yields the Lomb and Scargle (Scargle, 1982) periodograms also accounting for unevenly spaced photometry, when it is the case, 2) it models the red noise with a first-order autoregressive process as null hypothesis of stochastic events, 3) it provides the bias-corrected periodograms and significance levels using Monte Carlo simulations.
The analysis of the entire -ray light curve from 54688 MJD (2008/08/10)
to 57304 MJD (2015/10/09)
gives a peak of low significance at 351 d ( 90%).
Interestingly enough in the R, J, K curves there
are peaks of significance 99% at 150 d
(see also Figure 8 in Sandrinelli et
al., 2015, for both -ray and optical power spectra).
The absence of significant -ray peaks is consistent with the results of
D’Ammando et al. (2013), who considered the Fermi light curve only up to
55290 MJD (2010/04/04), and to the standard
time analysis333http://fermi.gsfc.nasa.gov/ssc/data/access/lat/
4yr_catalog/ap_lcs.php
provided by the Fermi collaboration for the 2008-2015 light curve.
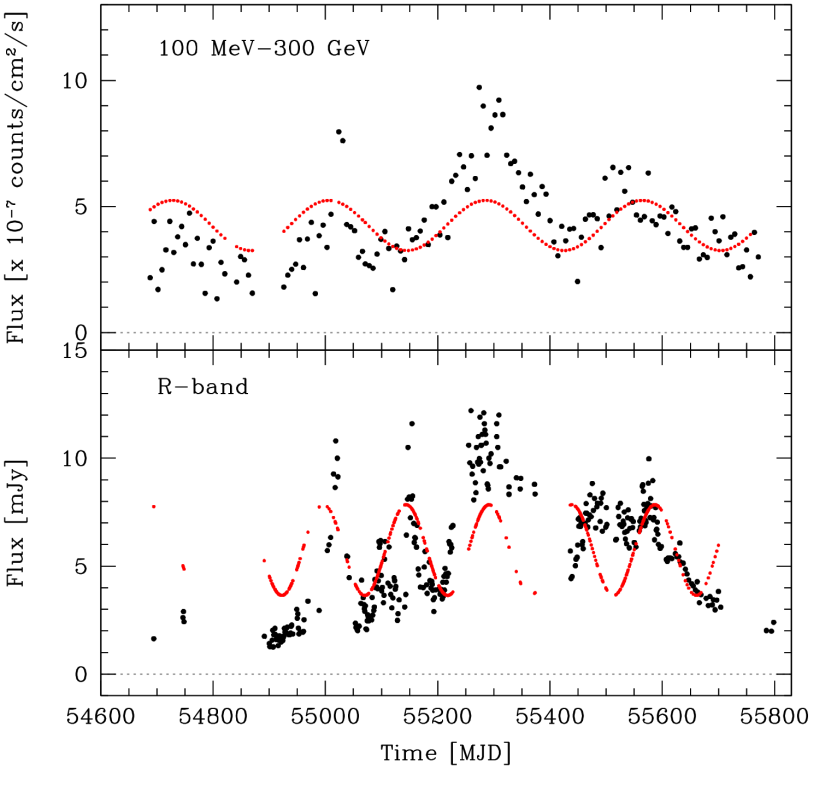
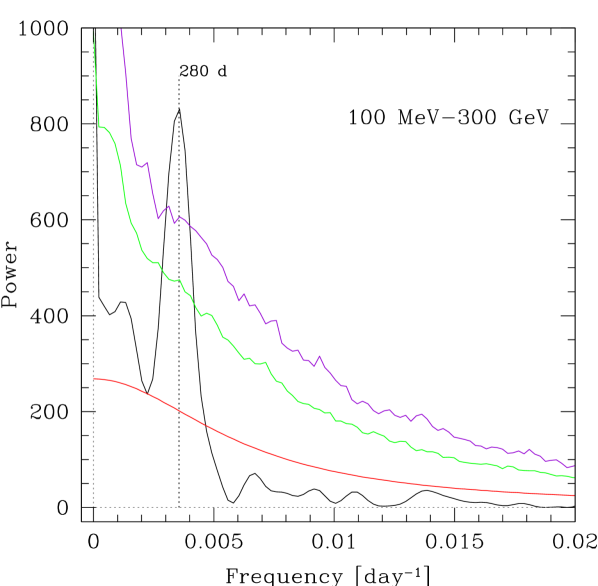
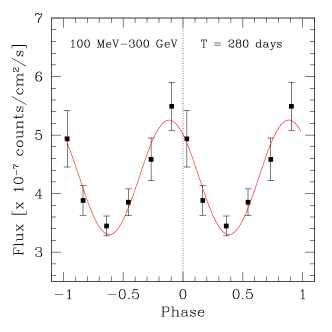
An examination of the -ray light curve (100 MeV-300 GeV) reported in Figure 1 indicates a rather high -ray state of the source from 54688 MJD (2008/08/10) to 55800 MJD (2011/08/27), followed by a lower state. The same is found in the 300 MeV-1 GeV and 1 GeV-300 GeV -ray light curves. We note that the state of the source remains low untill the last available observations of Fermi. Moreover the high state is only partially contained in D’Ammando et al. (2013) -ray light curve. Both high and low -ray states have clear counterparts in the optical bands (see also Sandrinelli et al., 2015). The historical optical light curves, in fact, show that high states of duration of years are not infrequent (Pian et al., 2007). This kind of pattern is present also in the blazar 3C 454.3 (Abdo et al., 2011, and references therein). Here we concentrate on the high -ray state of PKS 0537-441. (Figure 2). The Lomb-Scargle analysis, as specified above, shows a peak at 279 d with 99% significance. We also proceeded in splitting the light curve in 2 segments, which are overlapping for the 50% of their length, adopting the Welch-overlapped-segment-averaging (WOSA, Welch, 1967) to enhance enduring quasi-periodicities. The obtained periodogram is given in Figure 3, where the peak at =280 39 d with (99.7 %) is apparent. The errors are evaluated following Schwarzenberg-Czerny (1991), who applies the Mean Noise Power Level (MNPL) method. The 1 confidence interval on the investigated period T is the width of the peak at the - level, where is the height of the peak and is the mean noise power level in the vicinity of T. We adapted the approach to our data considering the mean local 1st-order autoregressive red-noise power level (Schulz & Mudelsee, 2002).
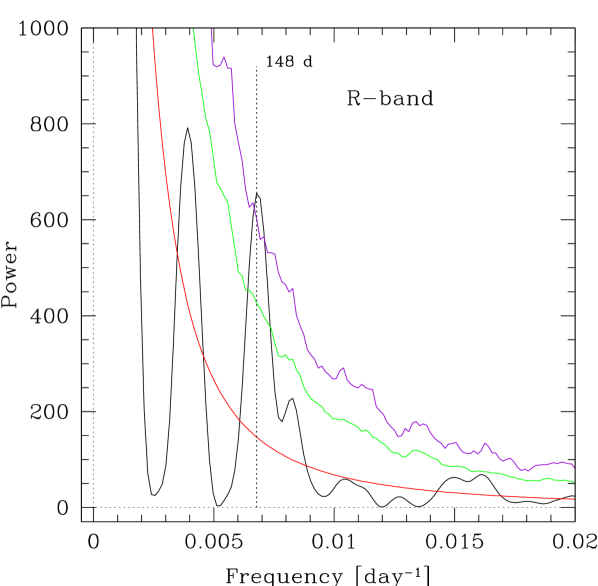
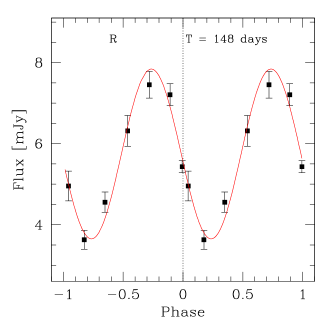
The periodogram referring to the R light curve is reported in Figure 4. It is important to note that the peak at = 148 17 d has a and it is within the errors at one half of the -ray period . It is also compatible with the peak in the periodogram of the 2008-2014 observations (see introduction). The analysis applied to the other optical bands yields comparable results. In Figure 2 we report ed sinusoidal artificial light curves with periods specified above calculated using the Vstar package444http://www.aavso.org/vstar-overview. The amplitude of the components are A=1.0 10-7 photons s-1 cm2 in 100 MeV-300 GeV (=280 d), and A=2.1 mJy in R (=148 d). Clearly the sinusoidal pattern is superposed to a strong chaotic variability. Folded light curves for the -ray and optical data obtained by the same package are reported in Figure 5.
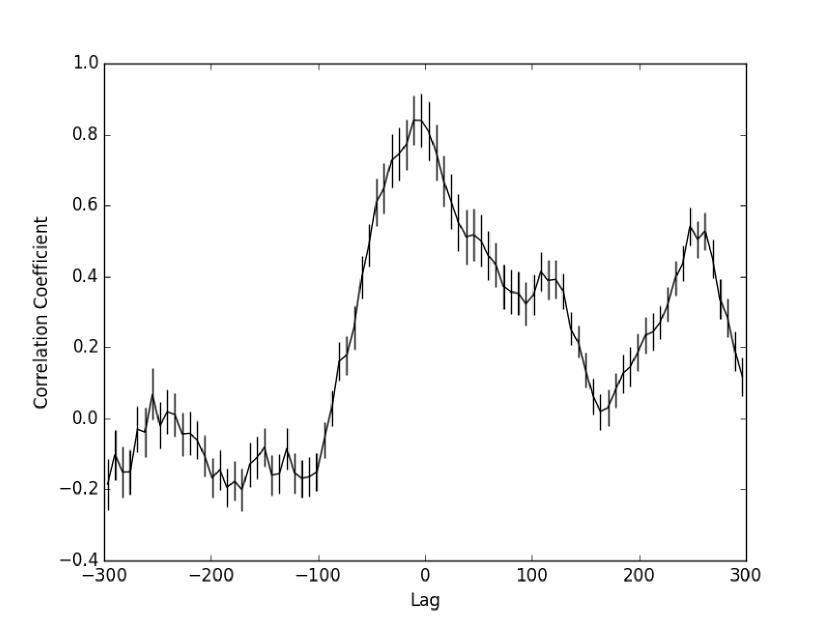
The -ray / optical discrete cross-correlation was obtained following Edelson & Krolik (1988), and it is shown in Figure 6. The main peak is at zero delay with full width half intensity estimated from the left side of 70 d. The (-100 d; +100 d) section is similar to that obtained by D’Ammando et al. (2013). There are also two peaks at 125 d and 265 d which are possibly related to the mentioned oscillations.
4 Summary and Discussion
We have concentrated on a high state of PKS 0537-441 of a duration of 1000 d, and have shown that the periodogram of the -ray light curve exhibits a peak at 280 d with a significance of 99.7%. At there is also a peak in the optical light curve with 99% significance. Because our light curve covers only 3 periods, the indication is at most for a short-lived quasi-periodicity rather than a true period. Interestingly enough a -ray period at twice the optical one was found also in PKS 2155-304 (Sandrinelli et al., 2014a). We note that no explanation for the factor 2 difference in the time scale of the optical and -ray oscillations have been suggested thus far. Considering also the quasi-periodicity in PG 1553-113 (see introduction), it seems to us that even if in each source the significance is not extreme, the indication of month-year oscillations in some blazars should be considered in detail. For possible preliminary interpretative scenarios we refer to Sandrinelli et al. (2014a); Sandrinelli et al. (2015) and Ackermann et al. (2015), where oscillations are interpreted as periodic phenomenons, related to a binary system of two supermassive black holes (SMBH) or the precession of jet-accretion disk system. For the case of the observed short-lived periodicities in PKS 0537-411, which exhibits regular patterns during the -ray/optical simultaneous flares, outbursts could be ascribed to periodic tidal-induced disk instabilities and relaxation processes, due, e.g., to a secondary orbiting black hole (e.g., Lehto & Valtonen, 1996; Valtonen et al., 2009) or to a binary SMBH torque-warped circumbinary disk (e.g., Graham et al., 2015). Disk-connected jet flow, where optical and -ray emissions are generally considered co-spatial (e.g., Ghisellini & Tavecchio, 2009), could mimic these regular oscillations. These perturbations, or different disk instabilities, could also excite dynamical oscillatory responses into the accretion disk, where the presence of a number of restoring forces can be invoked, similarly to the quasi-periodic oscillations in micro quasars (see, e.g., Abramowicz & Fragile, 2013, and refences therein).
If the oscillations are not related to a real periodicity, they could be due to some global instabilities in the jet connected to its helical pattern or shocks in jets. Several possible explanations are discussed in Marscher (2014), Godfrey et al. (2012), Larionov et al. (2013), Camenzind & Krockenberger (1992) and Marscher & Gear (1985).
A consequence of our results is that the Fermi light curves of blazars should be carefully reconsidered. It is possible that quasi-periodicities do not always appear in the long-term -ray light curve, but rather they show up episodically, possibly in correspondence of the higher states.
References
- Abdo et al. (2010) Abdo, A. A., Ackermann, M., Ajello, M., et al. 2010, ApJ, 722, 520
- Abdo et al. (2011) Abdo, A. A., Ackermann, M., Ajello, M., et al. 2011, ApJ, 733, L26
- Abramowicz & Fragile (2013) Abramowicz M. A., Fragile P. C., 2013, LRR, 16, 1
- Ackermann et al. (2015) Ackermann, M., Ajello, M., Albert, A., et al. 2015, ApJ, 813, L41
- Bonning et al. (2012) Bonning E., et al., 2012, ApJ, 756, 13
- Camenzind & Krockenberger (1992) Camenzind, M., & Krockenberger, M. 1992, A&A, 255, 59
- Covino et al. (2004) Covino, S., Stefanon, M., Sciuto, G., et al. 2004, Proc. SPIE, 5492, 1613
- D’Ammando et al. (2013) D’Ammando, F., Antolini, E., Tosti, G., et al. 2013, MNRAS, 431, 2481
- Edelson & Krolik (1988) Edelson, R. A., & Krolik, J. H. 1988, ApJ, 333, 646
- Falomo, Pian, & Treves (2014) Falomo R., Pian E., Treves A., 2014, A&ARv, 22, 73
- Ghisellini & Tavecchio (2009) Ghisellini G., Tavecchio F., 2009, MNRAS, 397, 985
- Godfrey et al. (2012) Godfrey, L. E. H., Lovell, J. E. J., Burke-Spolaor, S., et al. 2012, ApJ, 758, L27
- Graham et al. (2015) Graham M. J., et al., 2015, Nature, 518, 74
- Hudec et al. (2013) Hudec, R., Bašta, M., Pihajoki, P., & Valtonen, M. 2013, A&A, 559, A20
- Hughes et al. (2015) Hughes, G., Stamerra, A, Prandini, E. et al., 2015, In Proceeding of 28th Texas Symposium of Relativistic Astrophysics, in preparation
- King et al. (2013) King, O. G., Hovatta, T., Max-Moerbeck, W., et al. 2013, MNRAS, 436, L114
- Kinzel et al. (1988) Kinzel, W. M., Dickman, R. L., & Predmore, C. R. 1988, Nature, 331, 48
- Larionov et al. (2013) Larionov V. M., et al., 2013, ApJ, 768, 40
- Lachowicz et al. (2009) Lachowicz, P., Gupta, A. C., Gaur, H., & Wiita, P. J. 2009, A&A, 506, L17
- Lehto & Valtonen (1996) Lehto H. J., Valtonen M. J., 1996, ApJ, 460, 207
- Marscher & Gear (1985) Marscher, A. P., & Gear, W. K. 1985, ApJ, 298, 114
- Marscher (2014) Marscher A. P., 2014, ApJ, 780, 87
- Nesci (2010) Nesci, R. 2010, AJ, 139, 2425
- Pian et al. (2007) Pian, E., Romano, P., Treves, A., et al. 2007, ApJ, 664, 106
- Raiteri et al. (2003) Raiteri, C. M., Villata, M., Tosti, G., et al. 2003, A&A, 402, 151
- Raiteri et al. (2008) Raiteri, C. M., Villata, M., Chen, W. P., et al. 2008, A&A, 485, L17
- Rani et al. (2010) Rani, B., Gupta, A. C., Joshi, U. C., Ganesh, S., & Wiita, P. J. 2010, ApJ, 719, L153
- Sandrinelli et al. (2014a) Sandrinelli A., Covino S., Treves A., 2014a, ApJ, 793, L1
- Sandrinelli et al. (2014b) Sandrinelli, A., Covino, S., & Treves, A. 2014b, A&A, 562, A79
- Sandrinelli et al. (2015) Sandrinelli A., Covino S., Dotti M., Treves A., 2015, AJ (in press), arXiv:1512.04561
- Scargle (1982) Scargle, J. D. 1982, ApJ, 263, 835
- Schulz & Mudelsee (2002) Schulz, M. & Mudelsee, M., 2002, Comput. Geosci., 28(3), 421
- Schwarzenberg-Czerny (1991) Schwarzenberg-Czerny A., 1991, MNRAS, 253, 198
- Sillanpää et al. (1988) Sillanpää, A., Haarala, S., Valtonen, M. J., Sundelius, B., & Byrd, G. G. 1988, ApJ, 325, 628
- Urry et al. (1993) Urry, C. M., Maraschi, L., Edelson, R., et al. 1993, ApJ, 411, 614
- Valtonen et al. (2009) Valtonen M. J., et al., 2009, ApJ, 698, 781
- Wang et al. (2014) Wang, J.-Y., An, T., Baan, W. A., & Lu, X.-L. 2014, MNRAS, 443, 58
- Welch (1967) Welch, P.D., 1967, IEEE Transactions on Audio and Electroacoustics 15 (2), 70
- Zerbi et al. (2004) Zerbi, F. M., Chincarini, G., Ghisellini, G., et al. 2004, Proc. SPIE, 5492, 1590
- Zhang et al. (2014) Zhang, B.-K., Zhao, X.-Y., Wang, C.-X., & Dai, B.-Z. 2014, Research in Astronomy and Astrophysics, 14, 933