Gravitational potential wells and the cosmic bulk flow
Abstract
The bulk flow is a volume average of the peculiar velocities and a useful probe of the mass distribution on large scales. The gravitational instability model views the bulk flow as a potential flow that obeys a Maxwellian Distribution. We use two N-body simulations, the LasDamas Carmen and the Horizon Run, to calculate the bulk flows of various sized volumes in the simulation boxes. Once we have the bulk flow velocities as a function of scale, we investigate the mass and gravitational potential distribution around the volume. We found that matter densities can be asymmetrical and difficult to detect in real surveys, however, the gravitational potential and its gradient may provide better tools to investigate the underlying matter distribution. This study shows that bulk flows are indeed potential flows and thus provides information on the flow sources. We also show that bulk flow magnitudes follow a Maxwellian distribution on scales Mpc.
1 Introduction
The standard framework for the formation of the large-scale structure of the Universe is assumed to be governed by the gravitational instability model [1, 2, 3]; observational signatures of the model have been reported [4, 5, 6] that confirm this scenario. The remarkable success of this model to predict and explain the formation of cosmic structure paved the way to the development of the Cosmological Constant Cold Dark Matter (CDM) scenario that agrees extremely well with a whole slew of observations, such as the Cosmic Microwave Background (CMB) fluctuations [7, 8], and redshift surveys [9, 10, 11, 12, 13, 14, 15]. Many of these observations, however, probe either high redshift tracers or light distribution ones which may be biased tracers of the current mass distribution. There is one probe, however, that dynamically traces the mass distribution, especially at small redshifts, and that is the cosmic velocity field, and more particularly in this paper, the bulk flow (e.g. [16, 17, 18, 19, 20, 21, 22, 23, 24, 25, 26, 27, 28] and many others).
The bulk flow (BF) is the average of peculiar velocities in a volume [29, 30, 31]. Peculiar velocities specify the velocities of galaxies towards mass concentrations and thus are good tracers of matter and the corresponding gravitational potentials [32, 33]. They provide us an important tool to discern the reason for cosmic flows of matter since gravitational potentials on these scales are dominated by dark matter. Citation [34] has shown that these peculiar velocities agree with the CDM model of the universe. Other studies have shown similar results as well [35, 36, 37, 38].
However, some estimations of BF show some tension with the CDM model. Recent studies (e.g. [39, 40, 41, 42, 43]) are inconsistent with CDM at confidence level. If these estimations are not due to large scale flows, then the reason for the discrepancies may come from the uncertainty in original data, distance estimation methods and systemic uncertainties. Some of those uncertainties may be hard to control [44, 45].
A popular method to estimate the BF is the Maximum Likelihood Estimate (MLE) [46]. However, the MLE method has two major shortcomings [39, 40, 47, 45]: first, each survey probes the power spectrum in a unique way which makes it very difficult to directly compare different surveys; second, the MLE window function for a given survey is fixed, which means that the effective scale from which the results are estimated is particular to the survey and cannot be changed without discarding some of the data. Further, [31] also shows the inconsistency of the MLE. Recently, a more consistent and, in fact, optimal estimation method was introduced to address these problems, called the Minimum Variance (MV) method [39, 40], and was tested further by citation [48] (for a recent implementation of the MV method see [49, 50]).
Various studies have indicated that the BF magnitudes fit Maxwellian distribution (e.g. [51]), which is consistent with the expectation that structure formation is the outgrowth of gaussian initial conditions via gravitational instability. Some possible sources of the BF are reviewed by citation [52]; they include attractors [53, 54], super-horizon tilt [55, 56, 41], over-dense regions resulting from bubble collisions [57] or induced by cosmic defects [58]. In recent studies, some new possible sources have been proposed: a combination of over- and under-dense region [59, 40] and void asymmetries in the cosmic web [60].
In this paper we use N-body simulations to revisit and test the basic assumptions made to analyze and understand survey data for cosmic flows. More specifically, the simulation data will provide us with both the velocity distributions and the sources of BF. This will enable us to determine whether the assumptions made regarding large-scale cosmic flows should be modified.
The paper is organized as follows: In section 2 we describe the numerical simulations we use. In section 3 we discuss the method we use to estimate the BF. In section 4 we show the BF estimation results and statistics. In section 5 we discuss the possible sources of BF. The results and conclusions are presented in section 6.
2 N-body simulations
In the following we use two independent suites of N-body simulations. The first are the Carmen Boxes of Large Suite of Dark Matter Simulations (LD-Carmen) [61], that contain positions and velocities of galaxies with equal mass.111http://lss.phy.vanderbilt.edu/lasdamas/ The other is the Horizon Run (HR) [62] simulation which uses Zel’dovich approximation [63, 64] to generate initial conditions, containing positions, velocities and masses of galaxies, and is designed to model the SDSS observations. The parameters for LD-Carmen and HR simulations are shown in Table 1.
The LD-Carmen simulation uses a parallel friends-of-friends (FOF) code [65] to identify bound groups of dark matter particles (halos) with the Ntropy framework [66]. The initial conditions are generated by the 2LPT code [67], which employs second-order Lagrangian perturbation theory. The simulations include 41 Gpc3 boxes with approximately 1.3 million mock galaxies in each. Following the Gaussian-weighted procedure we describe in section 3, we extract mock surveys from each of the 41 LD-Carmen boxes to estimate a total of BF’s. We also extract bulk flow catalogues from the HR simulation. The simulations we use differ from each other by small deviations of the initial conditions and the size and density of the data. It is also important to note that particle mass and softening also differ in the two simulations, to some extent owing to different initial and final redshifts (see Table 1).
| Parameters | LD-Carmen | HR |
| Matter density, | 0.25 | 0.26 |
| Cosmological constant density, | 0.75 | 0.74 |
| Baryon density, | 0.04 | 0.044 |
| Hubble parameter, () | 0.7 | 0.72 |
| Amplitude of matter density fluctuations, | 0.8 | 0.794 |
| Primordial scalar spectral index, | 1.0 | 0.96 |
| Box size () | 1000 | 6592 |
| Number of particles | ||
| Initial redshift, | 49 | 23 |
| Redshift, | 0.13 | 0 |
| Particle mass, () | 4.938 | 29.6 |
| Softening, () | 53 | 160 |
3 The Gaussian-weighted bulk flow
We calculate the Gaussian and tophat BF’s using the full three dimensional velocity vectors directly.
We define the component of the BF () to be
| (3.1) |
where is the peculiar velocity component of the th galaxy, and is a Gaussian radial distribution function
| (3.2) |
where is the distance from galaxy to the center of Gaussian ball and is a measure of the depth of the survey.
Applying this method to the simulation data, for each LD-Carmen box we pick 1,000 random points and estimate the Gaussian-weighted BF for each. As a consistency check, we compare it with the one suggested by citation [31]:
| (3.3) |
where is the BF vector, is the radius of the tophat sphere which is twice the size of the in Gaussian-weighted method (see Eq. 3.1), and is the peculiar velocity vector. The BF’s calculated with Eq. 3.1 and the ones in Eq. 3.3 give virtually identical results as long as the radii are corrected for the difference in the selection functions.
4 Bulk flow distribution
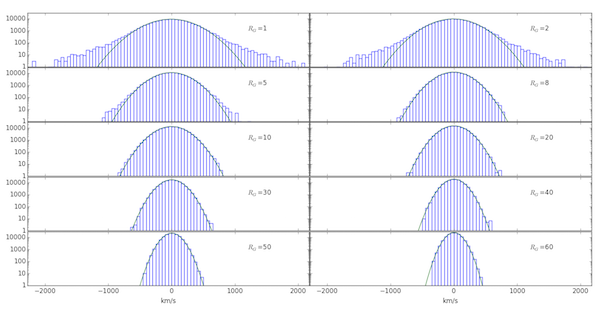
Since , and each component of the BF () has a Gaussian distribution, the BF magnitude should have a Maxwell-Boltzmann distribution (Maxwellian) instead of normal distribution. Figure 1 shows the distribution of BF components. The figure shows clearly that for large the distribution is Gaussian, but for smaller radii, it is not. That is exactly what we expect given the small-scale nonlinearities in the velocity distribution.
To verify the BF magnitude distribution is Maxwellian distribution, we calculate its probability density function by using the least square method.
The Maxwellian distribution function is
| (4.1) |
where is the distribution parameter, , derived from Maxwell-Boltzmann distribution function:
| (4.2) |
From Eq. 4.1 we get
| (4.3) |
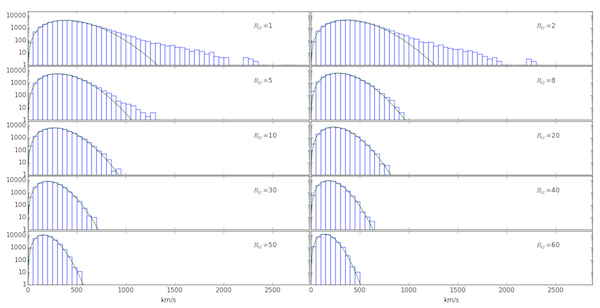
where and are the mean and variance of the distribution, respectively. The mean () decreases as the survey depth () increases, that is, the BF of a volume decreases with increasing size, as expected. This trend is also shown by figure 2. Here also we see that for small , the distribution is not Maxwellian, again, as expected due to small-scale nonlinearities. We also tested the BF distribution from HR simulation, calculated BFs, which also follow a similar pattern.
5 Potential
Since there is no power on scales larger than the box size, and the simulation boxes are not tilted, that is, the average velocity of all galaxies in each direction vanishes, and the velocity field is curl free, the expectation is that BF’s are potential flows due to mass distribution around the volumes.
According to citation [68], the peculiar velocity is
| (5.1) |
where is the Hubble constant, is scale factor and is a function of (density parameter) [69], is the partial derivative with respect to 3-dimensional coordinate (, , ).
Since the mock galaxies in the simulations have identical mass, we calculate the velocity in units of . Thus
| (5.2) |
Since the peculiar velocity in the simulation is irrotational, we can express it as a gradient of a scaler.
| (5.3) |
Thus is proportional to and since it has the same form as the gravitational potential, it fits our expectation. The potential equation can be simplified to
| (5.4) |
The potential of a chosen point could be expressed as,
| (5.5) |
where is the distance to the th galaxy.
To make the analysis clearer, we rescaled to [0,1] by
| (5.6) |
Where is potential of the selected position and is the gravitational potential ensemble.
From Eqs. (5.5) and (5.6) we calculate the potential and its gradient along positive and negative BF direction centered about the Gaussian sphere center in a [300,300] Mpc range with step 30 Mpc.
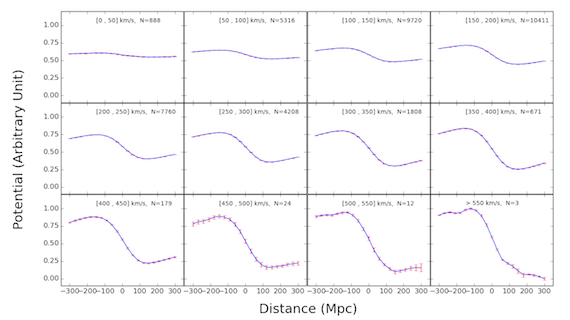
In figures 3 and 4 we show the average potential and its gradient for all BF velocities in different ranges of the BF magnitude, respectively. As can clearly be seen, there is a strong correlation between the BF’s and the gradient of the potential, as expected. When we calculate the potential perpendicular to the BF direction, we get results consistent with no flows (as are the flows from the top left panels in figures 3 and 4).
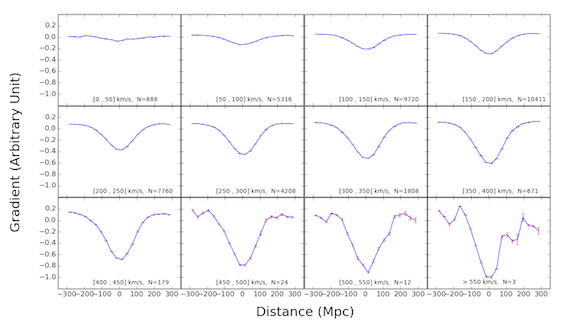
The reason why the figures are symmetric about the central location of the volume is because these are averages of all flows in the magnitude range, the results suggest that generally we have an overdensity in the direction of the flow and an underdensity behind.
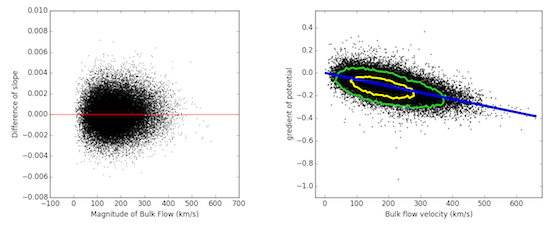
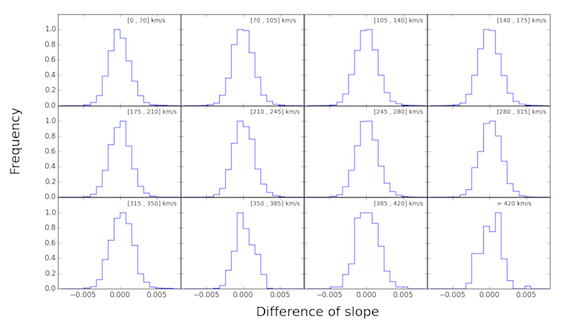
However, for each individual volume, this is not necessarily the case. In figure 5 left panel we show the difference between the magnitude of the slope of the potential gradient in the direction of the BF to that in the opposite direction. As can be clearly seen, each volume exhibits very different non-symmetric distribution. In figure 6 we show the binned distribution of the gradient slope differences. As can be expected, the distribution is roughly Gaussian. This suggests that the reason for the flow is not a simple attractor but rather a complex superposition of over- and under-dense regions that combine to cause the flow. There is a clear statistical correlation between the BF magnitude and the gradient of the potential about the center of the volume for which we calculated the BF, as is shown in figure 5 right panel. However, the picture is more complex when studying individual cases.
The BF magnitude from [39, 40, 45] increased with the radius () and was around 200 and 400 km/s at and Mpc respectively. That is, the BF actually grew as a function of scale. We found above that the likelihood in CDM to have a 400 km/s BF magnitude on Mpc scale to be about 2% and as can be seen in Figures 1 and 2 a small percentage of the BF’s are quite large. In the simulations we searched for a rising BF magnitude as a function of scale as we found in the surveys. In other words, we tried to find a place in the simulation boxes that will emulate the same BF magnitude behavior on all scales (Mpc).
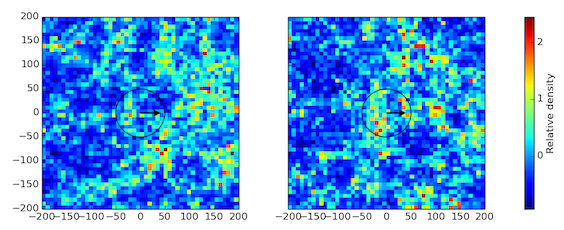
We found two dozen of these type of regions among the 41k points we investigated. In Figs. 7 we show two representative slices in the simulation box. The circle in each figure has a radius of 50 Mpc and the arrow shows the direction of the BF vector on this scale. Each slice was oriented so that the BF is to the positive x-direction. Each slice is 200Mpc thick.
As can be seen in the figures, the density is anisotropic on both small and large scales. On small scales the distributions are such that there is a small over-and under-dense regions close to the center of the volume which happen to be in the opposite direction of the large over- and under-dense regions on large scales. On all scales, the volume is attracted to the large over-dense regions in the positive x-direction and away from the large under-dense regions in the negative x-direction. On small scales the volume is also attracted to the close by over-dense regions in the negative x-direction and away from some under-dense regions close by in the positive x-direction which counters the large-scale flow and leads to slower overall flow on small scales.
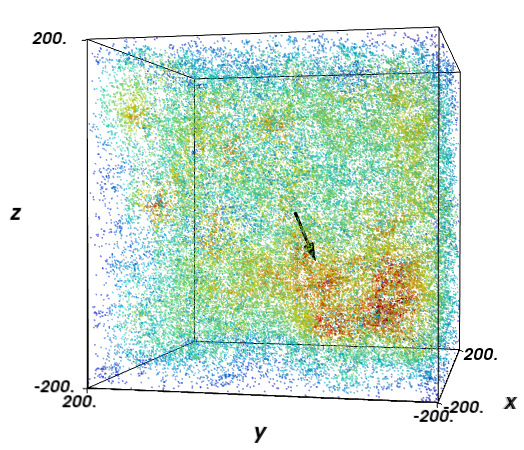
This suggests a very specific distribution of masses as well as large velocity shear that we may be able to detect in future surveys. Further, it shows that there is no one large source for the BF, but rather a complex distribution of high- and low-densities that gives rise to the flow. In figure 8 we show a perspective of the volume around the flow which shows similar behavior.
6 Conclusions
The Bulk Flow statistic is a powerful probe of the mass distribution and the underlying gravitational potential on Mpc scales. We have investigated the BF’s from numerical simulations and as expected, the distribution of BF components obey a Gaussian distribution, whereas the BF magnitude yields a Maxwellian distribution. The BF’s magnitudes yield similar results to the ones suggested by citation [31]. As a check, we made sure that the BF distributions from LD-Carmen and HR simulations are similar and consistent with expectations.
We demonstrated that on scales Mpc, the velocity distribution is non Gaussian, whereas on larger scales it is. Further, we showed that the scalar gravitational potential field gives rise to the BF. Since our probe was the BF magnitudes, as long as we restrict our attention to large scales, we are sensitive mainly to linear flows and can approximate it as an irrotational potential flow. As such, we expect velocities to point towards mass concentration sources. The BF is expected to be a good tracer of the potential flow towards mass concentrations and away from underdense regions.
In general, we may expect to locate high density regions in the direction of the BF, however, such a flow may also be a result of the relative differences between two opposite directions. Relatively high matter concentration in the direction of the flow and comparatively low density in the other direction may also produce such a result, as well as more complex distributions. And thus, the observational search to find out the exact potential map or mass distribution may be very difficult to achieve.
A large BF can have more than one over -and under-dense sources. Therefore, the gradient of gravitational potential or the BF may not point to over-dense region exactly. Complex geometrical distribution of mass may play a significant role here and prevent us from mapping the mass distribution with any precision, especially on large scales.
It is clear that although a BF of the magnitude ( km/s) found by some studies, are not likely (% chance), they are not impossible either and can be driven by a mass distribution consistent with the CDM scenario. To verify this observationally we must create accurate maps of the mass distribution on scales of 300-400 Mpc scales, a goal that may prove difficult to achieve in the near future.
References
- [1] J. M. Bardeen, J. R. Bond, N. Kaiser, and A. S. Szalay, The statistics of peaks of Gaussian random fields, ApJ 304 (May, 1986) 15–61.
- [2] V. F. Mukhanov, H. A. Feldman, and R. H. Brandenberger, Theory of cosmological perturbations, Physics Reports 215 (June, 1992) 203–333.
- [3] D. J. Eisenstein and W. Hu, Baryonic Features in the Matter Transfer Function, ApJ 496 (Mar., 1998) 605–614, [astro-ph/9709112].
- [4] R. Scoccimarro, H. A. Feldman, J. N. Fry, and J. A. Frieman, The Bispectrum of IRAS Redshift Catalogs, ApJ 546 (Jan., 2001) 652–664, [astro-ph/0004087].
- [5] H. A. Feldman, J. A. Frieman, J. N. Fry, and R. Scoccimarro, Constraints on Galaxy Bias, Matter Density, and Primordial Non-Gaussianity from the PSCz Galaxy Redshift Survey, Physical Review Letters 86 (Feb., 2001) 1434, [astro-ph/0010205].
- [6] L. Verde, A. F. Heavens, W. J. Percival, S. Matarrese, C. M. Baugh, J. Bland-Hawthorn, T. Bridges, R. Cannon, S. Cole, M. Colless, C. Collins, W. Couch, G. Dalton, R. De Propris, S. P. Driver, G. Efstathiou, R. S. Ellis, C. S. Frenk, K. Glazebrook, C. Jackson, O. Lahav, I. Lewis, S. Lumsden, S. Maddox, D. Madgwick, P. Norberg, J. A. Peacock, B. A. Peterson, W. Sutherland, and K. Taylor, The 2dF Galaxy Redshift Survey: the bias of galaxies and the density of the Universe, MNRAS 335 (Sept., 2002) 432–440, [astro-ph/0112161].
- [7] C. L. Bennett, D. Larson, J. L. Weiland, N. Jarosik, G. Hinshaw, N. Odegard, K. M. Smith, R. S. Hill, B. Gold, M. Halpern, E. Komatsu, M. R. Nolta, L. Page, D. N. Spergel, E. Wollack, J. Dunkley, A. Kogut, M. Limon, S. S. Meyer, G. S. Tucker, and E. L. Wright, Nine-year Wilkinson Microwave Anisotropy Probe (WMAP) Observations: Final Maps and Results, ApJ Supp 208 (Oct., 2013) 20, [arXiv:1212.5225].
- [8] Planck Collaboration, P. A. R. Ade, N. Aghanim, C. Armitage-Caplan, M. Arnaud, M. Ashdown, F. Atrio-Barandela, J. Aumont, C. Baccigalupi, A. J. Banday, and et al., Planck 2013 results. XVI. Cosmological parameters, ArXiv e-prints (Mar., 2013) [arXiv:1303.5076].
- [9] M. R. Blanton, J. Brinkmann, I. Csabai, M. Doi, D. Eisenstein, M. Fukugita, J. E. Gunn, D. W. Hogg, and D. J. Schlegel, Estimating Fixed-Frame Galaxy Magnitudes in the Sloan Digital Sky Survey, AJ 125 (May, 2003) 2348–2360, [astro-ph/0205243].
- [10] D. J. Eisenstein, I. Zehavi, D. W. Hogg, R. Scoccimarro, M. R. Blanton, R. C. Nichol, R. Scranton, H.-J. Seo, M. Tegmark, Z. Zheng, S. F. Anderson, J. Annis, N. Bahcall, J. Brinkmann, S. Burles, F. J. Castander, A. Connolly, I. Csabai, M. Doi, M. Fukugita, J. A. Frieman, K. Glazebrook, J. E. Gunn, J. S. Hendry, G. Hennessy, Z. Ivezić, S. Kent, G. R. Knapp, H. Lin, Y.-S. Loh, R. H. Lupton, B. Margon, T. A. McKay, A. Meiksin, J. A. Munn, A. Pope, M. W. Richmond, D. Schlegel, D. P. Schneider, K. Shimasaku, C. Stoughton, M. A. Strauss, M. SubbaRao, A. S. Szalay, I. Szapudi, D. L. Tucker, B. Yanny, and D. G. York, Detection of the Baryon Acoustic Peak in the Large-Scale Correlation Function of SDSS Luminous Red Galaxies, ApJ 633 (Nov., 2005) 560–574, [astro-ph/0501171].
- [11] S. Cole, W. J. Percival, J. A. Peacock, P. Norberg, C. M. Baugh, C. S. Frenk, I. Baldry, J. Bland-Hawthorn, T. Bridges, R. Cannon, M. Colless, C. Collins, W. Couch, N. J. G. Cross, G. Dalton, V. R. Eke, R. De Propris, S. P. Driver, G. Efstathiou, R. S. Ellis, K. Glazebrook, C. Jackson, A. Jenkins, O. Lahav, I. Lewis, S. Lumsden, S. Maddox, D. Madgwick, B. A. Peterson, W. Sutherland, and K. Taylor, The 2dF Galaxy Redshift Survey: power-spectrum analysis of the final data set and cosmological implications, MNRAS 362 (Sept., 2005) 505–534, [astro-ph/0501174].
- [12] D. H. Jones, M. A. Read, W. Saunders, M. Colless, T. Jarrett, Q. A. Parker, A. P. Fairall, T. Mauch, E. M. Sadler, F. G. Watson, D. Burton, L. A. Campbell, P. Cass, S. M. Croom, J. Dawe, K. Fiegert, L. Frankcombe, M. Hartley, J. Huchra, D. James, E. Kirby, O. Lahav, J. Lucey, G. A. Mamon, L. Moore, B. A. Peterson, S. Prior, D. Proust, K. Russell, V. Safouris, K.-I. Wakamatsu, E. Westra, and M. Williams, The 6dF Galaxy Survey: final redshift release (DR3) and southern large-scale structures, MNRAS 399 (Oct., 2009) 683–698, [arXiv:0903.5451].
- [13] S. A. Thomas, F. B. Abdalla, and O. Lahav, Excess Clustering on Large Scales in the MegaZ DR7 Photometric Redshift Survey, Physical Review Letters 106 (June, 2011) 241301–+, [arXiv:1012.2272].
- [14] H. Aihara, C. Allende Prieto, D. An, S. F. Anderson, É. Aubourg, E. Balbinot, T. C. Beers, A. A. Berlind, S. J. Bickerton, D. Bizyaev, M. R. Blanton, J. J. Bochanski, A. S. Bolton, J. Bovy, W. N. Brandt, J. Brinkmann, P. J. Brown, J. R. Brownstein, N. G. Busca, H. Campbell, M. A. Carr, Y. Chen, C. Chiappini, J. Comparat, N. Connolly, M. Cortes, R. A. C. Croft, A. J. Cuesta, L. N. da Costa, J. R. A. Davenport, K. Dawson, S. Dhital, A. Ealet, G. L. Ebelke, E. M. Edmondson, D. J. Eisenstein, S. Escoffier, M. Esposito, M. L. Evans, X. Fan, B. Femenía Castellá, A. Font-Ribera, P. M. Frinchaboy, J. Ge, B. A. Gillespie, G. Gilmore, J. I. González Hernández, J. R. Gott, A. Gould, E. K. Grebel, J. E. Gunn, J.-C. Hamilton, P. Harding, D. W. Harris, S. L. Hawley, F. R. Hearty, S. Ho, D. W. Hogg, J. A. Holtzman, K. Honscheid, N. Inada, I. I. Ivans, L. Jiang, J. A. Johnson, C. Jordan, W. P. Jordan, E. A. Kazin, D. Kirkby, M. A. Klaene, G. R. Knapp, J.-P. Kneib, C. S. Kochanek, L. Koesterke, J. A. Kollmeier, R. G. Kron, H. Lampeitl, D. Lang, J.-M. Le Goff, Y. S. Lee, Y.-T. Lin, D. C. Long, C. P. Loomis, S. Lucatello, B. Lundgren, R. H. Lupton, Z. Ma, N. MacDonald, S. Mahadevan, M. A. G. Maia, M. Makler, E. Malanushenko, V. Malanushenko, R. Mandelbaum, C. Maraston, D. Margala, K. L. Masters, C. K. McBride, P. M. McGehee, I. D. McGreer, B. Ménard, J. Miralda-Escudé, H. L. Morrison, F. Mullally, D. Muna, J. A. Munn, H. Murayama, A. D. Myers, T. Naugle, A. F. Neto, D. C. Nguyen, R. C. Nichol, R. W. O’Connell, R. L. C. Ogando, M. D. Olmstead, D. J. Oravetz, N. Padmanabhan, N. Palanque-Delabrouille, K. Pan, P. Pandey, I. Pâris, W. J. Percival, P. Petitjean, R. Pfaffenberger, J. Pforr, S. Phleps, C. Pichon, M. M. Pieri, F. Prada, A. M. Price-Whelan, M. J. Raddick, B. H. F. Ramos, C. Reylé, J. Rich, G. T. Richards, H.-W. Rix, A. C. Robin, H. J. Rocha-Pinto, C. M. Rockosi, N. A. Roe, E. Rollinde, A. J. Ross, N. P. Ross, B. M. Rossetto, A. G. Sánchez, C. Sayres, D. J. Schlegel, K. J. Schlesinger, S. J. Schmidt, D. P. Schneider, E. Sheldon, Y. Shu, J. Simmerer, A. E. Simmons, T. Sivarani, S. A. Snedden, J. S. Sobeck, M. Steinmetz, M. A. Strauss, A. S. Szalay, M. Tanaka, A. R. Thakar, D. Thomas, J. L. Tinker, B. M. Tofflemire, R. Tojeiro, C. A. Tremonti, J. Vandenberg, M. Vargas Magaña, L. Verde, N. P. Vogt, D. A. Wake, J. Wang, B. A. Weaver, D. H. Weinberg, M. White, S. D. M. White, B. Yanny, N. Yasuda, C. Yeche, and I. Zehavi, The Eighth Data Release of the Sloan Digital Sky Survey: First Data from SDSS-III, ApJ Supp 193 (Apr., 2011) 29, [arXiv:1101.1559].
- [15] A. J. Ross, W. J. Percival, A. G. Sánchez, L. Samushia, S. Ho, E. Kazin, M. Manera, B. Reid, M. White, R. Tojeiro, C. K. McBride, X. Xu, D. A. Wake, M. A. Strauss, F. Montesano, M. E. C. Swanson, S. Bailey, A. S. Bolton, A. M. Dorta, D. J. Eisenstein, H. Guo, J.-C. Hamilton, R. C. Nichol, N. Padmanabhan, F. Prada, D. J. Schlegel, M. V. Magaña, I. Zehavi, M. Blanton, D. Bizyaev, H. Brewington, A. J. Cuesta, E. Malanushenko, V. Malanushenko, D. Oravetz, J. Parejko, K. Pan, D. P. Schneider, A. Shelden, A. Simmons, S. Snedden, and G.-b. Zhao, The clustering of galaxies in the SDSS-III Baryon Oscillation Spectroscopic Survey: analysis of potential systematics, MNRAS 424 (July, 2012) 564–590, [arXiv:1203.6499].
- [16] A. Dressler and S. M. Faber, Confirmation of a large-scale, large-amplitude flow in the direction of the great attractor, ApJ 354 (May, 1990) 13–17.
- [17] S. Courteau, S. M. Faber, A. Dressler, and J. A. Willick, Streaming motions in the local universe - Evidence for large-scale, low-amplitude density fluctuations, ApJL 412 (Aug., 1993) L51–L54.
- [18] H. A. Feldman and R. Watkins, Theoretical expectations for bulk flows in large-scale surveys, ApJL 430 (July, 1994) L17–L20, [astro-ph/9312038].
- [19] N. A. Bahcall, M. Gramann, and R. Cen, The motions of clusters and group of galaxies, ApJ 436 (Nov., 1994) 23–32, [astro-ph/9410061].
- [20] M. J. Hudson, Optical galaxies within 8000 km s-1 - IV. The peculiar velocity field, MNRAS 266 (Jan., 1994) 475–488.
- [21] J. A. Willick, Statistical bias in distance and peculiar velocity estimation. 1: The ’calibration’ problem, ApJ Supp 92 (May, 1994) 1–31.
- [22] R. Watkins and H. A. Feldman, Interpreting New Data on Large-Scale Bulk Flows, ApJL 453 (Nov., 1995) L73+, [astro-ph/9505038].
- [23] N. A. Bahcall and S. P. Oh, The Peculiar Velocity Function of Galaxy Clusters, ApJL 462 (May, 1996) L49, [astro-ph/9602149].
- [24] R. Watkins, The RMS peculiar velocity of clusters, MNRAS 292 (Dec., 1997) L59–L63, [astro-ph/9710170].
- [25] R. Giovanelli, M. P. Haynes, J. J. Salzer, G. Wegner, L. N. da Costa, and W. Freudling, The Motions of Clusters of Galaxies and the Dipoles of the Peculiar Velocity Field, AJ 116 (Dec., 1998) 2632–2643, [astro-ph/9808158].
- [26] M. J. Hudson, R. J. Smith, J. R. Lucey, D. J. Schlegel, and R. L. Davies, A Large-scale Bulk Flow of Galaxy Clusters, ApJL 512 (Feb., 1999) L79–L82, [astro-ph/9901001].
- [27] J. A. Willick, The Las Campanas/Palomar 10,000 Kilometer Per Second Cluster Survey. I. Properties of the Tully-Fisher Relation, ApJ 516 (May, 1999) 47–61, [astro-ph/9809160].
- [28] S. Courteau, J. A. Willick, M. A. Strauss, D. Schlegel, and M. Postman, Shellflow. I. The Convergence of the Velocity Field at 6000 Kilometers Per Second, ApJ 544 (Dec., 2000) 636–640, [astro-ph/0002420].
- [29] R. Watkins and H. A. Feldman, Power spectrum shape from peculiar velocity data, MNRAS 379 (July, 2007) 343–348, [astro-ph/0702751].
- [30] T. M. Davis and M. I. Scrimgeour, Deriving accurate peculiar velocities (even at high redshift), MNRAS 442 (Aug., 2014) 1117–1122, [arXiv:1405.0105].
- [31] A. Nusser, An Inconsistency in the Standard Maximum Likelihood Estimation of Bulk Flows, ApJ 795 (Nov., 2014) 3, [arXiv:1405.6271].
- [32] A. Kashlinsky and B. J. T. Jones, Large-scale structure in the universe, Nature 349 (Feb., 1991) 753–760.
- [33] F. C. v. d. Bosch, F. Jiang, A. Hearin, D. Campbell, D. Watson, and N. Padmanabhan, Coming of age in the dark sector: how dark matter haloes grow their gravitational potential wells, MNRAS 445 (Dec., 2014) 1713–1730, [arXiv:1409.2750].
- [34] E. Komatsu, J. Dunkley, M. R. Nolta, C. L. Bennett, B. Gold, G. Hinshaw, N. Jarosik, D. Larson, M. Limon, L. Page, D. N. Spergel, M. Halpern, R. S. Hill, A. Kogut, S. S. Meyer, G. S. Tucker, J. L. Weiland, E. Wollack, and E. L. Wright, Five-Year Wilkinson Microwave Anisotropy Probe Observations: Cosmological Interpretation, ApJ Supp 180 (Feb., 2009) 330–376, [arXiv:0803.0547].
- [35] R. W. Pike and M. J. Hudson, Cosmological Parameters from the Comparison of the 2MASS Gravity Field with Peculiar Velocity Surveys, ApJ 635 (Dec., 2005) 11–21, [astro-ph/0511012].
- [36] A. Abate and P. Erdoǧdu, Peculiar velocities into the next generation: cosmological parameters from the SFI++ survey, MNRAS 400 (Dec., 2009) 1541–1547, [arXiv:0905.2967].
- [37] A. Nusser, E. Branchini, and M. Davis, Bulk Flows from Galaxy Luminosities: Application to 2Mass Redshift Survey and Forecast for Next-generation Data Sets, ApJ 735 (July, 2011) 77–+, [arXiv:1102.4189].
- [38] A. Nusser and M. Davis, The Cosmological Bulk Flow: Consistency with CDM and z 0 Constraints on 8 and , ApJ 736 (Aug., 2011) 93, [arXiv:1101.1650].
- [39] R. Watkins, H. A. Feldman, and M. J. Hudson, Consistently large cosmic flows on scales of 100h-1Mpc: a challenge for the standard CDM cosmology, MNRAS 392 (Jan., 2009) 743–756, [arXiv:0809.4041].
- [40] H. A. Feldman, R. Watkins, and M. J. Hudson, Cosmic flows on 100 h-1 Mpc scales: standardized minimum variance bulk flow, shear and octupole moments, MNRAS 407 (Oct., 2010) 2328–2338, [arXiv:0911.5516].
- [41] Y.-Z. Ma, C. Gordon, and H. A. Feldman, Peculiar velocity field: Constraining the tilt of the Universe, Phys Rev D 83 (May, 2011) 103002–+, [arXiv:1010.4276].
- [42] S. J. Turnbull, M. J. Hudson, H. A. Feldman, M. Hicken, R. P. Kirshner, and R. Watkins, Cosmic flows in the nearby universe from Type Ia supernovae, MNRAS 420 (Feb., 2012) 447–454, [arXiv:1111.0631].
- [43] E. Macaulay, H. A. Feldman, P. G. Ferreira, A. H. Jaffe, S. Agarwal, M. J. Hudson, and R. Watkins, Power spectrum estimation from peculiar velocity catalogues, MNRAS 425 (Sept., 2012) 1709–1717, [arXiv:1111.3338].
- [44] R. Watkins and H. A. Feldman, An Unbiased Estimator of Peculiar Velocity with Gaussian Distributed Errors for Precision Cosmology, ArXiv e-prints (Nov., 2014) [arXiv:1411.6665].
- [45] R. Watkins and H. A. Feldman, Large-scale bulk flows from the Cosmicflows-2 catalogue, MNRAS 447 (Feb., 2015) 132–139, [arXiv:1407.6940].
- [46] N. Kaiser, Theoretical implications of deviations from Hubble flow, MNRAS 231 (Mar., 1988) 149–167.
- [47] E. Macaulay, H. Feldman, P. G. Ferreira, M. J. Hudson, and R. Watkins, A slight excess of large-scale power from moments of the peculiar velocity field, MNRAS 414 (June, 2011) 621–626, [arXiv:1010.2651].
- [48] S. Agarwal, H. A. Feldman, and R. Watkins, Testing the minimum variance method for estimating large-scale velocity moments, MNRAS 424 (Aug., 2012) 2667–2675, [arXiv:1201.0128].
- [49] T. Hong, C. M. Springob, L. Staveley-Smith, M. I. Scrimgeour, K. L. Masters, L. M. Macri, B. S. Koribalski, D. H. Jones, and T. H. Jarrett, 2MTF - IV. A bulk flow measurement of the local Universe, MNRAS 445 (Nov., 2014) 402–413, [arXiv:1409.0287].
- [50] M. I. Scrimgeour, T. M. Davis, C. Blake, L. Staveley-Smith, C. Magoulas, C. M. Springob, F. Beutler, M. Colless, A. Johnson, D. H. Jones, J. Koda, J. R. Lucey, Y.-Z. Ma, J. Mould, and G. B. Poole, The 6dF Galaxy Survey: bulk flows on 50-70 h-1 Mpc scales, MNRAS 455 (Jan., 2016) 386–401, [arXiv:1511.06930].
- [51] M. Li, J. Pan, L. Gao, Y. Jing, X. Yang, X. Chi, L. Feng, X. Kang, W. Lin, G. Shan, L. Wang, D. Zhao, and P. Zhang, Bulk Flow of Halos in CDM Simulation, ApJ 761 (Dec., 2012) 151, [arXiv:1207.5338].
- [52] B. Rathaus, E. D. Kovetz, and N. Itzhaki, Studying the peculiar velocity bulk flow in a sparse survey of Type Ia SNe, MNRAS 431 (June, 2013) 3678–3684, [arXiv:1301.7710].
- [53] A. Dressler, S. M. Faber, D. Burstein, R. L. Davies, D. Lynden-Bell, R. J. Terlevich, and G. Wegner, Spectroscopy and photometry of elliptical galaxies - A large-scale streaming motion in the local universe, ApJL 313 (Feb., 1987) L37–L42.
- [54] D. Lynden-Bell, O. Lahav, and D. Burstein, Cosmological deductions from the alignment of local gravity and motion, MNRAS 241 (Nov., 1989) 325–345.
- [55] M. S. Turner, The tilted universe, General Relativity and Gravitation 24 (Jan., 1992) 1–7.
- [56] A. Kashlinsky, F. Atrio-Barandela, D. Kocevski, and H. Ebeling, A Measurement of Large-Scale Peculiar Velocities of Clusters of Galaxies: Results and Cosmological Implications, ApJL 686 (Oct., 2008) L49–L52, [arXiv:0809.3734].
- [57] K. Larjo and T. S. Levi, Bubble, bubble, flow and Hubble: large scale galaxy flow from cosmological bubble collisions, JCAP 8 (Aug., 2010) 34, [arXiv:0910.4159].
- [58] A. Fialkov, N. Itzhaki, and E. D. Kovetz, Cosmological imprints of pre-inflationary particles, JCAP 2 (Feb., 2010) 4, [arXiv:0911.2100].
- [59] R. B. Tully, E. J. Shaya, I. D. Karachentsev, H. M. Courtois, D. D. Kocevski, L. Rizzi, and A. Peel, Our Peculiar Motion Away from the Local Void, ApJ 676 (Mar., 2008) 184–205, [arXiv:0705.4139].
- [60] J. Bland-Hawthorn and S. Sharma, Void asymmetries in the cosmic web: a mechanism for bulk flows, ArXiv e-prints (Oct., 2014) [arXiv:1410.3845].
- [61] C. McBride, A. Berlind, R. Scoccimarro, R. Wechsler, M. Busha, J. Gardner, and F. van den Bosch, LasDamas Mock Galaxy Catalogs for SDSS, BAAS 41 (Jan., 2009) 425.06.
- [62] J. Kim, C. Park, J. R. Gott, III, and J. Dubinski, The Horizon Run N-Body Simulation: Baryon Acoustic Oscillations and Topology of Large-scale Structure of the Universe, ApJ 701 (Aug., 2009) 1547–1559, [arXiv:0812.1392].
- [63] Y. B. Zel’dovich, Gravitational instability: An approximate theory for large density perturbations., AAPS 5 (Mar., 1970) 84–89.
- [64] D. J. Eisenstein, H.-J. Seo, E. Sirko, and D. N. Spergel, Improving Cosmological Distance Measurements by Reconstruction of the Baryon Acoustic Peak, ApJ 664 (Aug., 2007) 675–679, [astro-ph/0604362].
- [65] M. Davis, G. Efstathiou, C. S. Frenk, and S. D. M. White, The evolution of large-scale structure in a universe dominated by cold dark matter, ApJ 292 (May, 1985) 371–394.
- [66] J. P. Gardner, A. Connolly, and C. McBride, A Framework for Analyzing Massive Astrophysical Datasets on a Distributed Grid, PASP 376 (Oct., 2007) 69.
- [67] M. Crocce, S. Pueblas, and R. Scoccimarro, Transients from initial conditions in cosmological simulations, MNRAS 373 (Nov., 2006) 369–381, [astro-ph/0606505].
- [68] P. J. E. Peebles, The large-scale structure of the universe. Princeton, N.J., Princeton University Press, 1980, 1980.
- [69] E. V. Linder, Cosmic growth history and expansion history, Phys Rev D 72 (Aug., 2005) 043529, [astro-ph/0507263].