Longitudinal Asymmetry and its Measurable Effects in Pb-Pb Collisions at 2.76 TeV
Abstract
Collisions of identical nuclei at finite impact parameter have an unequal number of participating nucleons from each nucleus due to fluctuations. The event-by-event fluctuations have been estimated by measuring the difference of energy in the zero-degree calorimeters on either side of interaction vertex. The fluctuations affect the global variables such as the rapidity distributions, and the effect has been correlated with a measure of these fluctuations.
keywords:
ALICE , heavy-ion collisions , longitudinal asymmetry , fluctuations , pseudorapidity distributionsNuclear Physics A \runauth \jidnupha \jnltitlelogoNuclear Physics A
1 Introduction
In a collision of two identical nuclei at any impact parameter, density fluctuations lead to an unequal number of participants from each colliding nucleus. The participating nucleons make up the participant zone, which has a non-zero momentum in the nucleon-nucleon centre-of-mass (CM) frame, which is also the laboratory frame for most collider experiments. These collisions have an innate longitudinal asymmetry which is expected to manifest itself in some measurable observables. A limiting case of such an asymmetry is seen in p-A collisions where there is an excess of particles on the A-side as compared to the p-side, and the pseudorapidity distribution may be a little wider on the A-side. This asymmetry will affect all measurements that are affected by fluctuations, by the number of participants and by the symmetry about the nucleon-nucleon CM frame. One such observable is the rapidity distribution of charged particles. In the present talk, we will estimate the initial state asymmetry and find its effect on the rapidity distribution by comparing them in collisions of different asymmetries.
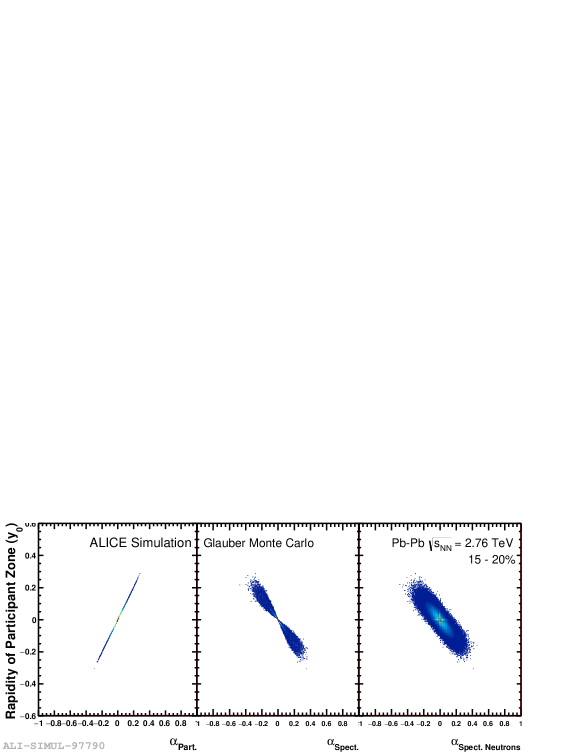
The initial state asymmety is defined using the generic definition , where and are the number of participating nucleons from each nucleus. This asymmetry causes a shift in the rapidity of the participant zone . At an impact parameter of 6.5 fm, Glauber model [1] calculation gives the mean number of participants in a Pb-Pb collision as 120. Assuming fluctuations to cause a collision to have 126 and 114 participants from the two nuclei yields . The shift in rapidity of the CM is related to the asymmetry in the number of participants, in the number of spectators, and in the number of neutron spectators, albeit with a poorer resolution, as shown in the three panels of Fig. 1.
Data was recorded for Pb-Pb collisions at =2.76 TeV in 2010 in the ALICE experiment. The centrality of the collision was estimated using the multiplicity in the V0 detectors ( and ) and also using the track multiplicity in the Time Projection Chamber (TPC) and the Inner Tracking System (ITS) in the region . The effect of asymmetry was studied on the charged particle pseudorapidity distributions measured using the hits in the V0 detector and also using the charged particle tracks constructed using information from the TPC and the ITS [2]. The analysis was performed on a total of about 3 M events in 0-40% central events, equally populating 5% centrality bins. The data corresponded to a minimum bias trigger with the vertex cuts cm and cm. The spectator neutrons are measured in the neutron Zero-Degree Calorimeters (ZDCs) on either side of the interaction vertex ( 8, at about 114 meters away from the nominal interaction vertex).
2 Analysis: Measuring Asymmetry and its Effect on (Pseudo)rapidity Distributions
For the most central collisions the spectator size is small, and fragments into individual nucleons. The few neutrons measured in the ZDC are a good estimate of the neutron spectators, and hence of the asymmety of the collisions. With increasing impact parameter, the larger spectator fragments into smaller nuclei and individual nucleons. The charged spectators are bent away from the direction of neutron ZDCs by the magnetic field. The neutrons reaching the ZDCs are less than the actual number of neutron spectators. The effect of neutron loss on the asymmetry is investigated in simulations.
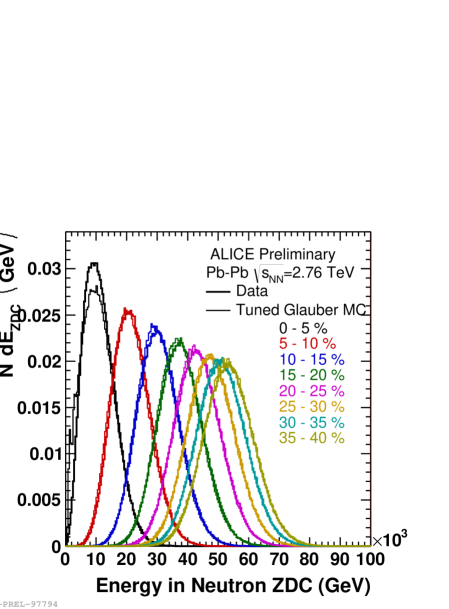

Knowing the number of neutron spectators and the response of the ZDC [3], the energy distribution in the ZDCs was obtained in a Tuned Glauber Monte-Carlo model (TGMC) by tuning the loss of neutrons using a common functional form to reproduce the energy spectrum in the ZDCs for different centralities. Fig. 2 shows the distribution of energy in the ZDC, and the distribution of asymmetry, as obtained using the tuned Glauber model and in data. The asymmetry in each event is obtained as where and denote the energy measured in that event in the two neutron ZDCs on either side of the interaction vertex. The agreement for all cases, other than the most central, is quite good, validating the use of ZDC measurement as an estimate of the asymmetry.
Experiments over the last many decades have shown that particle production is symmetric about the CM in N-N collisions, as also expected from the symmetry of the collision. In nucleus-nucleus collisions, assuming that the particle production is symmetric about the shifted rapidity of the participant zone, and assuming that the particle rapidity distribution can be described by a Gaussian, the ratio of distributions for asymmetric and symmetric events can be expressed as
| (1) |
For symmetric collisions, Considering that is small, the ratio yields . Since the experiment measures the pseudorapidity distributions, it is worth investigating whether the ratio remains linear with pseudorapidity. Toy-model simulations suggest that the ratio can be approximated as 1 + , and the coefficient is still related to the shift in the CM rapidity by , to within 5%.
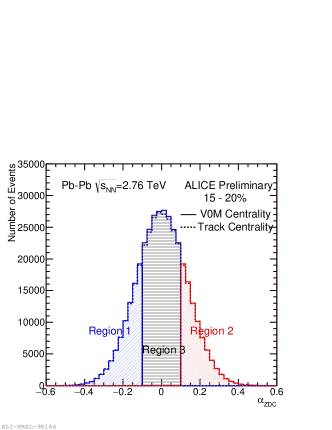
The asymmetry distribution of each centrality class may be used to classify the events as symmetric or asymmetric events. Fig. 3 shows the asymmetry distribution as obtained using measurements in the ZDCs, for the centrality interval 15-20%. Events with (region 3) are considered as symmetric events and events with were considered as the two Regions (1 and 2) of asymmetric events.
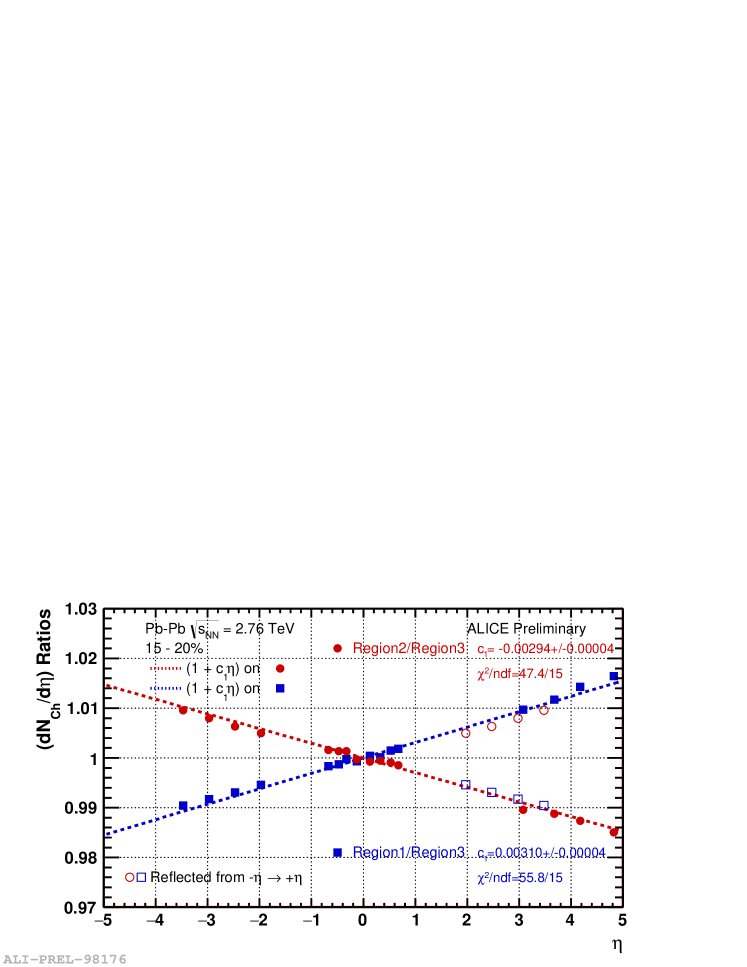
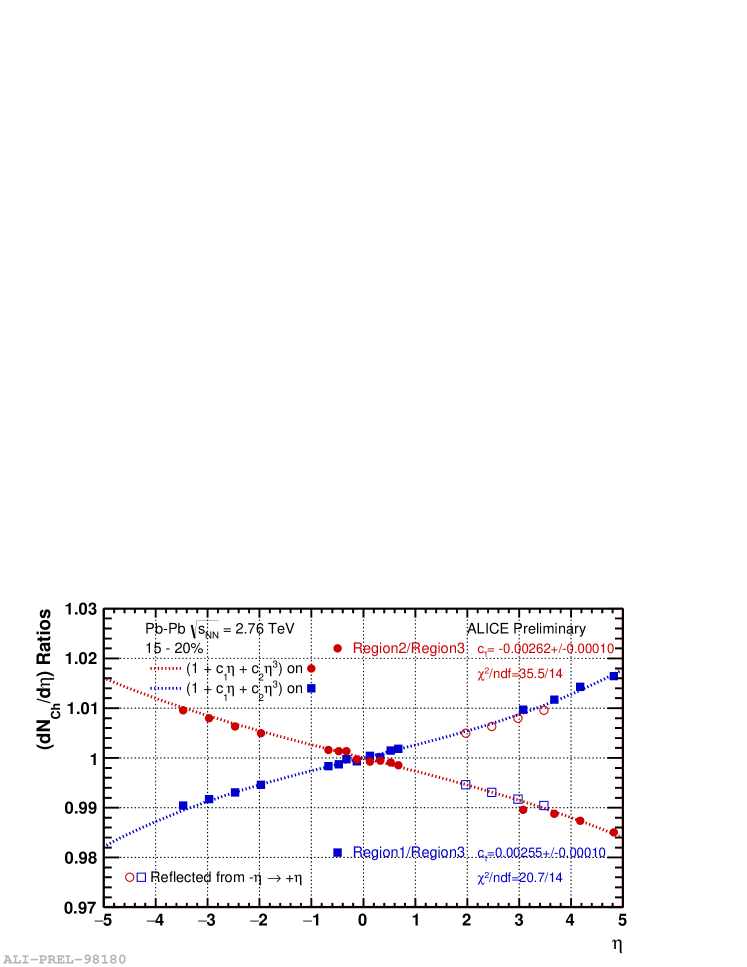
The ratio of the measured pseudorapidity distributions for Region-1 to Region-3 and Region-2 to Region-3 can be used to obtain the coefficient . Taking the ratio of the pseudorapidity distributions cancels out most systematic uncertainties. The ratio of is obtained in the central rapidity region, and in the region of acceptance of the V0 detectors. The linear fits (1 + ) to the ratios are shown in Fig. 4(a). The details are described in the caption.
3 Results
The ratios of distributions for each centrality were fitted with both the linear function and the cubic function for both Region-1/Region-3 and Region-2/Region-3. The cubic function fitted better in each case. The coefficient is plotted as a function of centrality of the collisions in Fig. 6.
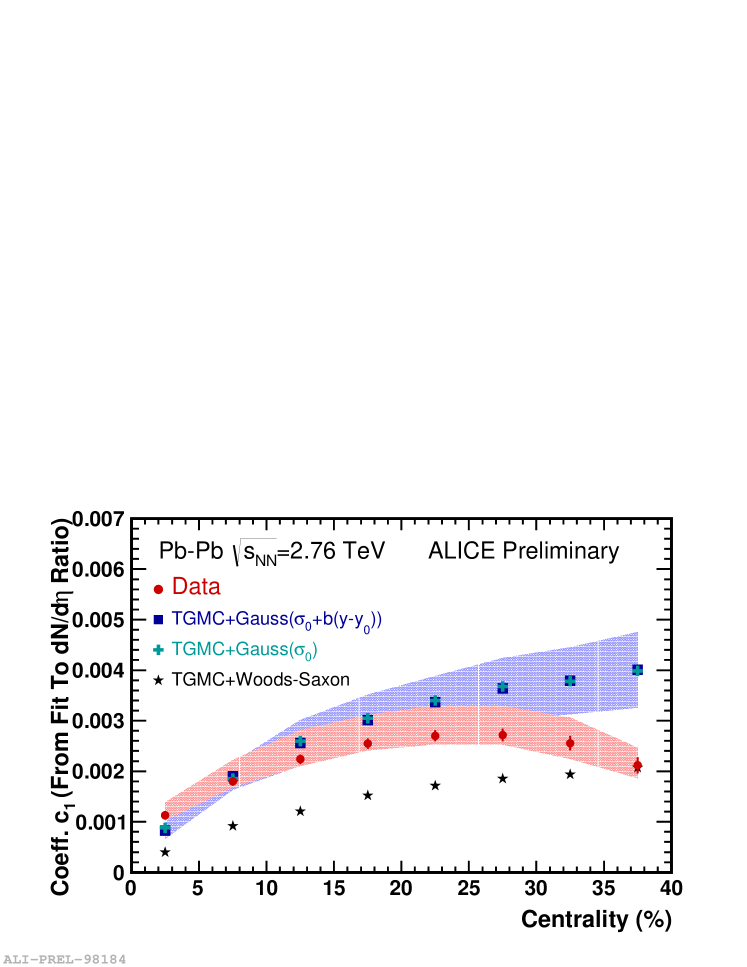
The systematic errors shown in the figure are due to changes in centrality critieria, vertex cuts, difference in Region-1 and Region-2, and difference in values of in a linear and in a cubic fit.
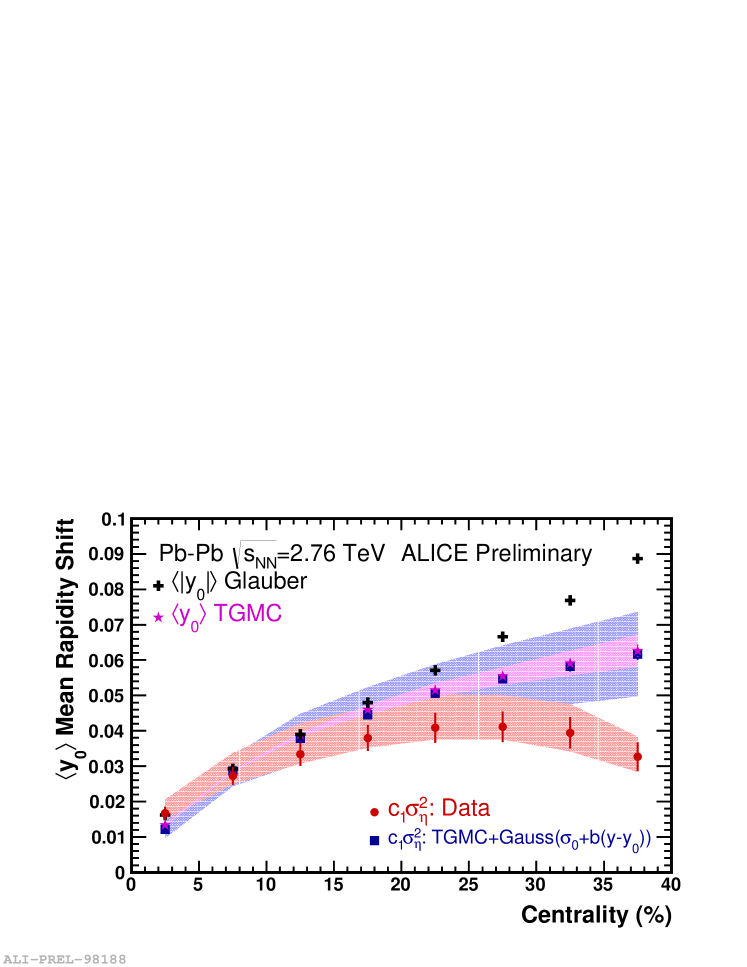
Using the TGMC, a response matrix was obtained between shift in the rapidity of the participant zone () and the event-asymmetry obtained from simulated values of energy deposited in neutron ZDCs, similar to the response matrix from neutron spectators shown in the last panel of Fig. 1. The distributions of were obtained for each asymmetry region by unfolding the corresponding matrix. The process was repeated for each centrality. The resulting -distributions were used along with different assumptions of initial rapidity distributions (Gaussian, Gaussian-like with rapidity dependent sigma, Woods-Saxon), and realistic pT distributions [4] in a toy-model simulation to determine the distributions for different asymmetry regions. The free parameters in the initial rapidity distributions were chosen to reproduce the experimental pseudorapidity distributions. The ratio of for asymmetric to symmetric region (Region-1(2)/Region-3) was fitted with a cubic function. The resulting values of are also shown in Fig. 6.
Fig. 6 shows the values of the rapidity-shift obtained in four different ways, including the known values from the Glauber model calculation. Using the TGMC, the mean value of rapidity shift was obtained for the asymmetric events as described above. The empirical relation between and the rapidity shift () is used for the data and for the simulated events. For more central events, there is good agreement between the values of obtained in different ways.
4 Summary
The present analysis demonstrates that fluctuations in the initial state cause a longitudinal asymmetry which shifts the rapidity of the participant zone by . The asymmetry has been estimated by measuring the energy in the ZDCs on either side of the interaction vertex, providing a model dependent method for determining the shift in rapdity . This asymmetry was shown to manifest itself in the final state pseudorapidity distributions of charged particles and the magnitude of the effect is related to the initial state asymmetry. The event-asymmetry is a useful variable to classify events to investigate the effect of longitudinal fluctuations and to study the systematic dependence of various observables on this asymmetry.
References
- [1] B. Alver, M. Baker, C. Loizides, and P. Steinberg, arXiv : 0805.4411.
- [2] ALICE Collaboration, Int. J. Mod. Phys. A29 (2014) 1430044.
- [3] ALICE Collaboration, Phys. Rev. C88 (2013) 044909.
- [4] ALICE Collaboration, Phys. Rev. C88 (2013) 044910.