Thermal evolution of antiferromagnetic correlations and tetrahedral bond angles in superconducting FeTe1-xSex
Abstract
It has recently been demonstrated that dynamical magnetic correlations measured by neutron scattering in iron chalcogenides can be described with models of short-range correlations characterized by particular choices of four-spin plaquettes, where the appropriate choice changes as the parent material is doped towards superconductivity. Here we apply such models to describe measured maps of magnetic scattering as a function of two-dimensional wave vectors obtained for optimally superconducting crystals of FeTe1-xSex. We show that the characteristic antiferromagnetic wave vector evolves from that of the bicollinear structure found in underdoped chalcogenides (at high temperature) to that associated with the stripe structure of antiferromagnetic iron arsenides (at low temperature); these can both be described with the same local plaquette, but with different inter-plaquette correlations. While the magnitude of the low-energy magnetic spectral weight is substantial at all temperatures, it actually weakens somewhat at low temperature, where the charge carriers become more itinerant. The observed change in spin correlations is correlated with the dramatic drop in the electronic scattering rate and the growth of the bulk nematic response on cooling. Finally, we also present powder neutron diffraction results for lattice parameters in FeTe1-xSex indicating that the tetrahedral bond angle tends to increase towards the ideal value on cooling, in agreement with the increased screening of the crystal field by more itinerant electrons and the correspondingly smaller splitting of the Fe orbitals.
pacs:
74.70.Xa, 75.25.-j, 75.30.Fv, 61.05.fgI Introduction
The roles of magnetic fluctuations and orbital ordering are at the center of a continuing debate in the field of iron-based superconductors (FeBS). While their contributions to the superconducting mechanism are of particular interest Mazin (2008); Kuroki et al. (2008); Kontani and Onari (2010), another forum concerns the nature of the nematic electronic response Fernandes et al. (2014). In an attempt to look for minimal models, the discussion is often focused on an exclusive choice: either magnetic correlations Fang et al. (2008a); Xu et al. (2008); Mazin and Johannes (2009) or orbital fluctuations Lv et al. (2009); Krüger et al. (2009) are the dominant factor.
Experimental evidence for nematic response was first obtained in the BaFe2As2 system Chu et al. (2010); Yi et al. (2011); Chu et al. (2012); Kuo et al. (2013); Shapiro et al. (2015); Lu et al. (2014), where a structural transition that lowers the rotational symmetry from to is closely followed by antiferromagnetic ordering Huang et al. (2008); Chu et al. (2009); Pratt et al. (2009), with modulation wave vector 111Here we have used the notation commonly used by theorists, which assumes a single Fe per unit cell and units of . When discussing experimental data, we will refer to a unit cell containing two Fe atoms, in units of .. New interest has been generated by the recent observations of nematicity in FeSe Baek et al. (2015), a superconducting compound that exhibits a symmetry-lowering structural transition but no magnetic order Böhmer et al. (2015); Imai et al. (2009). Of particular interest is the observation of a temperature dependent splitting of and orbitals through angle-resolved photoemission spectroscopic (ARPES) studies Shimojima et al. (2014); Nakayama et al. (2014); Zhang et al. (2015).
While several analyses have shown that it is possible to have a nematic response due to dynamic magnetic correlations alone Wang et al. (2015a); Yu and Si (2015); Glasbrenner et al. (2015), driving a transition to an orthorhombic phase Böhmer et al. (2015) with fluctuations alone is another matter. In any case, one might wonder to what extent the distinction between magnetic and orbital correlations is artificial. Experimentally, there is no question that there are substantial instantaneous magnetic moments on Fe sites in the FeBS compounds, both from x-ray emission spectroscopy Gretarsson et al. (2011); Mannella (2014) and from neutron scattering Dai (2015); Tranquada et al. (2014), and that these moments are generally antiferromagnetically correlated Dai (2015); Tranquada et al. (2014), regardless of whether static order is observed. In particular, low-energy magnetic excitations about the wave vector have been observed in FeSe by neutron scattering Rahn et al. (2015); Wang et al. (2015b). These observations are supported by theoretical calculations using Dynamical Mean Field Theory (DMFT) Yin et al. (2011). At the same time, a number of analyses have found that models consistent with the magnetic order also exhibit partial orbital ordering Krüger et al. (2009); Lee et al. (2009); Lv et al. (2009); Dai et al. (2012); Bascones et al. (2010), involving broken degeneracy of the and orbitals. Indeed, an energy splitting between bands of dominant and character has been observed Yi et al. (2011) over the same range of temperatures as anisotropies of the intensity of spin excitations Lu et al. (2014).
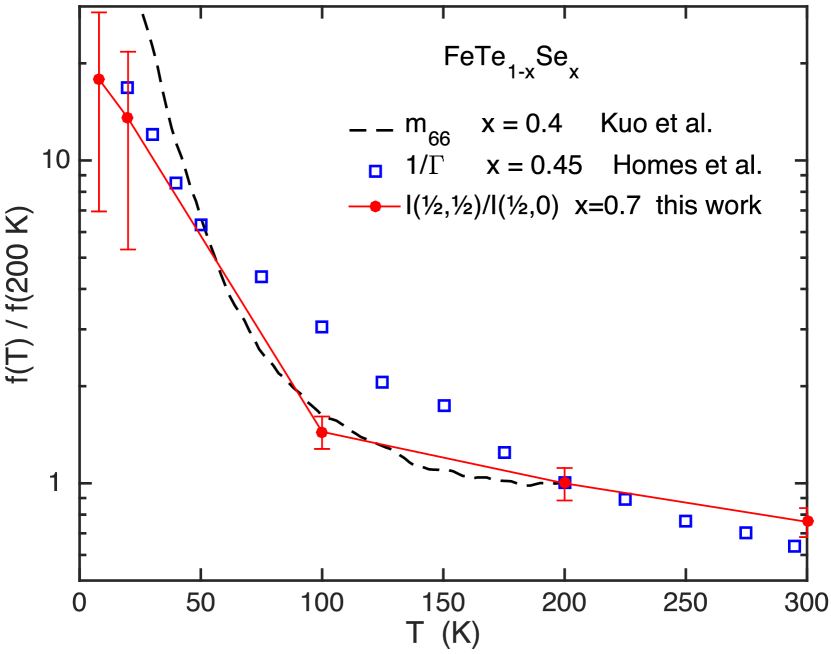
While FeSe has garnered a lot of attention, FeTe1-xSex in the regime of optimal superconducting transition temperature () is also rather interesting. Although the average crystal structure remains tetragonal, elastoresistance measurements demonstrate a strong nematic response in the symmetry channel that appears to diverge at low temperature, similar to other optimally-doped Fe-pnictide superconductors Kuo et al. (2015), as reproduced in Fig. 1. Furthermore, there is an evidence of the local C4 symmetry breaking down to C2 in the pattern of short-range dynamical magnetic correlations measured by neutron scattering in parent material FeTe with S, or Se doping, and also on cooling in a composition that is superconducting Zaliznyak et al. (2015), while ARPES measurements at 25 K indicate a splitting of the and bands at zone center Johnson et al. (2015). The coherence of the charge carriers also shows a strong temperature dependence: optical conductivity measurements find a component that becomes coherent only at low temperature, with the inverse of the energy width growing on cooling Homes et al. (2015).
An important aspect of the orbital nature of the electronic band structure involves splitting between bands with and character, which is sensitive to deviations from the ideal tetrahedral bond angle of 109.5∘ Yin et al. (2011). In FeTe1-xSex, the bond angles are essentially controlled by the height of the chalcogenide ions above and below the Fe layers, with the bond angle dropping from 104∘ in FeSe to in Fe1+yTe McQueen et al. (2009); Louca et al. (2010). It was argued Moon and Choi (2010) that the change in height of the chalcogenide ions modifies the relative magnitudes of superexchange couplings (although the concept of superexchange is not well defined for multi-orbital FeBS with a high degree of itinerancy Mazin (2010)), resulting in a change of the characteristic antiferromagnetic wave vector from that describing the double-stripe order known to occur in Fe1+yTe Bao et al. (2009); Li et al. (2009); Wen et al. (2009), to that of the dynamical single-stripe correlations in superconducting FeTe1-xSex Qiu et al. (2009); Lee et al. (2010); Lumsden et al. (2010); Liu et al. (2010). (See Table 1 for a clear definition of the wave-vector notation used in this paper.)
In this paper, we study the temperature-dependent change of the antiferromagnetic correlations in FeTe1-xSex by inelastic neutron scattering. We Xu et al. (2012, 2014) and others Tsyrulin et al. (2012) have previously shown that the low-energy excitations centered at in the superconducting state shift in reciprocal space on warming to 100 K and above; one-dimensional cuts through the “resonance” position reveal a change from a broad commensurate peak at to incommensurate correlations peaked near and . Here we present measurements covering two-dimensional slices of reciprocal space, finding that the main locus of the low-energy spectral weight in fact shifts from to on warming. Moreover, in a sample that is non-superconducting due to excess Fe, we show that the magnetic correlations remain pinned at .
The pattern observed here at high temperature and in the non-superconducting sample is quite similar to that recently reported by one of us (IZ) Zaliznyak et al. (2015) in a S-doped FeTe sample with filamentary superconductivity. There the pattern emerged upon cooling, replacing the high-temperature pattern characteristic of the parent Fe1+yTe Zaliznyak et al. (2011), indicating a transition between two different spin-liquid states. The measured spin-spin correlations were described by a model in which a long-range spin pattern is broken into four-spin plaquettes, with exponential decay of correlations between plaquettes with distance from the central plaquette. The change in symmetry of the model plaquettes needed to simulate the measured inelastic diffuse scattering suggested local breaking of the C4 symmetry down to C2 on cooling, prior to reaching the superconducting state. In the present case, we find that the spin correlations at both high and low temperatures can be modeled with the same choice of plaquette (having only C2 symmetry), but with the inter-plaquette correlations changing from the double-stripe to the single-stripe wave vector on cooling.
| 1-Fe unit cell | 2-Fe unit cell | |
|---|---|---|
Besides the change in characteristic wave vector, we also observe a decrease in low-energy magnetic weight on cooling, which parallels the increased itinerancy of charge carriers. Such behavior is qualitatively consistent with recent theoretical work Tam et al. (2015) and previous experimental results Zaliznyak et al. (2011, 2015).
To gain further insight into this curious thermal evolution, we have used neutron powder diffraction to measure the temperature dependence of the lattice parameters for a series of FeTe1-xSex with . For away from the limiting values, we find an anomalous rise in the ratio on cooling, corresponding to an increase in the tetrahedral bond angles. We infer an associated change in both the crystal-field splitting and the hybridization of the states. This, together with the evidence for nematic correlations Kuo et al. (2015) and splitting at low temperature Johnson et al. (2015), indicates that the change in magnetic correlations with temperature can be associated with changing exchange couplings.
II Experimental Methods
The single crystals of FeTe1-xSex studied here were grown by unidirectional solidification Wen et al. (2011). Here we study superconducting samples with (SC50) and (SC70), each with K, and a non-superconducting sample with (NSC45) and excess Fe. Previous characterizations of these crystals have been reported in Wen et al. (2010); Lee et al. (2010); Xu et al. (2010, 2011, 2014). From here on, we will specify momentum transfer in units of , where we assume a tetragonal unit cell with 2 Fe atoms per unit cell, as illustrated in Fig. 2(a). (Room temperature lattice parameters are presented in Fig. 7.)
The inelastic neutron scattering experiments were performed on time-of-flight instruments at the Spallation Neutron Source (SNS), Oak Ridge National Laboratory (ORNL). The SC50 sample was measured on SEQUOIA (BL-17) Granroth et al. (2010), with an incident energy meV, using Fermi chopper number 1 at 360 Hz, and the [001] direction of the crystal aligned with the incident beam direction. As the measurements were done with a fixed orientation of the crystal, we obtained data as a function of excitation energy and , where is determined by and .
The SC70 and NSC45 samples were measured on HYSPEC (BL-14B) Winn, Barry et al. (2015) with meV and a chopper frequency of 180 Hz. With the [001] direction of the sample vertical (perpendicular to the scattering plane), the in-plane orientation was stepped by increments of 2∘ over a range of 180∘. The detectors were positioned to cover neutrons with scattering angles from 5∘ to 65∘. From the combined data, it is possible to extract slices at constant for the plane. The data have been symmetrized to enforce the 4-fold symmetry for better presentations.
The neutron powder diffraction measurements were performed at the intermediate-resolution diffractometer NOMAD (BL-1B) at the SNS Neuefeind et al. (2012). The samples were prepared by grinding pieces of single crystals. The compositions correspond to , where the sample has 10% excess of Fe, while the Fe excess in the other samples has been kept close to zero; superconducting transition temperatures for all samples except for were reported in Katayama et al. (2010). Note that the and powder samples are very similar to SC50 and SC70 samples, the powder sample does not have excess Fe (unlike NSC45) and is superconducting. Each sample of g was loaded into a vanadium can under a helium atmosphere, and then cooled in an “orange” (liquid helium) cryostat. Temperature-dependent measurements were performed while warming from 10 K to 300 K, with a counting time of 1 h per temperature.
To extract lattice parameters from the data, Le Bail refinements Le Bail (2005) were performed using GSAS Larson and Von Dreele (2000) operating under ExpGui platform Toby (2001); in general, only data from the highest-resolution backscattering detector bank were used. All data for all samples were fit with a tetragonal model based on the space group. In addition,the Fe1+yTe data were modeled with model below the phase transition temperature of K. For the FeSe sample, no phase transition was resolved.
III Results and Analysis
III.1 Magnetic Excitations
III.1.1 Data
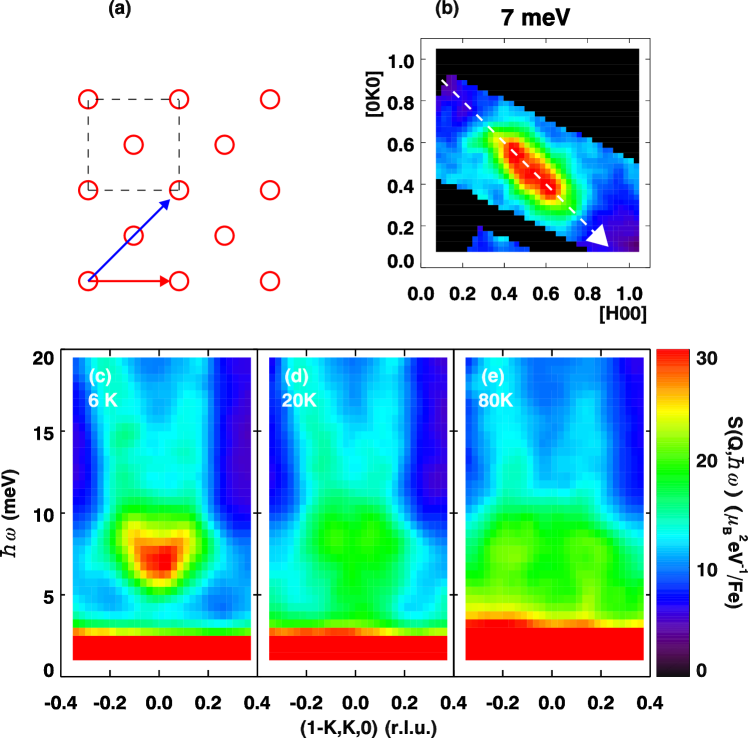
To make contact with previous work, we begin with the measurements on the SC50 sample at SEQUOIA. The magnetic excitation spectra about the stripe antiferromagnetic wave vector, , along the direction is plotted for several temperatures in Fig. 2. The spin gap of meV is clearly visible in the 6 K data. The intensity near the bottom of the dispersion is clearly enhanced in the superconducting phase and the magnetic excitations disperse outwards forming a “U” shape above this spin resonance energy Argyriou et al. (2010); Lee et al. (2010); Li et al. (2010); Xu et al. (2011). In the normal state at K, the spin resonance fades away and broadens in energy and , so that intensity moves into the spin gap; nevertheless, the overall shape of the magnetic excitation spectrum does not appear to change significantly.
In contrast, significant changes are observed for excitations near the bottom of the dispersion when the sample is warmed to 80 K, far above . In Fig. 2 (e), one can see that the scattered signal has broadened considerably in below 10 meV, and the bottom of the U-shaped dispersion appears to have split. This is consistent with the nominally incommensurate correlations previously observed in linear scans. Only for meV does the spectrum remain relatively unchanged with temperature.
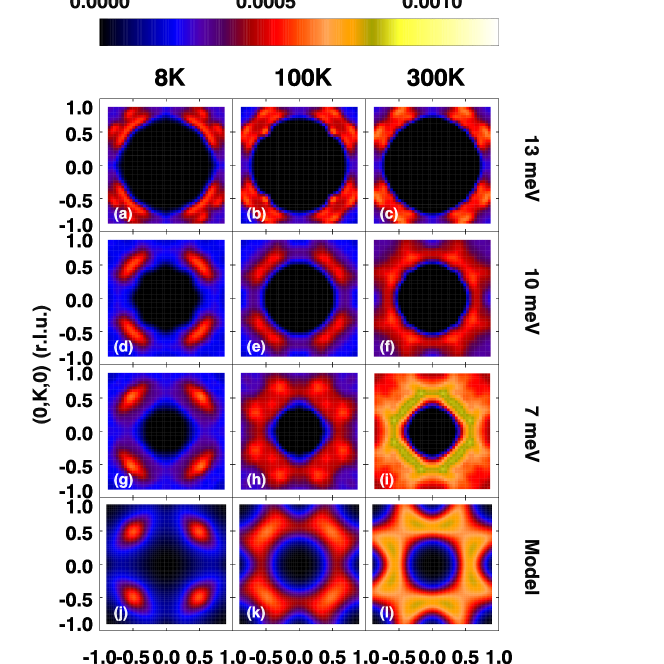
In order to understand the temperature-dependent changes in the low-energy scattering, however, we need to look at what is happening throughout the plane. For this, we turn to the measurements on the SC70 sample obtained at HYSPEC. Such constant-energy slices are plotted in Fig. 3 for energy transfers of 7, 10, and 13 meV, and temperatures of 8, 100, and 300 K. In the superconducting phase (), the low energy ( meV) magnetic excitations have ellipsoidal shapes centered on positions, with the long axis oriented in the transverse direction [Fig. 3 (g)]. The excitations at higher energies spread out along the transverse directions away from [Fig. 3 (d),(a)], consistent with the dispersion shown in Fig. 2. On warming to 100 K, the low-energy intensity maxima [Fig. 3 (g)] move away from , again consistent with Fig. 2.
At 300 K, the redistribution of low-energy signal in reciprocal space and an intensity enhancement are more pronounced. The intensities appear to form a continuous, though structured, “squared” ring about . Corners of a “squared” ring going through the four (0.5,0) positions are reminiscent of the pattern observed in FeTe1-xSx Zaliznyak et al. (2015). In contrast, the temperature-induced changes in the intensity distribution are much less pronounced at 10 meV and are hardly noticeable at 13 meV, although the overall intensity increase is noticeable, similar to the trend observed in previous studies of FeTe and FeTe1-xSx Zaliznyak et al. (2011, 2015).
Similar measurements were performed on the NSC45 sample, and the results are shown in Fig. 4. The data at 300 K are rather similar to the high-temperature data for SC70. In contrast to SC70, however, cooling results in relatively little change to the scattering pattern at low energy, other than a reduction in intensity. In fact, low-temperature measurements on triple-axis spectrometers have shown that broad elastic scattering centered at is present at low temperature for NSC45 but is absent for SC70 222Zhijun Xu, Jinsheng Wen, and Guangyong Xu (unpublished)..
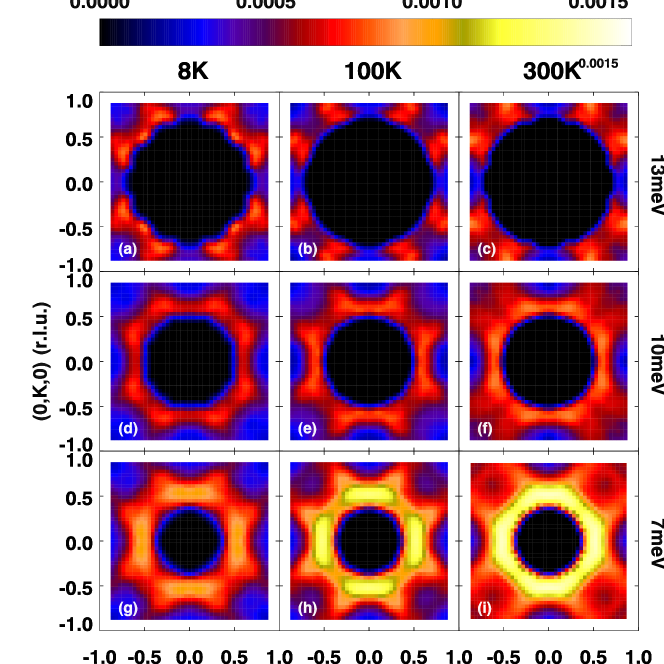
To put these results in perspective, the data for the SC50 and SC70 samples are consistent with one another and with our previous results on good bulk superconducting samples Xu et al. (2012, 2014, 2011), though the latter results covered a more restricted part of Q– space. Similarly, the data for the NSC45 sample are compatible with our previous measurements Xu et al. (2014) on nonsuperconducting, Se-doped samples, where excess Fe induces short-range antiferromagnetic order at low-temperature.
III.1.2 Modeling
Several studies have suggested that the exchange couplings governing magnetic correlations in the iron chalcogenides are strongly frustrated, resulting in a variety of spin configurations having very similar free energies Yin et al. (2010); Fang et al. (2009); Glasbrenner et al. (2015); Yin et al. (2012); Luo and Dagotto (2014). This frustration inhibits long-range magnetic order, and is qualitatively consistent with our observations of dynamical magnetic correlations with short correlation lengths. Nevertheless, while the magnetic moments are clearly disordered, we find that they carry signatures of specific local spin configurations.
Following Zaliznyak et al. Zaliznyak et al. (2015), we consider models of static, short-range spin correlations that may represent a snapshot of the behavior for low-energy spin excitations—specifically, for our meV data. Figure 5 shows a variety of models and their 4-fold symmetrized Fourier transforms. In each case, we start with a particular 4-spin plaquette; averaging over equivalent choices leads to the structure factor for the correlations. We then choose a particular antiferromagnetic wave vector to describe inter-plaquette phasing, with an exponential decay of the correlations with distance between plaquettes. For example, Fig. 5(a) and (b) use the same choice of plaquette (labeled up-down-up-down, or UDUD), but with longer-range correlations defined by and , respectively. This results in dramatically different scattering patterns, as indicated by Fig. 5(f) and (g). Figure 5 also shows several other choices of plaquette and modulation wave vector.
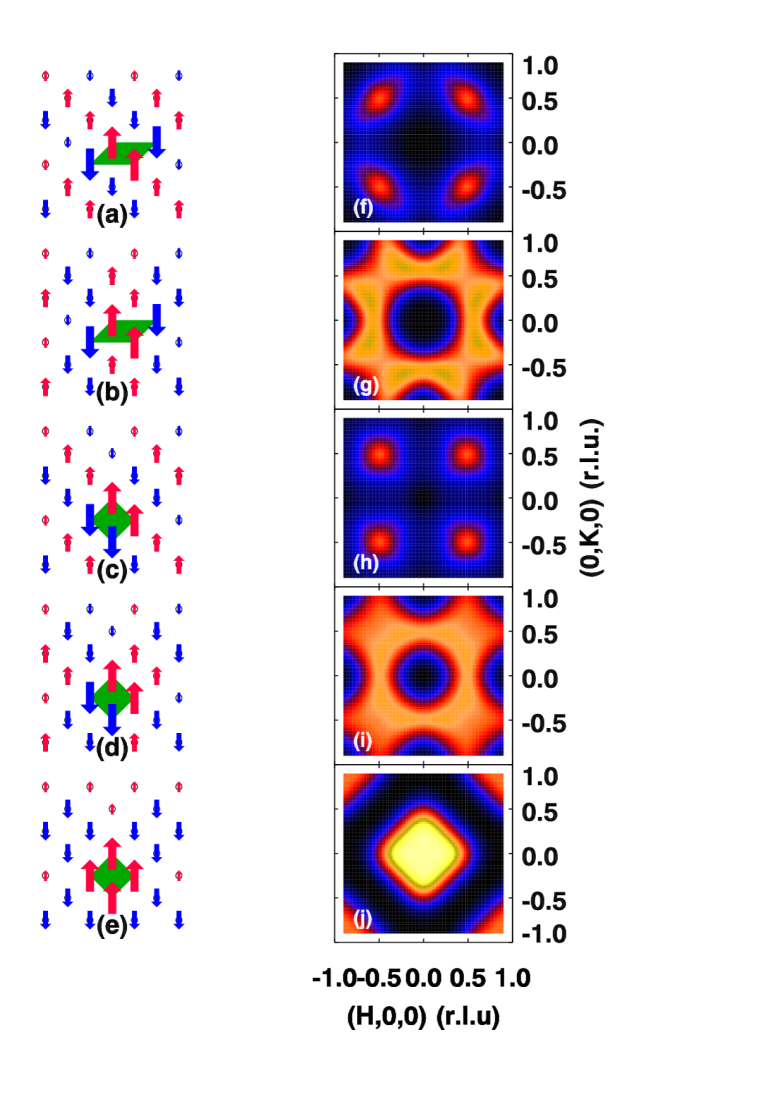
Looking back at the 7-meV results for the SC70 sample in Fig. 3, we find that the data are quite similar to the calculations for the UDUD plaquette, but with the modulation wave vector changing with temperature, from in the superconducting state to at room temperature. At 100 K, a 50-50 mix of these models seems to apply. The corresponding simulations are plotted in Fig. 3(j)–(l), for comparison with the data in (g)–(i). The effective correlation length was chosen to be in these cases, suggesting a highly disordered nature of the spin configuration that is consistent with a liquid phase. For the NSC45 sample, as already mentioned, there appears to be no change in characteristic wave vector, . Our data thus provide a direct probe of the spin-correlation wave-vector, in addition to the type of the local order. In particular, we note that models with square plaquettes, such as Fig. 5(c) to (e), fail to reproduce important details of the data.
An alternative approach for analyzing the changing magnetic correlations is to simply compare the magnetic weight at the characteristic wave vectors and . The raw and background (BG) subtracted intensities for these regions at meV are plotted in Fig. 6 (a) and (b). Here, the magnetic scattering intensity (BG subtracted) at positions decreases with warming while that at increases. For comparison, the solid line in Fig. 6 (b) shows the detailed-balance factor , which would characterize the thermal evolution of collective excitations whose dynamical susceptibility does not depend on temperature for the range of temperature studied, as one might expect in the case of a magnetically-ordered state. The signal at clearly grows even faster than predicted by the detailed balance factor, which means that the dynamical magnetic susceptibility increases. The ratio of the signal at to that at is plotted in Fig. 1, where one can see that it evolves much like the nematicity from electroresistance measurements Kuo et al. (2015) and the inverse scattering rate of mobile charge carriers Homes et al. (2015).
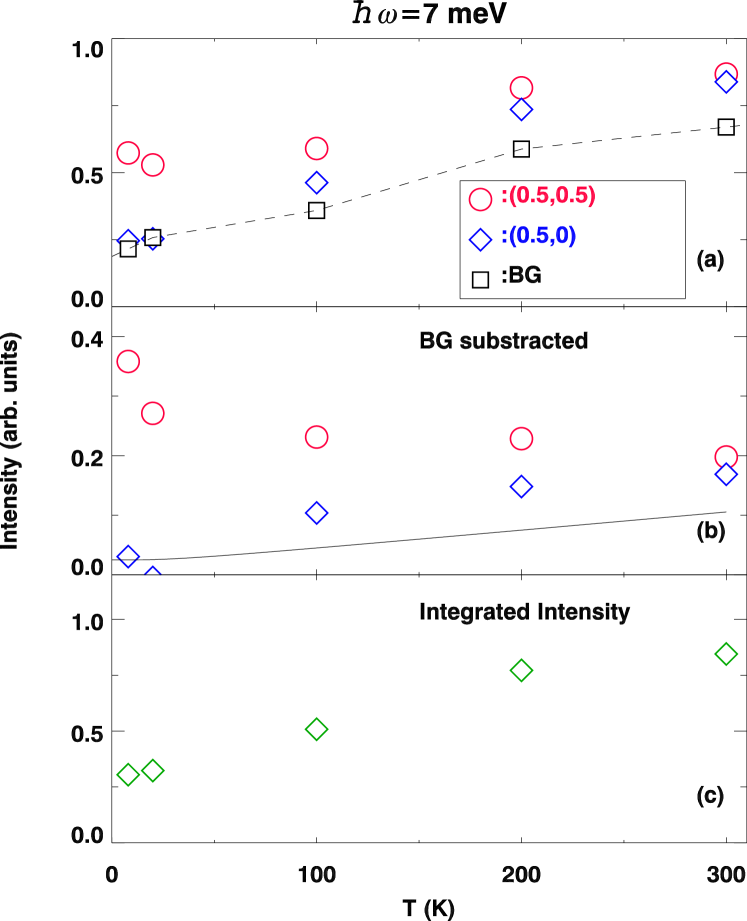
We also plot the background-corrected intensity integrated over the entire Brillouin zone for meV in Fig. 6 (c). Due to kinematics, there is a region around that we cannot measure, so that we might miss some signal as the scattering spreads out with increasing temperature. Nevertheless, from 10 K to 300 K, the -integrated low-energy spectral weight has increased by at least a factor of two. At higher energy transfers, the -range of our measurements becomes more limited and such integration over the entire Brillouin zone becomes unrealistic. Qualitatively, however, it is evident [see Fig. 3] that the increase of spectral weight with temperature also becomes much less pronounced at higher energy transfers.
III.2 Temperature dependence of lattice tetragonality
The observed thermal evolution of the magnetic correlations is inconsistent with a model in which orbital hybridization and magnetic exchange couplings are independent of temperature. Given the changes, one might expect to see some sort of response in the lattice. As already mentioned, symmetry-lowering structural transitions are common to Fe1+yTe and FeSe. For mixed compositions, the situation is complicated by the very different Fe-Te and Fe-Se bond lengths. Scattering studies indicate that these bond lengths vary rather little Louca et al. (2010); Tegel et al. (2010); as a consequence, scanning transmission electron microscopy Hu et al. (2011) and scanning tunneling microscopy He et al. (2011) studies provide evidence of segregation into Te-rich and Se-rich regions. Such disorder may frustrate long-range ordering of distortions away from tetragonal symmetry; nevertheless, other behavior may survive. Indeed, in our initial report of anomalous temperature-dependent changes of the magnetic correlations in FeTe0.5Se0.5 doped with Ni, we found an upturn in the lattice parameter at low temperature Xu et al. (2012). Similar lattice behavior was reported earlier for FeTe1-xSex with and 0.2 by Martinelli et al. Martinelli et al. (2010). As a result, we decided to take a more systematic look at the system with neutron powder diffraction measurements.
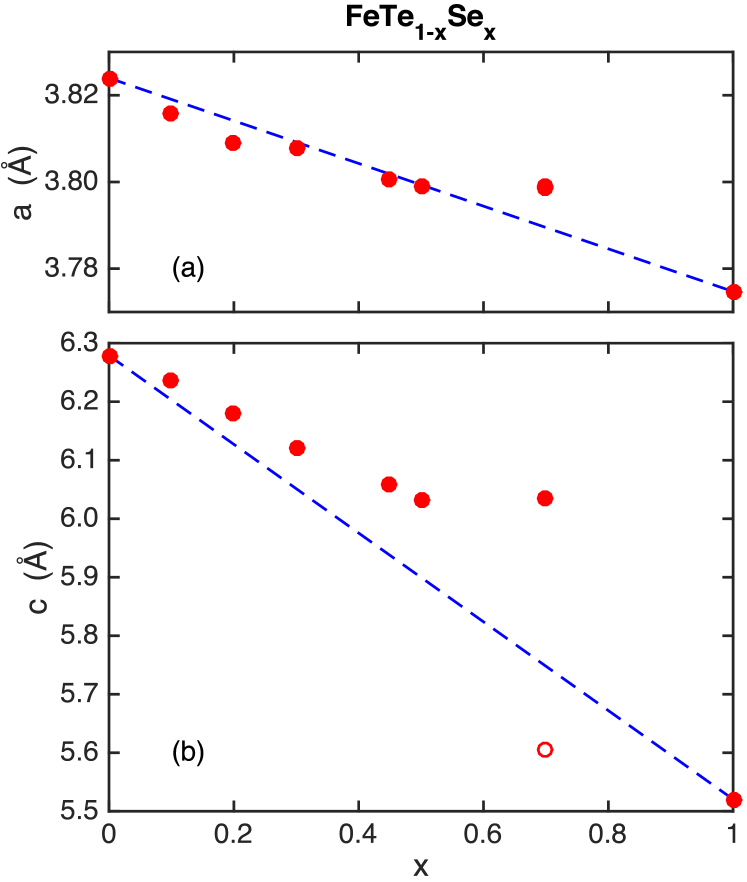
Figure 7 shows the room temperature values of the and lattice parameters as a function of ; here all samples have the tetragonal structure, with space group . Note that the lattice parameter changes by 0.78 Å (13%) across this series, while changes by only 0.046 Å (1.3%). This reflects the very different heights of the Te and Se ions relative to the Fe layer. The sample is on the lower edge of the miscibility gap found by Fang et al. Fang et al. (2008b). We found evidence for two tetragonal phases, with the lattice parameters of the less dominant phase (% by volume) indicated by open circles ( values are virtually identical). Note that the second phase, with reduced , is expected to be similar to FeSe, which is superconducting and lacks magnetic order. The spin dynamics should be similar to that of the Te-doped superconducting phase, and no distinctive features were detected in the single-crystal inelastic measurements.
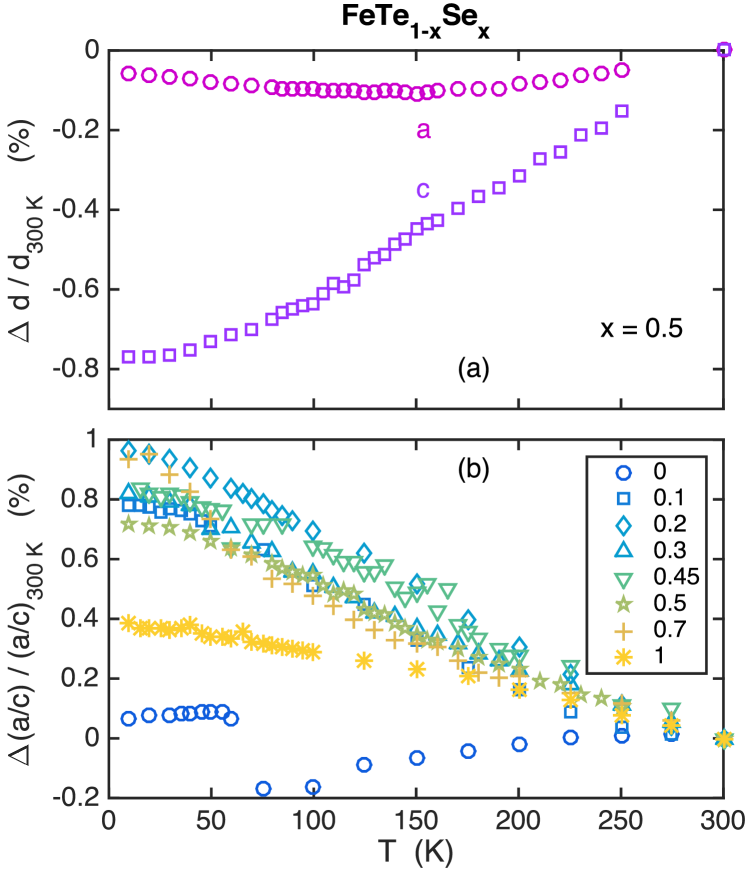
A representative example of the temperature dependence of the and lattice parameters for is plotted in Fig. 8(a). As one can see, there is a distinct upturn in below K, while the lattice parameter, if anything, appears to decrease a bit more rapidly in the same temperature range. We observe very similar behavior for all samples in the range . To characterize this behavior, we have plotted the relative change in the ratio in Fig. 8(b). To be specific, if , then we plot . In the case of , we use the average in-plane lattice parameter in the low temperature phase; note that we did not resolve an orthorhombic phase in our sample.
To interpret this behavior, we note that the tetrahedral bond angle can be expressed as , where is the relative coordinate of the chalcogenide ions. Given the evidence for phase segregation in FeTe1-xSex Hu et al. (2011); He et al. (2011), it should be reasonable to think about local Te-Fe-Te and Se-Fe-Se bond angles. Regardless of the local , the bond angle will move towards the ideal tetrahedral angle as increases. The temperature dependence of shown in Fig. 8(b) indicates that bond angle increases toward the ideal on cooling, which implies a reduction of the crystal-field splitting Yin et al. (2011), and a change in hybridization. The relative change of the bond angle in each sample on cooling is relatively small; however, we believe it reflects a substantially larger change in orbital content and occupancy of the electronic band structure. We note that a recent ARPES study of FeTe1-xSex with has found a significant growth on cooling for spectral weight of the band near the Fermi level Yi et al. (2015).
IV Summary and Discussion
By mapping the magnetic scattering over the entire plane of reciprocal space, we have shown that the characteristic wave vector of the low-energy spin correlations shifts from to on cooling in superconducting FeTe1-xSex. The ratio of the magnetic signal at the latter point to the former grows at low temperature much like the nematic response of elastoresistance measurements Kuo et al. (2015) and the inverse scattering rate of the mobile carriers Homes et al. (2015), as shown in Fig. 1. In a sample rendered non-superconducting by inclusion of excess Fe, the magnetic wave vector is and shows no thermal shift. In all samples studied, local correlations are consistent with antiferromagnetic UDUD plaquettes having C2 local symmetry indicative of nematicity, in agreement with the study of Ref. Zaliznyak et al. (2015), where such correlations were found to develop with doping towards superconductivity. We thus conclude that the change in the wave vector which describes propagation of magnetic correlations from to is a further necessary condition for superconductivity in 11 iron chalcogenides.
In our superconducting samples, the modeling of Q dependence of the low-energy magnetic scattering suggests local rotational symmetry breaking at all temperatures. However, it is the temperature-dependent change in characteristic magnetic wave vector that seems to qualitatively correlate with the growth in the nematic response of the elastoresistance measurements Kuo et al. (2015), as indicated in Fig. 1. The variation in antiferromagnetic wave vector implies a relative change among the exchange couplings over various Fe-Fe neighbor distances. A likely cause of this change is a temperature dependent variation of the orbital overlaps, the corresponding hybridization, as well as the variation in the occupancies of Fe levels. The ARPES evidence for local splitting of and bands Johnson et al. (2015), together with the temperature-dependent nematic response Kuo et al. (2015), supports this sort of variation. Our evidence for the thermal variation of the tetrahedral bond angle indicates a modification of the splitting, and hence the orbital content and the occupancy of the and based bands that cross the Fermi level. Regarding the question of what drives the nematic response, we can conclude that it is not an approach to magnetic order; local orbital order is a more likely suspect. Nevertheless, it is clear that the magnetic, orbital, and lattice degrees of freedom are strongly entangled.
We have also observed a reduction of low-energy magnetic spectral weight on cooling. This is consistent with nuclear magnetic resonance results for an sample in which the quantity , where is the spin-lattice relaxation rate measured at the Te site, decreases as the temperature is reduced Shimizu et al. (2009). This loss of magnetic susceptibility is correlated with a growth in electronic conductivity Homes et al. (2015); Sun et al. (2015) and a crossover from incoherence to coherence. This correlation parallels the more extreme changes observed in Fe1+yTe Zaliznyak et al. (2011); Fobes et al. (2014). Theoretically, a competition between antiferromagnetic correlations and conductivity is expected Haule and Kotliar (2009); Tam et al. (2015). The same electrons must contribute to the magnetic moments, influenced by Coulomb and Hund’s interactions, and to electronic conductivity, minimizing kinetic energy. This balance adjusts on cooling, with changing hybridization, and this competition likely plays an important role in determining the superconducting state.
Altogether, there is evidence for temperature-correlated changes in characteristic magnetic wave vector, nematicity, electronic coherence, magnetic spectral weight, and tetrahedral bond angle. It would be surprising if there is not an underlying connection why all of these happen together, and the temperature-dependent orbital hybridization and the orbital-selective electronic coherence provide a plausible connection. These relationships certainly deserve further study.
V Acknowledgment
We are grateful for stimulating discussions with Wei Ku, Ian Fisher, Adriana Moreo, Elbio Dagotto, and Ming Yi. The work at Brookhaven National Laboratory was supported by the Office of Basic Energy Sciences, U.S. Department of Energy, under Contract No. DE-SC00112704. Z.J.X. and R.J.B. are also supported by the Office of Basic Energy Sciences, U.S. Department of Energy through Contract No. DE-AC02-05CH11231. Research at Oak Ridge National Laboratory was sponsored by the Division of Scientific User Facilities of the same Office. The work at Nanjing University was supported by NSFC No.11374143, and NCET-13-0282.
References
- Mazin (2008) I. I. Mazin, Phys. Rev. Lett. 101, 057003 (2008).
- Kuroki et al. (2008) K. Kuroki, S. Onari, R. Arita, H. Usui, Y. Tanaka, H. Kontani, and H. Aoki, Phys. Rev. Lett. 101, 087004 (2008).
- Kontani and Onari (2010) H. Kontani and S. Onari, Phys. Rev. Lett. 104, 157001 (2010).
- Fernandes et al. (2014) R. M. Fernandes, A. V. Chubukov, and J. Schmalian, Nat. Phys. 10, 97 (2014).
- Fang et al. (2008a) C. Fang, H. Yao, W. F. Tsai, J. P. Hu, and S. A. Kivelson, Phys. Rev. B 77, 224509 (2008a).
- Xu et al. (2008) C. Xu, M. Müller, and S. Sachdev, Phys. Rev. B 78, 020501 (2008).
- Mazin and Johannes (2009) I. I. Mazin and M. D. Johannes, Nat. Phys. 5, 141 (2009).
- Lv et al. (2009) W. Lv, J. Wu, and P. Phillips, Phys. Rev. B 80, 224506 (2009).
- Krüger et al. (2009) F. Krüger, S. Kumar, J. Zaanen, and J. van den Brink, Phys. Rev. B 79, 054504 (2009).
- Chu et al. (2010) J.-H. Chu, J. G. Analytis, K. De Greve, P. L. McMahon, Z. Islam, Y. Yamamoto, and I. R. Fisher, Science 329, 824 (2010).
- Yi et al. (2011) M. Yi, D. Lu, J.-H. Chu, J. G. Analytis, A. P. Sorini, A. F. Kemper, B. Moritz, S.-K. Mo, R. G. Moore, M. Hashimoto, W.-S. Lee, Z. Hussain, T. P. Devereaux, I. R. Fisher, and Z.-X. Shen, Proc. Natl. Acad. Sci. USA 108, 6878 (2011).
- Chu et al. (2012) J.-H. Chu, H.-H. Kuo, J. G. Analytis, and I. R. Fisher, Science 337, 710 (2012).
- Kuo et al. (2013) H.-H. Kuo, M. C. Shapiro, S. C. Riggs, and I. R. Fisher, Phys. Rev. B 88, 085113 (2013).
- Shapiro et al. (2015) M. C. Shapiro, P. Hlobil, A. T. Hristov, A. V. Maharaj, and I. R. Fisher, “Symmetry constraints on the elastoresistivity tensor,” arXiv:1509.05462 (2015).
- Lu et al. (2014) X. Lu, J. T. Park, R. Zhang, H. Luo, A. H. Nevidomskyy, Q. Si, and P. Dai, Science 345, 657 (2014).
- Huang et al. (2008) Q. Huang, Y. Qiu, W. Bao, M. A. Green, J. W. Lynn, Y. C. Gasparovic, T. Wu, G. Wu, and X. H. Chen, Phys. Rev. Lett. 101, 257003 (2008).
- Chu et al. (2009) J.-H. Chu, J. G. Analytis, C. Kucharczyk, and I. R. Fisher, Phys. Rev. B 79, 014506 (2009).
- Pratt et al. (2009) D. K. Pratt, W. Tian, A. Kreyssig, J. L. Zarestky, S. Nandi, N. Ni, S. L. Bud’ko, P. C. Canfield, A. I. Goldman, and R. J. McQueeney, Phys. Rev. Lett. 103, 087001 (2009).
- Note (1) Here we have used the notation commonly used by theorists, which assumes a single Fe per unit cell and units of . When discussing experimental data, we will refer to a unit cell containing two Fe atoms, in units of .
- Baek et al. (2015) S.-H. Baek, D. V. Efremov, J. M. Ok, J. S. Kim, J. van den Brink, and B. Büchner, Nat. Mater. 14, 210 (2015).
- Böhmer et al. (2015) A. E. Böhmer, T. Arai, F. Hardy, T. Hattori, T. Iye, T. Wolf, H. v. Löhneysen, K. Ishida, and C. Meingast, Phys. Rev. Lett. 114, 027001 (2015).
- Imai et al. (2009) T. Imai, K. Ahilan, F. L. Ning, T. M. McQueen, and R. J. Cava, Phys. Rev. Lett. 102, 177005 (2009).
- Shimojima et al. (2014) T. Shimojima, Y. Suzuki, T. Sonobe, A. Nakamura, M. Sakano, J. Omachi, K. Yoshioka, M. Kuwata-Gonokami, K. Ono, H. Kumigashira, A. E. Bohmer, F. Hardy, T. Wolf, C. Meingast, H. V. Lohneysen, H. Ikeda, and K. Ishizaka, Physical Review B 90 (2014).
- Nakayama et al. (2014) K. Nakayama, Y. Miyata, G. N. Phan, T. Sato, Y. Tanabe, T. Urata, K. Tanigaki, and T. Takahashi, Phys. Rev. Lett. 113, 237001 (2014).
- Zhang et al. (2015) P. Zhang, T. Qian, P. Richard, X. P. Wang, H. Miao, B. Q. Lv, B. B. Fu, T. Wolf, C. Meingast, X. X. Wu, Z. Q. Wang, J. P. Hu, and H. Ding, Phys. Rev. B 91, 214503 (2015).
- Wang et al. (2015a) F. Wang, S. A. Kivelson, and D.-H. Lee, Nat. Phys. 11, 959 (2015a).
- Yu and Si (2015) R. Yu and Q. Si, Phys. Rev. Lett. 115, 116401 (2015).
- Glasbrenner et al. (2015) J. K. Glasbrenner, I. I. Mazin, H. O. Jeschke, P. J. Hirschfeld, R. M. Fernandes, and R. Valenti, Nat. Phys. 11, 953 (2015).
- Gretarsson et al. (2011) H. Gretarsson, A. Lupascu, J. Kim, D. Casa, T. Gog, W. Wu, S. R. Julian, Z. J. Xu, J. S. Wen, G. D. Gu, R. H. Yuan, Z. G. Chen, N.-L. Wang, S. Khim, K. H. Kim, M. Ishikado, I. Jarrige, S. Shamoto, J.-H. Chu, I. R. Fisher, and Y.-J. Kim, Phys. Rev. B 84, 100509 (2011).
- Mannella (2014) N. Mannella, Journal of Physics: Condensed Matter 26, 473202 (2014).
- Dai (2015) P. Dai, Rev. Mod. Phys. 87, 855 (2015).
- Tranquada et al. (2014) J. M. Tranquada, G. Xu, and I. A. Zaliznyak, J. Magn. Magn. Mater. 350, 148 (2014).
- Rahn et al. (2015) M. C. Rahn, R. A. Ewings, S. J. Sedlmaier, S. J. Clarke, and A. T. Boothroyd, Phys. Rev. B 91, 180501 (2015).
- Wang et al. (2015b) Q. Wang, Y. Shen, B. Pan, Y. Hao, M. Ma, F. Zhou, P. Steffens, K. Schmalzl, T. R. Forrest, M. Abdel-Hafiez, X. Chen, D. A. Chareev, A. N. Vasiliev, P. Bourges, Y. Sidis, H. Cao, and J. Zhao, Nat Mater advance online publication, (2015b), http://dx.doi.org/10.1038/nmat4492 .
- Yin et al. (2011) Z. P. Yin, K. Haule, and G. Kotliar, Nat. Mater. 10, 932 (2011).
- Lee et al. (2009) C.-C. Lee, W.-G. Yin, and W. Ku, Phys. Rev. Lett. 103, 267001 (2009).
- Dai et al. (2012) P. Dai, J. Hu, and E. Dagotto, Nat. Phys. 8, 709 (2012).
- Bascones et al. (2010) E. Bascones, M. J. Calderón, and B. Valenzuela, Phys. Rev. Lett. 104, 227201 (2010).
- Kuo et al. (2015) H.-H. Kuo, J.-H. Chu, S. A. Kivelson, and I. R. Fisher, “Ubiquitous signatures of nematic quantum criticality in optimally doped Fe-based superconductors,” http://arxiv.org/abs/1503.00402 (2015).
- Zaliznyak et al. (2015) I. Zaliznyak, A. T. Savici, M. Lumsden, A. Tsvelik, R. Hu, and C. Petrovic, Proc. Natl. Acad. Sci. USA 112, 10316 (2015).
- Johnson et al. (2015) P. D. Johnson, H.-B. Yang, J. D. Rameau, G. D. Gu, Z.-H. Pan, T. Valla, M. Weinert, and A. V. Fedorov, Phys. Rev. Lett. 114, 167001 (2015).
- Homes et al. (2015) C. C. Homes, Y. M. Dai, J. S. Wen, Z. J. Xu, and G. D. Gu, Phys. Rev. B 91, 144503 (2015).
- McQueen et al. (2009) T. M. McQueen, A. J. Williams, P. W. Stephens, J. Tao, Y. Zhu, V. Ksenofontov, F. Casper, C. Felser, and R. J. Cava, Phys. Rev. Lett. 103, 057002 (2009).
- Louca et al. (2010) D. Louca, K. Horigane, A. Llobet, R. Arita, S. Ji, N. Katayama, S. Konbu, K. Nakamura, T.-Y. Koo, P. Tong, and K. Yamada, Phys. Rev. B 81, 134524 (2010).
- Moon and Choi (2010) C.-Y. Moon and H. J. Choi, Phys. Rev. Lett. 104, 057003 (2010).
- Mazin (2010) I. I. Mazin, Nature 464, 183 (2010).
- Bao et al. (2009) W. Bao, Y. Qiu, Q. Huang, M. A. Green, P. Zajdel, M. R. Fitzsimmons, M. Zhernenkov, S. Chang, M. Fang, B. Qian, E. K. Vehstedt, J. Yang, H. M. Pham, L. Spinu, and Z. Q. Mao, Phys. Rev. Lett. 102, 247001 (2009).
- Li et al. (2009) S. Li, C. de la Cruz, Q. Huang, Y. Chen, J. W. Lynn, J. Hu, Y.-L. Huang, F.-C. Hsu, K.-W. Yeh, M.-K. Wu, and P. Dai, Phys. Rev. B 79, 054503 (2009).
- Wen et al. (2009) J. Wen, G. Xu, Z. Xu, Z. W. Lin, Q. Li, W. Ratcliff, G. Gu, and J. M. Tranquada, Phys. Rev. B 80, 104506 (2009).
- Qiu et al. (2009) Y. Qiu, W. Bao, Y. Zhao, C. Broholm, V. Stanev, Z. Tesanovic, Y. C. Gasparovic, S. Chang, J. Hu, B. Qian, M. Fang, and Z. Mao, Phys. Rev. Lett. 103, 067008 (2009).
- Lee et al. (2010) S. H. Lee, G. Xu, W. Ku, J. S. Wen, C. C. Lee, N. Katayama, Z. J. Xu, S. Ji, Z. W. Lin, G. D. Gu, H. B. Yang, P. D. Johnson, Z. H. Pan, T. Valla, M. Fujita, T. J. Sato, S. Chang, K. Yamada, and J. M. Tranquada, Phys. Rev. B 81, 220502 (2010).
- Lumsden et al. (2010) M. D. Lumsden, A. D. Christianson, E. A. Goremychkin, S. E. Nagler, H. A. Mook, M. B. Stone, D. L. Abernathy, T. Guidi, G. J. MacDougall, C. de la Cruz, A. S. Sefat, M. A. McGuire, B. C. Sales, and D. Mandrus, Nat. Phys. 6, 182 (2010).
- Liu et al. (2010) T. J. Liu, J. Hu, B. Qian, D. Fobes, Z. Q. Mao, W. Bao, M. Reehuis, S. A. J. Kimber, K. ProkeÊãß, S. Matas, D. N. Argyriou, A. Hiess, A. Rotaru, H. Pham, L. Spinu, Y. Qiu, V. Thampy, A. T. Savici, J. A. Rodriguez, and C. Broholm, Nat. Mater. 9, 718 (2010).
- Xu et al. (2012) Z. Xu, J. Wen, Y. Zhao, M. Matsuda, W. Ku, X. Liu, G. Gu, D.-H. Lee, R. J. Birgeneau, J. M. Tranquada, and G. Xu, Phys. Rev. Lett. 109, 227002 (2012).
- Xu et al. (2014) Z. Xu, J. Wen, J. Schneeloch, A. D. Christianson, R. J. Birgeneau, G. Gu, J. M. Tranquada, and G. Xu, Phys. Rev. B 89, 174517 (2014).
- Tsyrulin et al. (2012) N. Tsyrulin, R. Viennois, E. Giannini, M. Boehm, M. Jimenez-Ruiz, A. A. Omrani, B. D. Piazza, and H. M. Rønnow, New Journal of Physics 14, 073025 (2012).
- Zaliznyak et al. (2011) I. A. Zaliznyak, Z. Xu, J. M. Tranquada, G. Gu, A. M. Tsvelik, and M. B. Stone, Phys. Rev. Lett. 107, 216403 (2011).
- Tam et al. (2015) Y.-T. Tam, D.-X. Yao, and W. Ku, Phys. Rev. Lett. 115, 117001 (2015).
- Wen et al. (2011) J. Wen, G. Xu, G. Gu, J. M. Tranquada, and R. J. Birgeneau, Rep. Prog. Phys. 74, 124503 (2011).
- Wen et al. (2010) J. Wen, G. Xu, Z. Xu, Z. W. Lin, Q. Li, Y. Chen, S. Chi, G. Gu, and J. M. Tranquada, Phys. Rev. B 81, 100513(R) (2010).
- Xu et al. (2010) Z. Xu, J. Wen, G. Xu, Q. Jie, Z. Lin, Q. Li, S. Chi, D. K. Singh, G. Gu, and J. M. Tranquada, Phys. Rev. B 82, 104525 (2010).
- Xu et al. (2011) Z. J. Xu, J. S. Wen, G. Y. Xu, S. X. Chi, W. Ku, G. D. Gu, and J. M. Tranquada, Phys. Rev. B 84, 052506 (2011).
- Granroth et al. (2010) G. E. Granroth, A. I. Kolesnikov, T. E. Sherline, J. P. Clancy, K. A. Ross, J. P. C. Ruff, B. D. Gaulin, and S. E. Nagler, J. Phys. Conf. Ser. 251, 012058 (2010).
- Winn, Barry et al. (2015) Winn, Barry, Filges, Uwe, Garlea, V. Ovidiu, Graves-Brook, Melissa, Hagen, Mark, Jiang, Chenyang, Kenzelmann, Michel, Passell, Larry, Shapiro, Stephen M., Tong, Xin, and Zaliznyak, Igor, EPJ Web of Conferences 83, 03017 (2015).
- Neuefeind et al. (2012) J. Neuefeind, M. Feygenson, J. Carruth, R. Hoffmann, and K. K. Chipley, Nucl. Instrum. Methods Phys. Res., Sect. B 287, 68 (2012).
- Katayama et al. (2010) N. Katayama, S. Ji, D. Louca, S.-H. Lee, M. Fujita, T. J. Sato, J. S. Wen, Z. J. Xu, G. D. Gu, G. Xu, Z. W. Lin, M. Enoki, S. Chang, K. Yamada, and J. M. Tranquada, arXiv:1003.4525v1 (2010).
- Le Bail (2005) A. Le Bail, Powder Diffraction 20, 316 (2005).
- Larson and Von Dreele (2000) A. C. Larson and R. B. Von Dreele, General Structure Analysis System (GSAS), Report LAUR 86-748 (Los Alamos National Laboratory, 2000).
- Toby (2001) B. H. Toby, J. Appl. Cryst. 34, 210 (2001).
- Argyriou et al. (2010) D. N. Argyriou, A. Hiess, A. Akbari, I. Eremin, M. M. Korshunov, J. Hu, B. Qian, Z. Mao, Y. Qiu, C. Broholm, and W. Bao, Phys. Rev. B 81, 220503 (2010).
- Li et al. (2010) S. Li, C. Zhang, M. Wang, H.-q. Luo, X. Lu, E. Faulhaber, A. Schneidewind, P. Link, J. Hu, T. Xiang, and P. Dai, Phys. Rev. Lett. 105, 157002 (2010).
- Note (2) Zhijun Xu, Jinsheng Wen, and Guangyong Xu (unpublished).
- Yin et al. (2010) W.-G. Yin, C.-C. Lee, and W. Ku, Phys. Rev. Lett. 105, 107004 (2010).
- Fang et al. (2009) C. Fang, B. A. Bernevig, and J. Hu, Euro. Phys. Lett. 86, 67005 (2009).
- Yin et al. (2012) W. G. Yin, C. H. Lin, and W. Ku, Physical Review B 86 (2012).
- Luo and Dagotto (2014) Q. Luo and E. Dagotto, Phys. Rev. B 89, 045115 (2014).
- Tegel et al. (2010) M. Tegel, C. Löhnert, and D. Johrendt, Solid State Commun. 150, 383 (2010).
- Hu et al. (2011) H. Hu, J.-M. Zuo, J. Wen, Z. Xu, Z. Lin, Q. Li, G. Gu, W. K. Park, and L. H. Greene, New J. Phys. 13, 053031 (2011).
- He et al. (2011) X. He, G. Li, J. Zhang, A. B. Karki, R. Jin, B. C. Sales, A. S. Sefat, M. A. McGuire, D. Mandrus, and E. W. Plummer, Phys. Rev. B 83, 220502 (2011).
- Martinelli et al. (2010) A. Martinelli, A. Palenzona, M. Tropeano, C. Ferdeghini, M. Putti, M. R. Cimberle, T. D. Nguyen, M. Affronte, and Ritter, Physical Review B 81, 094115 (2010).
- Fang et al. (2008b) M. H. Fang, H. M. Pham, B. Qian, T. J. Liu, E. K. Vehstedt, Y. Liu, L. Spinu, and Z. Q. Mao, Phys. Rev. B 78, 224503 (2008b).
- Yi et al. (2015) M. Yi, Z.-K. Liu, Y. Zhang, R. Yu, J. X. Zhu, J. J. Lee, R. G. Moore, F. T. Schmitt, W. Li, S. C. Riggs, J. H. Chu, B. Lv, J. Hu, M. Hashimoto, S. K. Mo, Z. Hussain, Z. Q. Mao, C. W. Chu, I. R. Fisher, Q. Si, Z. X. Shen, and D. H. Lu, Nat. Commun. 6 (2015).
- Shimizu et al. (2009) Y. Shimizu, T. Yamada, T. Takami, S. Niitaka, H. Takagi, and M. Itoh, Journal of the Physical Society of Japan 78, 123709 (2009).
- Sun et al. (2015) Y. Sun, T. Taen, T. Yamada, Y. Tsuchiya, S. Pyon, and T. Tamegai, Supercond. Sci. Technol. 28, 044002 (2015).
- Fobes et al. (2014) D. Fobes, I. A. Zaliznyak, Z. J. Xu, R. D. Zhong, G. D. Gu, J. M. Tranquada, L. Harriger, D. Singh, V. O. Garlea, M. Lumsden, and B. Winn, Phys. Rev. Lett. 112 (2014).
- Haule and Kotliar (2009) K. Haule and G. Kotliar, New J. Phys. 11, 025021 (2009).