Inelastic electron-phonon scattering and excess current in superconducting point contacts with a short coherence length
Abstract
Nonlinear electrical effects in superconducting contacts, including the spectroscopy of electron-phonon interactions (EPI) in these systems, and the recovery of the EPI function from experimental data are discussed. The effect of a magnetic field on the current-voltage characteristics (I-V curves) and their derivatives for point contacts (PC) with (where is the diameter of the PC and is the coherence length) is studied. It is found that in zero magnetic fields and in near-critical fields, when the size of the superconducting gap can be neglected, the position of the peaks in coincides with the peaks in the Yanson EPI spectra. In low fields the peaks are shifted toward lower energies and in intermediate fields, the peaks split. For PC with diameters greater than or on the order of the coherence length, the relative size of the negative phonon contribution to the excess current is considerably greater than in ballistic contacts. This leads to substantial suppression of the high-frequency peaks in the spectra for the superconducting state. In order to recover the EPI function from these spectra it is necessary to correct their intensities at high energies. For dirty and point-contacts with , which have no phonon features in the second derivative of the I-V curve in the normal state, the EPI can be reconstructed from the superconducting state.
pacs:
71.38.-k, 73.40.Jn, 74.25.Kc, 74.45.+c, 74.50.+r.I INTRODUCTION
I.1 Basic theoretical concepts
In ballistic point contacts, an electron passing through the short joining the metallic electrodes acquires an energy from the applied voltage. At any point in its trajectory it can lose excess energy and emit a nonequilibrium phonon. If this occurs in the immediate vicinity of the short, then there is a fairly high probability that the electron will return to the electrode from which it emerged. In this case, the resistance of the pointcontact (PC) is supplemented by an additional nonlinear contribution. Although only a small fraction of the electrons are scattered on nonequilibrium phonons in the neighborhood of the short and only some of these scattered electrons turn back, the deviation from Ohm’s law owing to the high current density () in the constriction can be very substantial and can approach ten percent. The main task of Yanson PC spectroscopy is the study of this nonlinearity, since the second derivative of the I-V curve of a PC in the normal state is proportional to the electron-phonon interaction (EPI) function Kulik :
| (1) |
The distance over which most of these electrons lose excess energy is referred to as the energy relaxation length and depends strongly on the applied voltage. The minimum energy relaxation length is attained when the energy of an electron is comparable to or exceeds the maximum possible energy of a phonon at the edge of the spectrum. If one or both of the electrodes forming a point-contact is superconducting, then an additional transport channel owing to the presence of excess current shows up in the PC conductivity through the constriction. When the voltage on the contact is considerably higher than the superconducting gap, and when all the nonlinearities in the curve are taken into account, the current can be written in the form Khlus
| (2) |
Here is the nonlinearity owing to the EPI in a normal PC and is the basis of Yanson spectroscopy (see Eq. (1)). When , the excess current for a ballistic PC is independent of the bias and is given by Zaitsev :
| (3) |
and, finally, is the negative contribution to the excess current owing to collisions of nonequilibrium phonons with Andreev electrons (i.e., quasi-electrons, during the process of electron-hole conversion). Because of these collisions, the number of Andreev electrons is reduced, and this leads to a drop in the excess current. For the excess current of an contact we have Khlus
| (4) |
Here is the velocity of the electrons averaged over the Fermi surface. On comparing this with Eq. (1), it is clear that here the EPI function is proportional to the first derivative. The relative magnitude of the negative phonon contribution to the excess current for ballistic contacts near the Debye energies is on the order of Khlus
| (5) |
i.e., it is small compared to the bias-independent excess current.
The relative smallness of this contribution is caused by the ballistic character of the PC, since the probability of inelastic scattering of nonequilibrium phonons on Andreev electrons depends on their mutual concentration. The maximum concentration coincides with the region of maximum current density and falls off rapidly with distances from the constriction. Thus, in ballistic contacts the volume for generation of the phonons that form the PC spectrum in the normal state is close to the volume within which the spectrum owing to the suppression of the excess current is formed. Because of this, the EPI functions recovered from the characteristics of these contacts in the normal state are extremely close to the EPI functions obtained from the excess current (see Figs. 2, 5 and 6 in Ref. Bobrov1 ). There the inelastic superconducting contribution to the spectrum in the region of the phonon energies for point-contacts shows up in the form of differential resistance peaks in the first derivative of the excess current, shifted toward lower energies by an amount on the order of the gap, while for contacts there is no shift, i.e., these differences are minimal at low temperatures. On the other hand, if the condition that the diameter of the PC be small compared to the coherence length and to the energy relaxation length of the electrons at the Debye energies is not satisfied rigorously enough, then the volume within which the spectrum in the superconducting state is formed may increase because part of the region near the contact is drawn in owing to an increase in the concentration of Andreev electrons and nonequilibrium phonons there. In this case, the spectra obtained in the normal state and recovered from the excess current may differ. This is the case of greatest practical interest. When PC are produced by mechanical methods, the largest distortions of the crystal lattice are concentrated in the surface layer at the point of contact of the electrodes. In addition, the surface itself is generally of inferior quality compared to the volume. Thus, it is extremely difficult to obtain a ballistic point-contact. Sometimes the spectrum in the normal state does not have any phonon features because of amorphization of the material in the contact region. If the distortions affect the volume only in the center of the contact and do not extend into the depth of the material being studied, it may be possible to recover the EPI successfully from the negative contribution to the excess current Bobrov2 . In this case, it is obvious that the volumes responsible for formation of the spectra in the normal and superconducting states do not coincide in space. The phonon structure in the superconducting state is produced by a larger region near the contact with a more perfect crystal lattice. For many superconductors, distortions in the lattice cause reductions in several of the superconducting parameters or even complete suppression of superconductivity. Then it becomes possible to obtain EPI spectra from the most perfect superconducting regions in the cantilever near the short.
If the condition that the contact diameter should be small compared to the coherence length is not strict, i.e., , then the EPI spectrum recovered from the excess current for a PC with an amorphous core will have a shape close to the spectrum for a ballistic contact in the normal state.
Condition (5) means that the number of Andreev electrons varies little up to the Debye energies; this ensures a proper form for the EPI spectrum recovered from the excess current. When the excess current is strongly suppressed by nonequilibrium phonons, the shape of the spectrum can be highly distorted. The phonon peaks at low biases will be emphasized, since the excess current is not strongly suppressed and the concentration of Andreev electrons is high. And so high-energy phonons can appear much weaker when the excess current is reduced substantially. This may require correction of the high-frequency part of the spectrum with the energy dependence of the excess current taken into account. This applies, first of all, to superconductors with a low electron energy relaxation length at the Debye energies, as well as with a short coherence length. In contacts between these superconductors, inelastic scattering of nonequilibrium phonons on Andreev electrons in the cantilevers near the short may become an important source of information on the EPI.
II Recovery of EPI functions
II.1 point-contacts
The influence of antiferromagnetic ordering on the superconducting gap in the nickel borocarbide superconductor has been examined in detail elsewhere Bobrov3 ; Bobrov4 and the experimental technique is described in detail there. In this section, we examine the effect of nonequilibrium phonons on the excess current. Measurements were made at . Figure 1
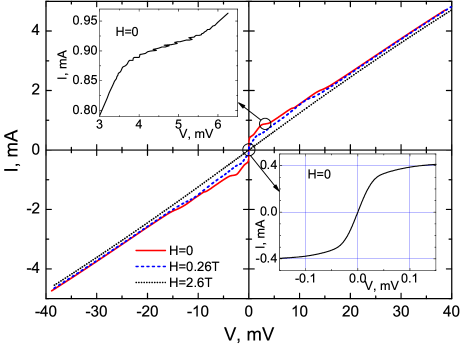
shows the I-V curves for an contact in different magnetic fields. The resistance of the PC is and the diameter estimated using the Veksler formula (see p. 9 of Ref. Naidyuk )
| (6) |
is =17 nm, where it is assumed that (Ref. Shulga ) and Cho . The elastic mean free path is then and the coherence length is Skanthakumar . Thus, the diameter of the contact is less than the coherence length. Since the contact is connected in a quasi-four contact circuit, the contact resistance in zero magnetic field is (see the inset to Fig. 1). The dependence of the resistance for zero bias is shown in Fig. 2
and indicates that the PC is stable in a magnetic field. For biases of 3.5-6 , the I-V curve is found to be unstable (see the inset to Fig. 1), but there is no hysteresis. Similar behavior has been observed in an PC Yanson1 . It is impossible to record the derivative in this interval; the recorder pen produces a chaotic trace. In order to match the derivative before and after the stability, we found a polynomial fit through this segment of the I-V curve and obtained the derivative by numerical integration. This instability appears to be related to the smallness of relative to the PC diameter. Before a certain density of the transport current is reached, the superconducting boundary moves from the constriction into the depth of the cantilevers Yanson1 . Note that for the critical magnetic field Bud ko , which is somewhat lower than the maximum field attained here, but, as will be shown below, residual traces of superconductivity still show up. Nevertheless, for finding the excess current, the I-V curve for a field of was used as the normal state.

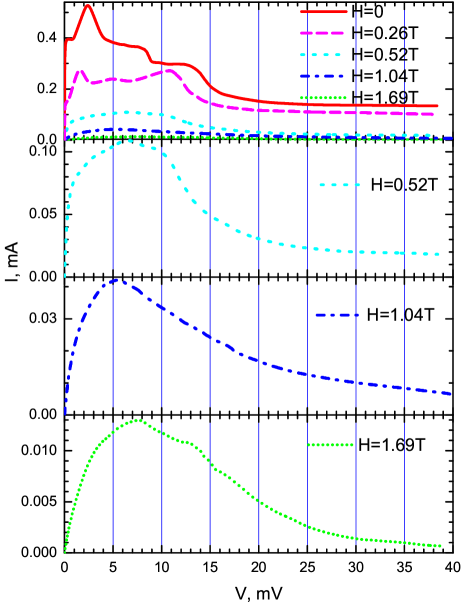
Figure 3 shows the excess current as a function of bias on a point-contact in different magnetic fields. Taking the average effective gap to be (Ref. Bobrov3 ) yields estimates for the clean limit of and for the dirty limit, . The experimental value according to the data of Fig. 3 is , i.e., it lies roughly midway between the clean and dirty limits. The critical current coincides precisely with the dirty limit. (In the clean limit .) Since depends strongly on the magnetic field, the lack of shielding of the point-contact causes this difference. Thus, the contact is in an intermediate electron drift regime.
Figure 2 shows that, even for energies below the Debye energies, the relative magnitude of the negative phonon contribution to the excess current is extremely large, i.e., condition (5) does not hold. This is related to the failure of the condition . Since the strong drop in the excess current even at the first two peaks in the density of phonon states leads to a significant reduction in the concentration of Andreev electrons, this is accompanied by a corresponding reduction in the intensity of the subsequent phonon modes in the spectra. Figure 4
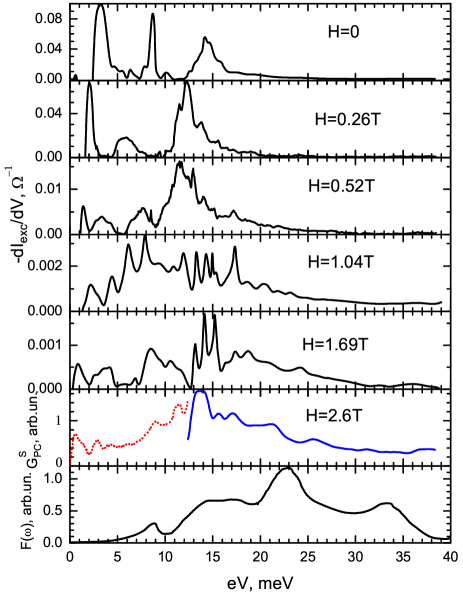
shows the first derivatives of the excess current in different magnetic fields, which are proportional to the EPI function (see Eq. (4)), as well as the density function of the phonon states. In zero magnetic field only two peaks near 9 and show up; no higher frequency peaks can be seen against the background of these. For high biases, the traces were taken with the same modulation, so it was not possible to recover the high-frequency part, as is done in the next section, which is devoted to .
Recall that for point-contacts the peaks in the first derivative of the excess current are shifted relative to the EPI function by an amount somewhat less than (see Figs. 1 and 2 of Ref. Bobrov1 ), while for contacts there is no shift (Figs. 5 and 6 of Ref. Bobrov1 ).
In a magnetic field, the type-II superconductor is penetrated by vortices, i.e., normal (the core of a vortex) and superconducting regions coexist in the neighborhood of the contact. This problem has not been examined theoretically, and experimental data are shown here for the first time. Figure 4 shows that in fields and there is a significant shift in the peaks toward lower energies; the shift is considerably larger than in the spectra of ballistic point-contacts in zero field.
Further increases in the field to and cause splitting of the peaks, which begin to gravitate toward the position characteristic of zero field. The nature of this behavior of the spectrum is not understood, but it does suggest that it would be extremely difficult to recover the EPI function for point-contacts in a magnetic field. We have observed the strong effect of a magnetic field on the EPI spectra of Ta ballistic point-contacts in the superconducting state before Yanson2 .
We now examine the spectrum in a field of , near the complete suppression of superconductivity, in more detail. The initial segment (the dotted line) up to about is the second derivative of the I-V curve without changes. The next part is recovered from the second derivative of the I-V curve after subtracting the background and integrating (Fig. 5).
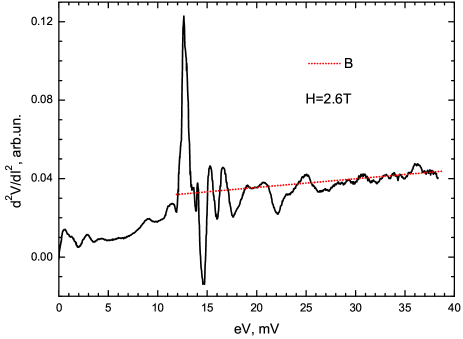
Since the probability of scattering of nonequilibrium phonons on Andreev electrons depends on their concentration, and the phonon concentration increases especially rapidly near the peaks, the critical concentration of these needed for the appearance of peaks in the derivative of the I-V curve is reached for biases starting at the second phonon peak.
II.2 Point-contacts based on
We have published data on EPI in previously Bobrov2 . Here we consider a point-contact with a large diameter in which the condition is not met. Although the contact has a rather high resistance in terms of point-contact spectroscopy , its diameter is large at , given the electronic parameters and . Here the coherence length is , or less than half the contact diameter. As a comparison, the diameter of the point-contact examined in Ref. Bobrov2 is . Although the PC is of an type, there is no critical current and the excess current is about , which is substantially below the ”dirty” limit.
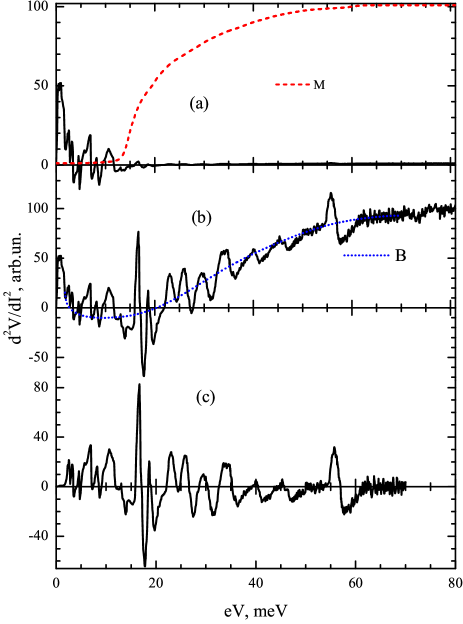
(a) Spectrum of an point-contact (see Fig. 5 of Ref. Bobrov5 ). and is the multiplicative scaling curve. The scaling curve was obtained from part of the plot of the excess current as a function of energy (Fig. 7). This part was turned by , shifted toward higher energies by 3 mV, and normalized so that and .
(b) The spectrum after multiplication by the scaling factor, is the background curve.
(c) The spectrum after subtraction of the background curve.
The spectrum shown in Fig. 6(a) is distinctly different from that of the high-resistance PC shown in Fig. 3 of Ref. Bobrov2 . Here the spectrum falls off very rapidly in intensity and by it degenerates into a line. At the same time, the spectrum of the high-resistance contact has an almost constant intensity up to the Debye energy . The damping of the intensity of the spectrum correlates clearly with the damping of the excess current in the PC (Fig. 7);

thus, the scaling curve , which is based on the excess current curve in the range, was used to correct this damping. The initial segment of was chosen to be close to a straight line. The excess current curve was turned by and shifted toward higher energies by . This curve was normalized so that and . Figure 6(b) shows the corrected spectrum after multiplication by the scaling curve , as well as the background curve . Finally, Fig. 6(c) is the spectrum after subtraction of the background curve.
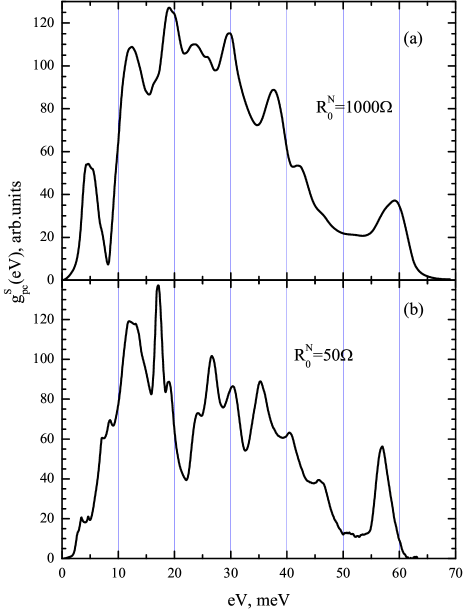
(a) The EPI function recovered from a superconducting spectrum of (see Fig. 3 of Ref. Bobrov2 );
(b) the EPI function recovered by integrating the curve of Fig. 6(c).
Figure 8 shows the EPI functions recovered from the high-resistance and low-resistance point-contacts. Thus, after correction their shapes are in good agreement, especially given the high lability of point-contact spectra Bobrov5 . Note that suppression of the excess current is not connected in any way with ohmic heating, as indicated by the absence of smearing of the EPI function at high frequencies compared to the high-resistance contact.
II.3 Point-contact based on Nb
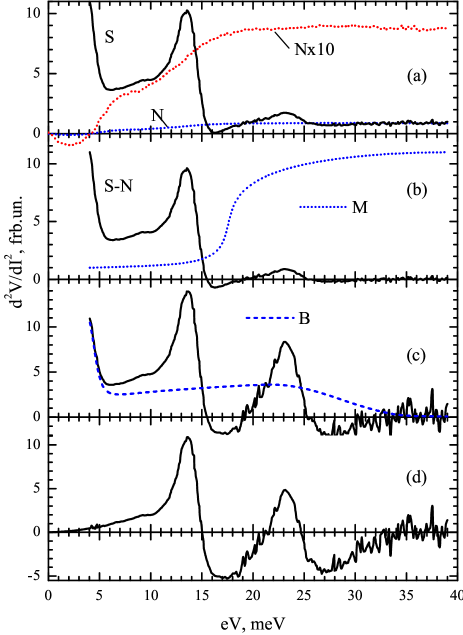
(a) Second derivatives of I-V curves for an Nb point-contact, , in the superconducting S and normal N states taken with the same modulated voltage ( is the scale multiplied by a factor of 10).
(b) The difference curve S-N; is the scaling curve analogous to the plot of Fig. 6(c).
(c) The spectrum after multiplication by the scaling curve; is the background curve.
(d) The spectrum after subtraction of the background curve.
Here we show spectra of a ”dirty” point-contact. The contact resistance . Figure 9(a) shows the second derivatives of the I-V curves in the normal and superconducting states. It can be seen that the second derivative in the normal state contains no peaks near the characteristic phonon energies; only some small bends show up. This behavior is typical of an amorphous material with disrupted long-range order. It can be assumed that in the region of the constriction the momentum mean free path is extremely short. Taking the ratio at the center of the contact and given that (Refs. Alekseevskii and French ) and Alekseevskii , for we obtain a momentum mean free path of , which is determined by impurities. Here the contact diameter is . The coherence length for niobium is Antonova , given that the momentum mean free path zeta, which serves as a coherence length, is . Therefore, since the contact is ”dirty,” we find that here the length is less than the contact diameter.

(a) The EPI function for an point-contact obtained by integrating the curve of Fig. 9(d);
(b) The EPI function for recovered from a tunnelling spectrum Arnold .
Given the general form of the second derivative, we may assume that suppression of the excess current is considerably weaker in this case than it was for in the previous section. Since the excess current curve, which can be used as a seed, is lacking in this case, the scaling curve is drawn in by hand. Figure 10 shows the EPI function recovered using the scaling curve compared with the EPI function recovered from tunnelling data Arnold .
II.4 Discussion of results
Experiments with, for example, tin (Figs. 2, 3, 4 of Ref. Bobrov1 ) show that in the ballistic regime the superconducting contribution to the spectrum is small compared to the spectrum in the normal state and is no more than 20%. As the elastic electron mean free path falls off, the intensity of the point-contact spectrum in the normal state decreases and becomes much lower in the diffusive limit than in the ballistic limit. At the same time, in the superconducting state, during the transition from the ballistic to the diffusive limit the excess current falls off by slightly less than a factor of two. Since the superconducting contribution to the spectrum is proportional to the magnitude of the excess current, we can expect that a reduction in the elastic scattering mean free path will be accompanied by a rise in the relative intensity of the superconducting contribution compared to the spectrum in the normal state. The above example of the characteristics of a dirty niobium contact (Fig. 8(a)) shows that the intensity of the spectrum for the superconducting state in the phonon frequency range is an order of magnitude higher than for the normal state. We note the fundamental difference in the shape of the spectrum in the normal state and the EPI function recovered from the superconducting contribution to the spectrum; this confirms the assertion in the Introduction regarding the spatial mismatch of the volumes responsible for the formation of the spectra in the normal and superconducting states. Since the spectrum in the normal state is only produced by electrons that have undergone backscattering, i.e., electrons that have returned to the same electrode from which they originated (see the Introduction), in dirty contacts the concentration gradient of elastic scatterers which exists in all mechanically formed contacts plays a very important role. The maximum concentration of scatterers occurs at the boundary between the electrodes and falls off inside the cantilevers. This means that the diffusion of electrons after they are scattered on nonequilibrium phonons takes place preferentially in the direction of decreasing scatterer concentration. Because of this, the major contribution to the spectrum in the normal state is from scattering events immediately adjacent to the boundary between the electrodes.
At the same time, any scattering process for nonequilibrium phonons on Andreev electrons is efficient, since it leads to a drop in the excess current. Thus, the spectrum in the normal state will the formed directly at the boundary, in the region where the scatterer concentration is highest, while the superconducting contribution to the spectrum is formed in a larger, cleaner region of the superconductor. To summarize, we have the following:
-
1.
If the PC spectrum in the normal state and the EPI function recovered from the superconducting contribution to the current are fundamentally different in shape, then they originate in geometrically different volumes of the point-contact.
-
2.
Since the conversion length for Andreev electrons into Cooper pairs is the coherence length, for point-contacts with the superconducting contribution to the spectrum is formed in a volume smaller than the contact diameter.
When items 1 and 2 are satisfied simultaneously, we are dealing with a nonuniform point-contact in which impurities and lattice distortions are concentrated near the boundary between the electrodes. The spectrum in the normal state is formed right at this boundary, while the spectrum in the superconducting state develops in a volume extending from the boundary by the coherence length, within which the crystal lattice is not distorted so much.
When , recovery of the EPI function from the superconducting contribution requires that the reduction in the relative intensity of the high-energy part of the phonon spectrum be taken into account and a correction for the decrease in the excess current must be included.
III Conclusions
-
1.
It has been found that for point-contacts with diameters larger than or on the order of the coherence length, the relative magnitude of the negative phonon contribution to the excess current is considerably greater than that for ballistic contacts. This leads to substantial suppression of the high-frequency peaks in the spectra for the superconducting state. In order to recover the EPI function from these spectra it is necessary to correct their intensities at high energies. For dirty and point-contacts with , which have no EPI spectrum in the normal state, the EPI functions have been recovered from the superconducting spectra.
-
2.
The effect of a magnetic field on the current-voltage characteristics and their derivatives for point-contacts of with has been studied. It was found that in zero magnetic field and in fields close to those which suppress superconductivity, when the size of the superconducting gap can be neglected, the position of the peaks in the differential resistance in the first derivatives of the I-V curve coincides with the peaks of the Yanson EPI spectra. In low fields the peaks are shifted toward lower energies and in intermediate fields the peaks are split.
This work was supported by the National Academy of Sciences of Ukraine as part of project FTs 3-19. The author thanks A. V. Khotkevich for valuable consultations and comments.
References
- (1) I. O. Kulik, A. N. Omel yanchuk, and R. I. Shekhter, Fiz. Nizk. Temp. 3, 1543 (1977) [Sov. J. Low Temp. Phys. 3, 740 (1977)].
- (2) V. A. Khlus and A. N. Omel yanchuk, Fiz. Nizk. Temp. 9, 373 (1983) [Sov. J. Low Temp. Phys. 9, 189 (1983)].
- (3) A. V. Zaitsev, ZhETF 78, 221 (1980).
- (4) N. L. Bobrov, A. V. Khotkevich, G. V. Kamarchuk, and P. N. Chubov, Fiz. Nizk. Temp. 40, 280 (2014) [Low Temp. Phys. 40, 215 (2014)]; arXiv:1405.6869.
- (5) N. L. Bobrov, V. V. Fisun, O. E. Kvitnitskaya, V. N. Chernobai, and I. K. Yanson, Fiz. Nizk. Temp. 38, 480 (2012) [Low Temp. Phys. 38, 373 (2012)]; arXiv:1207.6486.
- (6) N. L. Bobrov, V. N. Chernobay, Yu. G. Naidyuk, L. V. Tyutrina, I. K. Yanson, D. G. Naugle, and K. D. D. Rathnayaka, Fiz. Nizk. Temp. 36, 1228 (2010) [Low Temp. Phys. 36, 990 (2010)]; arXiv:1006.5933.
- (7) N. L. Bobrov, V. N. Chernobay, Yu. G. Naidyuk, L. V. Tyutrina, D. G. Naugle, K. D. D. Rathnayaka, S. L. Bud ko, P. C. Canfield, and I. K. Yanson, Europhys. Lett. 83, 37003 (2008).
- (8) Yu. G. Naidyuk and I. K. Yanson, Point-Contact Spectroscopy (Springer, New-York, 2005).
- (9) S. V. Shulga, S.-L. Drechsler, G. Fuchs, K.-H. M uller, K. Winzer, M. Heinecke, and K. Krug, Phys. Rev. Lett. 80, 1730 (1998).
- (10) B. K. Cho, P. C. Canfield, L. L. Miller, D. C. Johnston, W. P. Beyermann, and A. Yatskar, Phys. Rev. B 52, 3684 (1995).
- (11) S. Skanthakumar and J. W. Lynn, Physica B 259 261, 576 (1999).
- (12) I. K. Yanson, L. F. Rybal chenko, V. V. Fisun, N. L. Bobrov, M. A. Obolenskii, M. V. Kosmyna, and V. P. Seminozhenko, Fiz. Nizk. Temp. 14, 1157 (1988) [Sov. J. Low Temp. Phys. 14, 639 (1988)].
- (13) S. L. Bud ko and P. C. Canfield, Phys. Rev. B 61, R14932 (2000).
- (14) I. K. Yanson, L. F. Rybal chenko, N. L. Bobrov, and V. V. Fisun, Fiz. Nizk. Temp. 12, 552 (1986) [Sov. J. Low Temp. Phys. 12, 313 (1986)]; arXiv:1512.00684.
- (15) N. L. Bobrov, L. F. Rybal chenko, M. A. Obolenskii, and V. V. Fisun, Fiz. Nizk. Temp. 11, 925 (1985) [Sov. J. Low Temp. Phys. 11, 510 (1985)] .
- (16) N. E. Alekseevskii, V. I. Nizhanovskii, and K. H. Bertel, FMM 37, 63 (1974).
- (17) R. A. French, Cryogenics 8, 301 (1968).
- (18) I. Yu. Antonova, V. M. Zakosarenko, E. V. Il ichev, V. I. Rozenflants, and V. A. Tulin, ZhTF 60, 135 (1990).
- (19) G. B. Arnold, J. Zasadzinski, J. W. Osmun, and E. L. Wolf, J. Low Temp. Phys. 40, 225 (1980).