High-Sensitivity 86 GHz (3.5 mm) VLBI Observations of M87:
Deep Imaging
of the Jet Base at a 10 Schwarzschild-Radius Resolution
Abstract
We report on results from new high-sensitivity, high-resolution 86 GHz (3.5 millimeter) observations of the jet base in the nearby radio galaxy M87, obtained by the Very Long Baseline Array in conjunction with the Green Bank Telescope. The resulting image has a dynamic range exceeding 1500 to 1, the highest ever achieved for this jet at this frequency, resolving and imaging a detailed jet formation/collimation structure down to 10 Schwarzschild radii (). The obtained 86 GHz image clearly confirms some important jet features known at lower frequencies, i.e., a wide-opening angle jet base, a limb-brightened intensity profile, a parabola-shape collimation profile and a counter jet. The limb-brightened structure is already well developed at mas ( , projected) from the core, where the corresponding apparent opening angle becomes as wide as 100∘. The subsequent jet collimation near the black hole evolves in a complicated manner; there is a “constricted” structure at tens from the core, where the jet cross section is locally shrinking. We suggest that an external pressure support from the inner part of radiatively-inefficient accretion flow may be dynamically important in shaping/confining the footprint of the magnetized jet. We also present the first VLBI 86 GHz polarimetric experiment for this source, where a highly polarized (20%) feature is detected near the jet base, indicating the presence of a well-ordered magnetic field. As a by-product, we additionally report a 43/86 GHz polarimetric result for our calibrator 3C 273 suggesting an extreme rotation measure near the core.
1 Introduction
Accreting supermassive black holes at the center of active galaxies produce powerful relativistic jets that are observed as a collimated beam of plasma, often propagating beyond the host galaxies. Understanding the formation, collimation and propagation of relativistic jets is a longstanding concern in astrophysics (Blandford & Rees, 1974; Blandford & Znajek, 1977; Blandford & Payne, 1982; Begelman et al., 1984), and the recent theoretical progress based on general relativistic magnetohydrodynamical simulations has begun to elucidate the roles of the central black hole, surrounding accretion flow and magnetic fields threading them, as well as the mutual interactions among these components, in generating and collimating a jet (e.g., McKinney, 2006; Komissarov et al., 2007; McKinney & Blandford, 2009; Tchekhovskoy et al., 2011; McKinney et al., 2012). To test the implications from such theories and then to better understand the jet formation, it is necessary to present a detailed observation that can image the relevant scales.
M87 is the first extragalactic jet discovered by Curtis nearly 100 years ago (Curtis, 1918). This jet is exceptionally close to us ( Mpc; Blakeslee et al., 2009), and sufficiently bright across the entire electromagnetic spectrum through radio to TeV -rays. These observational advantages have allowed a broad range of studies associated with relativistic-jet physics, including the large-scale jet morphology (e.g., Owen et al., 1989), the nature of the optical jet emission and shocks (e.g., Biretta et al., 1999; Perlman et al., 2001) and the origin of the high-energy X-ray to -ray emission (e.g., Harris et al., 2006; Abramowski et al., 2012; Hada et al., 2014). Moreover, optical measurements of the nuclear stellar dynamics suggest the presence of a huge central black hole of – (Gebhardt & Thomas, 2009; Gebhardt et al., 2011), although gas-dynamical measurements derive a factor of two smaller (Ford et al., 1994; Harms et al., 1994; Macchetto et al., 1997; Walsh et al., 2013). The combination of the proximity and the large black hole yields a linear resolution down to 1 milliarcsecond (mas) = 0.08 pc = 140 Schwarzschild radii () (for Mpc and ), which is typically 10 to 100 times finer than those accessible in distant quasars or blazars. Therefore, M87 offers a privileged opportunity for probing the launch/formation scales of a relativistic jet with high-resolution Very-Long-Baseline-Interferometer (VLBI) observations.
With the recent advent of the global short-millimeter VLBI project so-called the Event Horizon Telescope (EHT), observational studies of the M87 jet have become possible at a spatial scale comparable to the event horizon. At 1.3 mm (a frequency of 230 GHz) Doeleman et al. (2012) resolved a jet base/launching structure that has a size of 40 as, corresponding to (if is adopted). More recently, interferometric closure phases for the corresponding structure have been obtained at this wavelength (Akiyama et al., 2015), allowing a comparison between the observation and some horizon-scale theoretical models. Going to shorter wavelengths is also beneficial with respect to the synchrotron opacity, since the jet base becomes more transparent to the self-absorption effect (Königl, 1981). Indeed, the dependence of the M87 radio core position revealed by astrometric measurements suggests the 1.3 mm core to be located within a few from the black hole (Hada et al., 2011). Nevertheless, current VLBI experiments at such short wavelengths are still technically challenging to synthesize interferometric images due to the limited number of available antennas (thus only sparse -coverage) as well as the severe atmospheric disturbance (thus shorter coherence time). This prevents us from tracking the larger-scale propagation of the flow launched from the central horizon-scale dimension, which is essential to fully understand the subsequent acceleration and collimation of the jet.
So far, VLBI imaging studies of M87 have mostly been made at 7 mm (43 GHz), 1 cm (22–24 GHz), 2 cm (15 GHz) or longer. In these bands the M87 jet is bright enough and a sufficient number of VLBI stations are available for allowing an adequate -coverage. Previous high-quality VLBI images of the M87 inner jet revealed some important features such as a wide-opening angle base, a limb-brightened intensity profile and a counter jet (Junor et al., 1999; Ly et al., 2004, 2007; Kovalev et al., 2007; Hada et al., 2011), as well as a detailed movie near the jet base (Walker et al., 2008). More recently, the inner jet was found to sustain a parabola-shape collimation profile over a wide range of distance from 100 to from the nucleus (Asada & Nakamura, 2012; Hada et al., 2013; Nakamura & Asada, 2013). However in these bands, it is impossible to achieve angular resolution comparable to that of the short-millimeter VLBI unless relying on a space-VLBI satellite (Hirabayashi et al., 1998; Dodson et al., 2006; Kardashev et al., 2013). In addition, the higher optical depth at such long wavelengths precludes us from observing the close vicinity of the black hole. As a result, there still remains a large gap in our current understanding of this jet between the centimeter and the short-millimeter VLBI scales.
In this context, an important “bridge” to connect this gap is observational study at 3.5 mm (86 GHz). At present, 3.5 mm is the shortest wavelength where one can reliably obtain synthesized VLBI images, as represented by studies with the Global Millimeter VLBI Array (GMVA; e.g., Giroletti et al., 2008; Lee et al., 2008; Agudo et al., 2007; Molina et al., 2014; Boccardi et al., 2015; Hodgson et al., 2015; Koyama et al., 2015). The angular resolution with 3.5 mm VLBI is typically twice better than that at 7 mm, and the transparency to a jet base is also higher. On the other hand, compared to 1.3 mm, one can detect the extended (optically-thin) emission much further down the jet due to the steep-spectral nature of the synchrotron radiation, which allows a better monitoring of the larger-scale jet propagation. Therefore, the use of 3.5 mm is currently an optimal choice in terms of angular resolution, opacity and capability for imaging a jet. Nevertheless, there have been still less M87 observations in this band because 3.5 mm VLBI is generally less sensitive than that at 7 mm due to the more rapid atmospheric fluctuations as well as the worse effective aperture efficiency of telescopes. Thus the brightness of the M87 jet base (typically hundreds mJy to 1 Jy) may not be sufficient to detect interferometric fringes at high signal-to-noise (SNR) ratios. Only a handful of 3.5 mm VLBI images of M87 are published in the literature (Lee et al., 2008; Rioja & Dodson, 2011; Nakamura & Asada, 2013), and the obtained jet structure is not well characterized since the dynamic ranges of their images are only a level of 100, although somewhat better quality 3.5 mm images showing a hint of limb-brightening are presented in one of the early GMVA results (Krichbaum et al., 2006).
In this paper we report on results from new high-sensitivity, high-resolution 3.5 mm VLBI observations of the M87 jet, obtained by the Very-Long-Baseline-Array (VLBA) connected to the Green Bank Telescope (GBT). This is the first GBT-incorporated 3.5 mm VLBI observation for M87. The large collecting area of GBT, together with the recent implementation of the National Radio Astronomy Observatory’s (NRAO) wideband recording system, has allowed us to obtain an unprecedented-quality image of the M87 jet in this band, where the dynamic range has improved by a factor of greater than 10 from the previous VLBA-alone 86 GHz images (Rioja & Dodson, 2011; Nakamura & Asada, 2013). In the next section we describe our observations and data reduction. In Section 3 and 4, our new results are presented and discussed, supplementarily using contemporaneous datasets at the lower frequencies. In the final section we will summarize the paper. Throughout the paper we adopt Mpc and for M87, corresponding to 1 mas = 0.08 pc = 140 . Spectral index is defined as . Also, any -related numbers are described in frequency unit in the rest of the paper.
| UT Date | Stations | Beam size | |||||
|---|---|---|---|---|---|---|---|
| (GHz) | (MHz) | (masmas, deg.) | |||||
| (a) | (b) | (c) | (d) | (e) | (f) | (g) | |
| 2014 Feb 11…………… | 86.266 | VLBA, GBT, SC, HN | 512 | () | 549 | 0.63 | 871 |
| 2014 Feb 26…………… | 86.266 | VLBA, GBT, SC, HN | 512 | () | 521 | 0.36 | 1447 |
| 2014 Feb (11+26)(h).. | 86.266 | VLBA, GBT, SC, HN | 512 | () | 547 | 0.29 | 1886 |
| 2014 Mar 8…………….. | 43.230 | VLBA, MK, FD | 128 | () | 786 | 0.85 | 924 |
| 23.830 | VLBA, MK, FD | 128 | () | 880 | 0.82 | 1073 | |
| 2014 Mar 26…………… | 43.296 | VLBA | 256 | () | 795 | 0.50 | 1590 |
| 23.894 | VLBA | 256 | () | 926 | 0.43 | 2153 | |
| 2014 May 8…………….. | 43.296 | VLBA | 256 | () | 735 | 0.56 | 1312 |
| 23.894 | VLBA | 256 | () | 869 | 0.64 | 1358 |
Notes: (a) central frequency; (b) participating stations. VLBA indicates all the ten VLBA stations. GBT, SC, HN, MK and FD are the Green Bank Telescope, Saint Croix, Hancock, Mauna Kea and Fort Davis, respectively. A minus sign before station name means the absence of that station; (c) total bandwidth; (d) synthesized beam with a naturally-weighting scheme. For reference, a beam size with a uniformlly-weighting scheme is also shown in bracket; (e) peak intensity of M87 images under naturally-weighting scheme; (f) off-source rms image noise level of M87 images under naturally-weighting scheme; (g) dynamic range calculated with and ; (h) combined visibility data over the two epochs.
2 Observations and data reduction
2.1 86 GHz data
In February 2014 we observed M87 at 86 GHz with VLBA in conjunction with GBT. From VLBA eight out of the ten stations participated in this program since the other two (i.e., Hancock and Saint Croix) do not have the 86 GHz receiver. To increase the overall sensitivity, we made an 8-hour-long quasi-full-track observation twice on February 11 and 26. The observations were made in dual (left/right-hand circular) polarization mode. The received signals were sampled with 2-bit quantization and recorded at aggregate rate of 2 Gbps (a total bandwidth of 512 MHz) using the digital-downconverter-4 (DDC-4) wideband recording mode. The down-converted signals were divided into two 128 MHz sub-bands in each polarization respectively. As an overall system calibrator (fringe check, bandpass, delay tracking, see below) of this program, we inserted 5-minute scans on the nearby bright source 3C 273 (10 degrees apart from M87 on the sky) every 30 minutes. 3C 273 was observed also for the purpose of antenna pointing by adding another 6-minute-long scans every 30–60 minutes. The second epoch has better weather conditions and system temperatures over the array. The information on these data is summarized in Table 1.
The initial data calibration was performed with the Astronomical Image Processing System (AIPS) developed at NRAO. We first corrected the visibility amplitude by applying the measured system noise temperature and the elevation-gain curve of each antenna. Atmospheric opacity corrections were made by solving for receiver temperature and zenith opacity for each antenna. We then calibrated the amplitude part of the bandpass characteristics for each station using the auto-correlation spectra of 3C 273.
The calibration of the visibility phase was made following the amplitude calibration. To recover 86 GHz fringes as much as possible, we performed the phase calibration in the following way. We first corrected known phase variations due to parallactic angle effects. Next, the instrumental phase and delay offsets for each antenna were derived using a scan of 3C 273, and subtracted from the whole dataset assuming that they are constant with time (note that at 86 GHz no pulse-cal signals are available to calibrate instrumental effects). After that, we ran a global fringe-fitting on 3C 273 with its source structure model created by the procedure described below (a point source model was assumed in the first round where the source model was not available), and derived time evolutions of the residual delay, rate and phase for each IF separetely. We detected fringes for most of the scans at adequate SNRs. Since the derived residual delay component (that mainly comes from unpredicted atmospheric fluctuations in the correlation stage) slowly varies on the sky, we can use the 3C 273’s delay solutions as a good first-order approximation for those of M87’s residual delay. We thus interpolated the derived 3C 273’s delay solutions to the scans of M87. Implementing this process, now we can go to fringe-fitting on M87 with a tight delay search window (as small as nsec), which is quite effective in avoiding false signals. We performed a global fringe-fitting on M87 with a solution interval of 15 sec and an SNR threshold of 4.0. Since the phase and delay offsets between IFs are already removed, we derived IF-averaged solutions for M87 to increase SNR by a factor of 1.4. Similarly to 3C 273, we ran two cycles of fringe-fitting iteratively; the first round (where no source model available) was performed with a point source model, and after creating a coarse image, the second round was executed with the source model. This indeed slightly increased the fringe detection rate. In every fringe-fitting the most sensitive station GBT was used as the reference antenna.
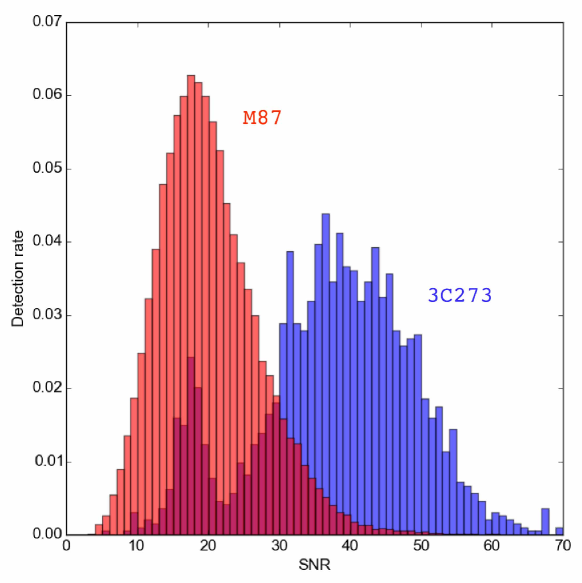
Through this procedure, we recovered a number of fringes at sufficient SNRs. In Figure 1 we show (normalized) histograms of SNR for the detected fringes on M87 and 3C 273. For 3C 273 the median/mean SNRs were 38 and 38, respectively. For M87 the median/mean SNRs were 19 and 20, respectively. Note that the SNR histogram for 3C 273 is relatively widely distributed. This is because the source structure of 3C 273 is highly complicated (see Appendix) and the correlated flux density changes more drastically with baseline length, than in the case of M87.
After the visibility data became coherent with time and frequency, the data were integrated over frequency (but the two IFs kept separated), and in time to 30 sec. These data were then used for creating images.
We performed our imaging process in the following way. We first exported the averaged data to the Difmap software (Shepherd et al., 1994), and performed intensive flagging of the visibility data. At 86 GHz, antenna pointing is generally less accurate than that at lower frequencies, and this causes an unwanted systematic decrease of visibility amplitude in some scans. These scans then cause significant sidelobes in the initial stage of imaging process, which prevents us from reconstructing a reliable CLEAN/deconvolution model. Thus, in addition to obvious outliers, we carefully flagged such bad scans in an antenna-based manner.
Following the initial exhaustive flagging, we then worked on iterative CLEAN/self-calibration processing. We conducted this process using Difmap and AIPS in a hybrid manner. We used Difmap only to perform CLEAN deconvolution (because CLEAN with Difmap is faster and more intuitive than with AIPS). Then after obtaining a reasonable set of CLEAN components, the model and the (uncalibrated) visibility data were exported back to AIPS, and we performed self-calibration using the AIPS task CALIB. This is advantageous for better calibration because the self-calibration with CALIB can be handled more robustly and flexibly (e.g., in terms of weighting for each antenna and SNR cutoff setting) than that in Difmap. Self-calibration with CALIB was also necessary for proper polarization analysis (see below) since CALIB can solve the complex gain terms for LL/RR polarization separately, while Difmap cannot do that. Then the self-calibrated visibility data were again exported back to Difmap to create an improved CLEAN model. We repeated this CLEAN/self-calibration round until the reconstructed CLEAN model no longer improved significantly. In the first several CLEAN/self-calibration cycles, the phase-only self-calibration was done, and after the phase part was well corrected, the visibility amplitude was also self-calibrated iteratively with solution intervals starting from several hours down to a few minutes.
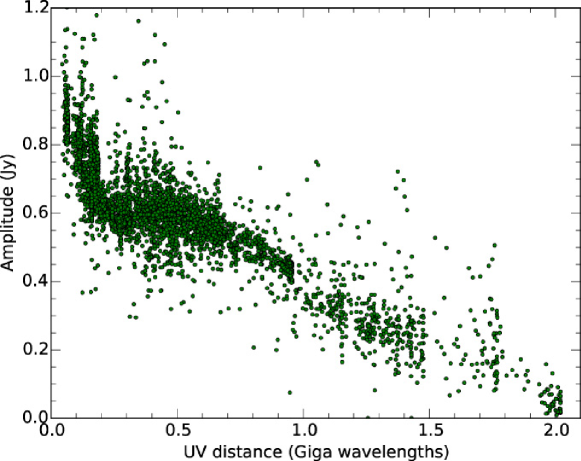
In Figure 2 we show a resulting -distance plot of the calibrated visibility amplitude of M87. Thanks to the excellent quality of the dataset, one can see that the visibilities are homogeneously sampled over the entire -distance and thus the overall trend is well-defined. One can see that the whole visibility set primarily consists of two components. One is an extended component which significantly contributes at baselines shorter than 0.2 G, while the other is a compact component that dominates beyond 0.2 G to the longest 2 G baseline. For the compact component, the correlated flux densities are monotonically decreasing with increasing -distance, and the amplitude is 100 mJy at the longest baseline. Despite such low flux densities, the signals were robustly detected since the longest baseline consists of GBT-MK pair.
2.2 Polarization analysis at 86 GHz
Although our 86 GHz observations were not ideally designed for accurate polarimetric study, we can still attempt a polarization analysis by taking advantage of the scans of 3C 273. Following the parallactic angle corrections described above, the cross-hand R-L phase and delay offsets were calibrated using a scan of 3C 273. The feed polarization leakage for each antenna was corrected by using the LPCAL method in AIPS (Leppänen et al., 1995) with a total intensity model of 3C 273. The derived leakage values were different with station, polarization, IF and epoch, but we obtained a value of when averaged over the whole array, which is consistent with the values derived in other VLBA 86 GHz polarimetric studies (e.g., %; Martí-Vidal et al., 2012). This is somewhat larger than typical leakages obtained at lower frequencies, and roughly close to the upper end where the linear approximation (“-term”) scheme is validated. GBT was one of the best stations where the leakages were as small as 5%, while a few of the other stations (particularly North Liberty and Brewster) occasionally showed leakages up to 20%. For each antenna we confirmed an overall consistency (within a few percent) on the derived leakages over the different IFs and epochs, indicating that the calibration is reasonably valid. Following the prescription in Roberts et al. (1994), we estimate that the corresponding error in fractional polarization in our images is 1%. As a check, we examined the minimum detectable polarization by using our 3C 273 polarization map, and confirmed that a fractional polarization down to 0.7% was recovered at 3 in the core region (see Appendix). This is consistent with the above calculation.
Regarding the electric vector polarization angle (EVPA), we cannot derive its absolute value from our data alone, since we did not perform any additional EVPA-calibration observation. However, we found a 43 GHz VLBA observation of 3C 273 that was carried out close in time with ours (on 2014 Feb 25) in the Boston University blazar monitoring program. We used this 43 GHz polarization image as a reference of our EVPA correction (see Figure 11 in Appendix). Here we assume that the EVPA of the outermost polarized component (P3 at 1.5 mas from the core) is stable with both time and frequency, and performed a nominal correction of EVPA by matching the observed 86 GHz EVPA of P3 to that of the 43 GHz one. Note that this assumption may not be correct, since the previous concurrent 86/43 GHz VLBA polarimetric study of this source suggests a large rotation measure (RM) of for inner jet components at 0.8 mas from the core (see Attridge et al., 2005). In fact, a comparison of the present 86/43 GHz polarization images similarly implies a significant RM of the order of around P3 (see Appendix for more details). If this is the case, one would expect another systematic rotation of the 86 GHz EVPA about 8∘ with respect to that at 43 GHz (i.e., ). As for the Boston 43 GHz polarization image, we adopt its EVPA uncertainty to be based on Jorstad et al. (2005). Therefore, we estimate that a potential total uncertainty of absolute EVPA in our 3C 273’s 86 GHz images is . Regarding M87, its EVPA uncertainty in 86 GHz images would be somewhat larger than this value, since the lower SNR of polarization signals (SNR4.5; see Section 3.4) from this source gives another non-negligible thermal error term. This can be estimated by where and are rms noise level and polarized intensity in polarization map (e.g., Roberts et al., 1994). With SNR=4.5, we obtain . Assuming that and are statistically independent, we estimate a total error budget for M87 to be .
2.3 Lower frequency data
As supplementary datasets, we additionally made VLBA-alone observations of M87 at 24 and 43 GHz close in time with the 86 GHz sessions. The observations were carried out on March 8, 26 and May 8 2014, where both 24 and 43 GHz were quasi-simultaneously used by alternating each receiver quickly. On March 26 and May 8, all the VLBA stations were present, while on March 8 the antennas at Mauna Kea and Fort Davis were absent. We received only RR polarization signals with a total bandwidth of 128 MHz (on March 8) or 256 MHz (on March 26 and May 8). Among these sessions, the data on March 26 were the best in overall quality, while the data on March 8 were relatively poor. The initial data calibration (apriori amplitude correction, fringe fitting and bandpass) was made in AIPS, and the subsequent image reconstruction was performed in Difmap based on the usual CLEAN/self-calibration procedure. The basic information of these data is also tabulated in Table 1.
3 Results
3.1 New 86 GHz images
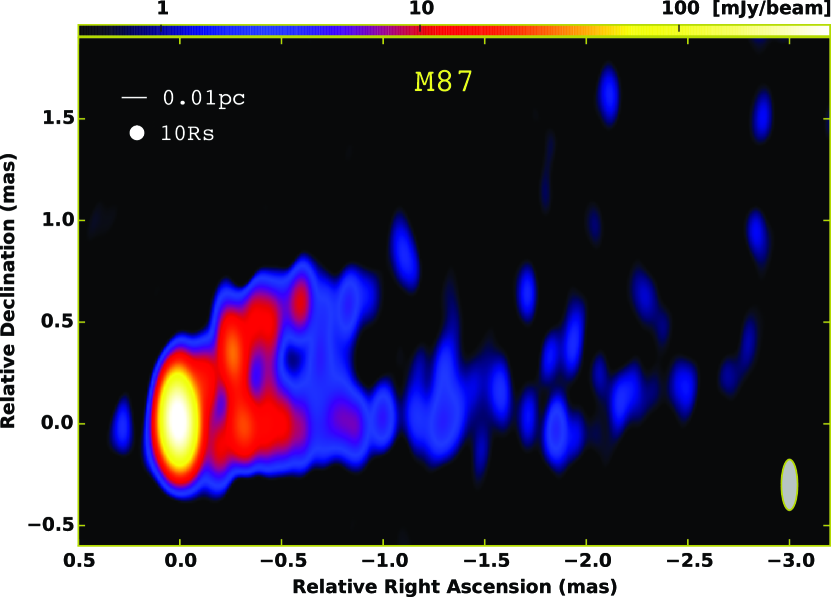
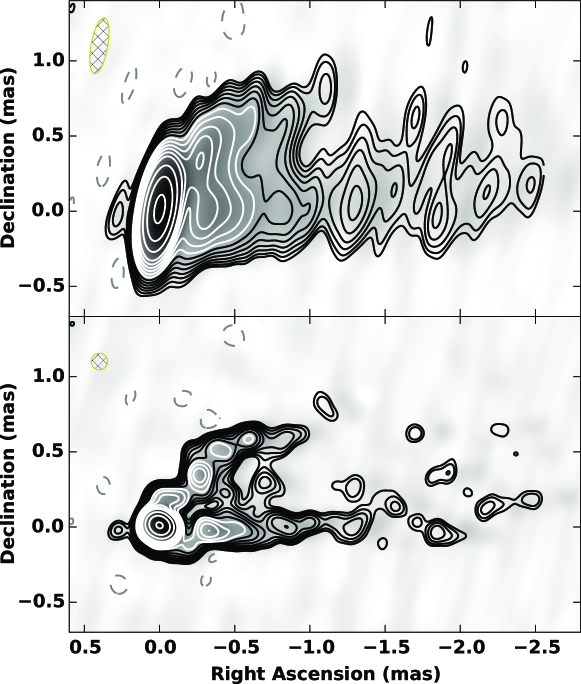
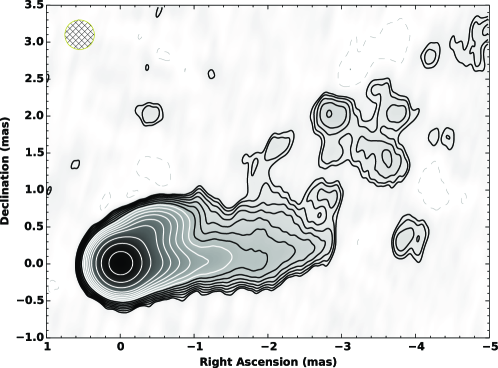
In Figure 3 we show a representative 86 GHz image of the M87 jet obtained by our VLBA+GBT observations. For a better visualization, the image is produced by combining the visibility data over the two epochs, and restored with a convolving beam of 0.25 mas 0.08 mas in a position angle (PA) of 0∘. A contour image with a naturally-weighting scheme is also displayed in the top panel of Figure 4.
Thanks to the significant improvement of sensitivity, a detailed jet structure was clearly imaged down to the weaker emission regions. The resulting image rms noise of the combined image was 0.28 mJy beam-1. In this period the extended jet was substantially bright down to 1 mas from the core. The weak emission was detected (particularly in the southern limb) down to 3 mas from the core at a level of 3 , and another 1–2 mas at 2 level. The peak surface brightness of the image was 500 mJy beam-1 at this resolution, corresponding to an image dynamic range greater than 1500 to 1 (the detailed value slightly varies as a function of the weighting scheme and convolving beam). This is the highest image dynamic range obtained so far at 86 GHz for this jet, and is quite comparable to typical dynamic ranges in VLBA images at 43 GHz (e.g., Ly et al., 2007). We describe a comparison of our 86 and 43 GHz images in the next subsection.
Regarding the individual epochs, the second epoch was better in overall image quality than that at the first epoch. As listed in Table 1, the synthesized beam for the first epoch is more elongated in the north-south direction than that for the second epoch. This is mainly because the Brewster station, which constitutes the longest baselines in the north-south direction, had the higher system noise temperatures during the first session. Thus the less-weighted dataset on this station creates a slightly larger fringe spacing along the north-south direction.
Consistent with known lower-frequency images, most of the radio emission at 86 GHz is concentrated on the compact radio core at the jet base. To quantify the structure of the core region, we performed a single elliptical Gaussian modelfitting to the calibrated visibility data with the Difmap task modelfit. The derived model parameters are summarized in Table 2. As a check we performed the same fitting to the three different datasets, i.e., the Feb/11 data, the Feb/26 data and the combined one, but virtually the same result was obtained. Additionally, we performed another elliptical Gaussian model fitting on the image plane using the AIPS task JMFIT and examined the deconvolved result, but this was also essentially the same within errors. The derived geometry of the core is close to a circular shape with a diameter of 80 as, which is just in between the sizes obtained at 230 GHz (40 as; Doeleman et al., 2012) and 43 GHz (110–130 as; Hada et al., 2013). A size of 80 as is consistent with that obtained in our previous study based on an archival VLBA 86 GHz dataset (Hada et al., 2013), but the result presented here is much more reliable. Adopting the parameters derived with the combined data, a brightness temperature of the 86 GHz core is estimated to be K. Although the observed epochs are different, this value is quite similar to reported for the 230 GHz core ((1.2–1.4); Akiyama et al. 2015). No significant valiability was found in of the core between our two 86 GHz sessions.
| Data | PA | |||
|---|---|---|---|---|
| (as) | (as) | (deg.) | (mJy) | |
| (a) | (b) | (c) | (d) | |
| Feb 11 | ||||
| Feb 26 | ||||
| Feb (11+26)(e) |
Notes: (a) major axis size of the derived elliptical Gaussians; (b) minor axis size of the derived elliptical Gaussians; (c) position angles of the major axes of the Gaussian models; (d) total flux densities of the Gaussian models; (e) combined visibility data over the two epochs. For (a), (b) and (c), we estimate a practical uncertainty of each parameter by comparing the difference of the derived results between modelfit in Difmap and JMFIT in AIPS. For (d), we adopt 10% uncertainty based on the absolute typical amplitude calibration accuracy.
Downstream of the core, we clearly identified a limb-brightened jet profile as seen in Figure 3 and Figure 4. While such a limb-brightened structure in M87 is repeatedly confirmed in previous VLBA 43 GHz/15 GHz images (e.g., Junor et al., 1999; Ly et al., 2007; Kovalev et al., 2007; Hada et al., 2011, 2013), it was not so clear in previous VLBA 86 GHz images (Rioja & Dodson, 2011; Nakamura & Asada, 2013), although one of the early GMVA images presented by Krichbaum et al. (2006) suggested a hint of limb-brightening.
For a better description of the near-core structure, in the lower panel of Figure 4 we display the same image as in the upper panel but restored with a circular Gaussian beam whose diameter is equal to the minor axis of the synthesized beam in the upper panel. The jet launching morphology within 0.5 mas from the core appears to be complicated, but one obvious feature found in this image is that the limb-brightened structure is already well developed at mas (equivalent to , projected) from the core with a large opening angle. We investigate the transverse jet structure in more detail in Section 3.3.
At the eastern side of the core, we detected weak but significant emission (at a level of 6 in the combined image) at 0.25 mas from the core (see the upper panel of Figure 4). This emission was also detected in the second-epoch-only image, but was marginally seen in the first-epoch-only image due partly to the lower sensitivity. The previous high-dynamic-range imaging of this jet at 15 and 43 GHz detected the counter emission in more detail (Kovalev et al., 2007; Ly et al., 2007; Acciari et al., 2009), and they conclude that the counter emission is a real counter jet. As described below, based on the observed proper motion and consistent detection at 43 GHz, we also conclude that the counter feature detected in the present observations is a real counter jet component emanated from the core.
In Figure 5 we also show a tapered image restored with a 0.4-mas-diameter beam to emphasize the larger-scale emission more noticeably. Consistent with known lower-frequency images, the 86 GHz jet is extending to the northwest direction on the large scale. In this period the southern limb is brighter within 3 mas from the core, then the northern side rebrightens beyond that distance. Eventually the PA of the central jet axis results in 293∘, matched with that in lower-frequency images.
3.2 Comparison with lower frequency images
Although our 86 and 43/24 GHz observations were not simultaneous but 10 days to 10 weeks apart, it is still useful to compare them to examine any structural consistency or variations. In fact, their comparable image dynamic ranges at a level greater than 1000 to 1 allow a reliable image comparison between 86 GHz and the lower frequencies for the first time.
3.2.1 Jet morphology
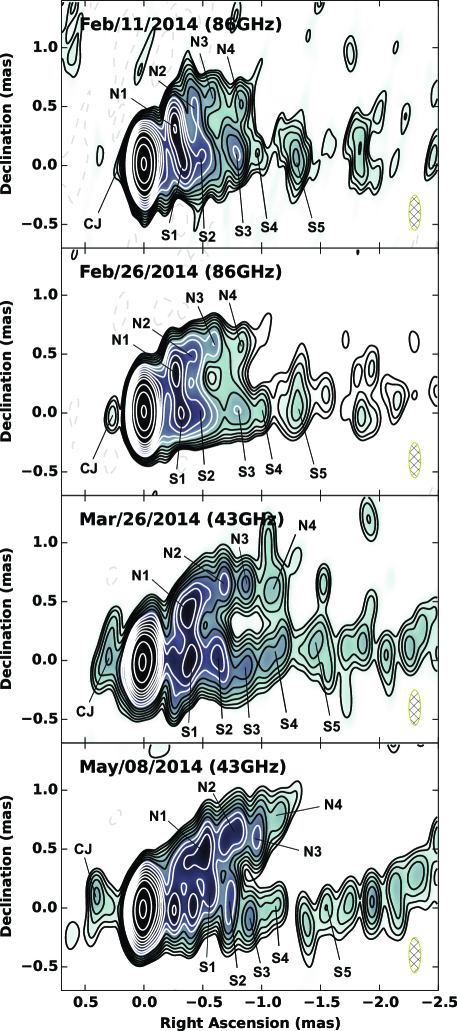
In Figure 6 we show a sequence of our 86 and 43 GHz images, where all the images are restored with the same convolving beam of mas in PA 0∘, which is approximately an intermediate resolution between 86 and 43 GHz. The overall jet shape and characteristic structure is in good agreement with each other. It is known that the M87 jet is relatively smooth and less knotty, but here we do see some noticeable features or patterns in the jet when imaged at the high resolution. As shown in Figure 6 we identified several components in both 86 and 43 GHz images consistently, including a counter jet component (which is more prominent at 43 GHz). These features are marked as CJ (counter jet), N1–N4 (in the northern limb) and S1–S5 (in the southern limb), respectively. Since these components are typically 0.2 mas/0.4 mas apart from each other in east-west/north-south directions, we could identify them separately regardless of the shape of applied convolving beam between 86 and 43 GHz. At 24 GHz, its larger beam size led to the mix of adjacent components, precluding us from identifying these inner components separately. In our 24 GHz images we instead identified another component at 2 mas downstream of the jet (in the northern limb), which is marked as C24.
3.2.2 Proper motions
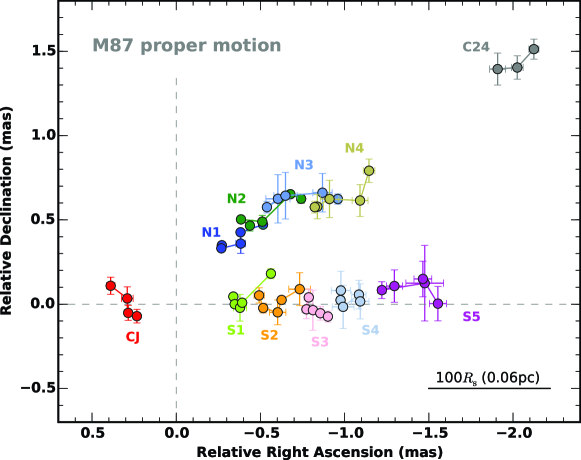
While these components were consistently identified over the observed period, they were indeed gradually moving in the jet. In Figure 7 we show the observed positions of these components with respect to the core over the monitoring period. For each component the position was measured by fitting an elliptical Gaussian model with the AIPS task JMFIT, and its position uncertainty was estimated by the fitted size divided by the peak-to-noise ratio (Fomalont, 1999). The measured proper motion results are summarized in Table 3. Note that there may be an absolute position offset between the 86/43 GHz cores due to core-shift. However, such a shift is expected to be only 20 as between 86/43 GHz (assuming the dependence determined at low frequencies; Hada et al., 2011), which is substantially small compared to the proper motions observed in the present study.
In the main jet a mean speed of the observed components is , where most of them are moving at a similar speed in the range of 0.3–0.5. On the other hand, the counter jet CJ is moving in the opposite (to the northeast) direction at a slightly slower speed of . These values observed both in the jet and counter jet are similar to those suggested by Ly et al. (2007), although at that time the measurement was based on only one pair of VLBA 43 GHz observations separated by more than 6 months. Note that S3 and S4 appear to be quite slow or quasi-stationary compared to the rest of the features in the main jet. For these features we cannot completely rule out the possibility of component misidentification among the different epochs. However, looking at the overall evolution of the jet morphology within 1 mas from the core, the northern limb gets more elongated than the southern limb during our monitoring period (see Figure 6). It therefore seems that an asymmetry exists in jet apparent motions between the northern and the southern limbs, which is consistent with the measured slow motions of S3 and S4. The presence of quasi-stationary components in the subpc jet of M87 is also suggested by Kovalev et al. (2007) based on a long-term VLBA 15 GHz monitoring. We did not see clear signatures of the faster (1) motions as reported in Walker et al. (2008) and Acciari et al. (2009).
| Features | PA | |||
|---|---|---|---|---|
| (mas) | (deg.) | (mas yr-1) | () | |
| (a) | (b) | (c) | (d) | (e) |
| CJ | ||||
| N1 | ||||
| N2 | ||||
| N3 | ||||
| N4 | ||||
| S1 | ||||
| S2 | ||||
| S3 | ||||
| S4 | ||||
| S5 | ||||
| C24 |
Notes: (a) component name; (b)(c) radial angular distance and position angle of component from the core on 2014 February 11 (on March 8 for C24); (d) best-fit proper motion value; (e) corresponding apparent speed in the unit of the speed of light.
3.2.3 Spectra
Comparing the closest pair of the data on Feb/26 (at 86 GHz) and Mar/8 (at 43 GHz), the observed peak brightness in each image (when measured with a common beam as in Figure 6) is 530 mJy beam-1 (at 86 GHz on Feb/26) and 546 mJy beam-1 (at 43 GHz on Mar/8), respectively. This results in a non-simultaneous (but still close-in-time) 43/86 GHz spectral index of the core (at this resolution) being flat (), indicating that the M87 core is substantially self-absorbed up to 86 GHz.
Considering the significant proper motions as well as the variable nature of the individual components in the extended jet, it is difficult to obtain an accurate spectral index distribution map with the present non-simultaneous 43/86 GHz images. Hence, here we only examined spatially-integrated spectra for the main and counter jet in the following way. For the main jet, we compared the integrated flux densities (sum of CLEAN components) between the two frequencies for an area from 0.2 to 1.2 mas along the jet, corresponding to the inclusion of N1–N4 and S1–S4. We obtained an integrated spectral index of for this region. For the same region, we also checked a spectral index between 24 and 43 GHz using our data, and obtained a value of . These two values are consistent within the errors, although a possible spectral steepening might exist at 43 GHz due to the higher cooling efficiency.
As for the counter jet, the observed spectrum between 43/86 GHz seems to be steeper than that of the main jet (). However, the uncertainty is still large due to its weak nature.
3.2.4 Jet to counter jet brightness ratio
Given that the brightness profile of the main jet is very rich while the counter jet is weak and less characterized, there is a large uncertainty in determining the exact value of the jet-to-counter-jet brightness ratio (BR).
Here we consider the following possibilities to estimate BR: (1) CJ is the counter part of S1: (2) CJ is the counter part of S2. The choice of (1) is because CJ and S1 are symmetrically located with respect to the core, while the case (2) is also possible if we additionally consider the relativistic “arm-length ratio” that reflects a factor of 2 different apparent motions between the jet and the counter jet.
In the case of (1), when compared using the total flux densities, BR results in 25.2 or 5.7 at 86 or 43 GHz, respectively. In the case of (2), BR results in 22.0 or 4.4 at 86 or 43 GHz, respectively. Alternatively, if we use the peak flux densities, BR results in 25.3/4.7 at 86/43 GHz for the case (1), while 21.4/5.6 at 86/43 GHz for the case (2), respectively.
It is not clear yet whether the resulting difference in BR between 86 and 43 GHz is real or not. We regard that the measurements at 43 GHz would be more secure due to the higher SNR for the counter jet. Conservatively, here we conclude that BR is between 5–25 within the central 1 mas region.
3.3 Transverse jet structure
Resolving a jet in the direction transverse to the jet axis is important for understanding the opening angle, collimation efficiency and possible velocity gradient across the jet. To perform this, one needs a high quality image at a sufficient angular resolution across the jet. The new 86 GHz image presented here allows us to analyze a detailed transverse structure of the jet launch region near the black hole.
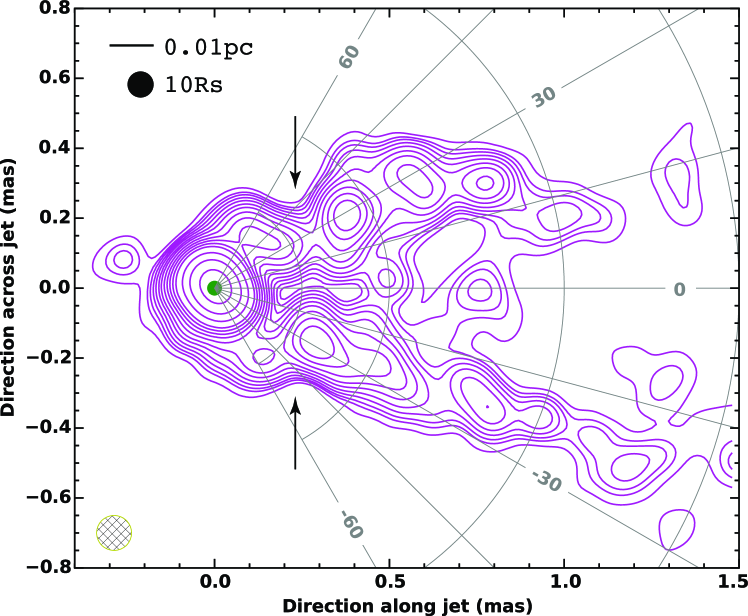
In Figure 8 we show a close-up view of the innermost region of the M87 jet. For a better description across the jet, the image is restored with a circular Gaussian beam whose FWHM is equivalent to that of the minor axis of the synthesized beam. This is the same contour image as that in the lower panel of Figure 4, but here the image is rotated on the sky by in order to align the jet central axis to the horizontal axis.
A strongly limb-brightened profile is evident beyond 0.5 mas from the core, as consistently seen in the 43 GHz images. Within 0.5 mas from the core, the limb-brightening is continuously visible. It is notable that the limb-brightened jet is already formed at 0.15 mas distance from the core. Moreover, one more remarkable feature near the core is that the limb-brightened jet is evolving in a highly complicated manner; in particular, there is a “constricted” structure at 0.2–0.3 mas from the core, where the jet appears to be shrinking locally. One might be concerned that this structure can be artificially produced due to insufficient deconvolution accuracy, since the original synthesized beam of our 86 GHz array is elongated in the northeast-southwest direction, which particularly could affect the near-core shape of the northern limb. However, we conclude that this is not an artifact. The root of the northern limb at 0.1–0.2 mas from the core is relatively knotty, and we were required to put relatively strong CLEAN components in our deconvolution process. Thus this feature was distinguishable from the central core emission. As an independent test, we also examined the fidelity of our super-resolution image at 86 GHz using sparse-modeling technique (Honma et al., 2014), and obtained a consistent structure within 0.2 mas from the core. Details about the application of this technique to the present data will be described in a forthcoming paper. We additionally note that the corresponding structure is marginally seen also in our 43 GHz images (as a “neck” of intensity between the core and N1/S1; see e.g., the middle panel of Figure 6), suggesting that this structure is sustained at least during our monitoring period (a few months).
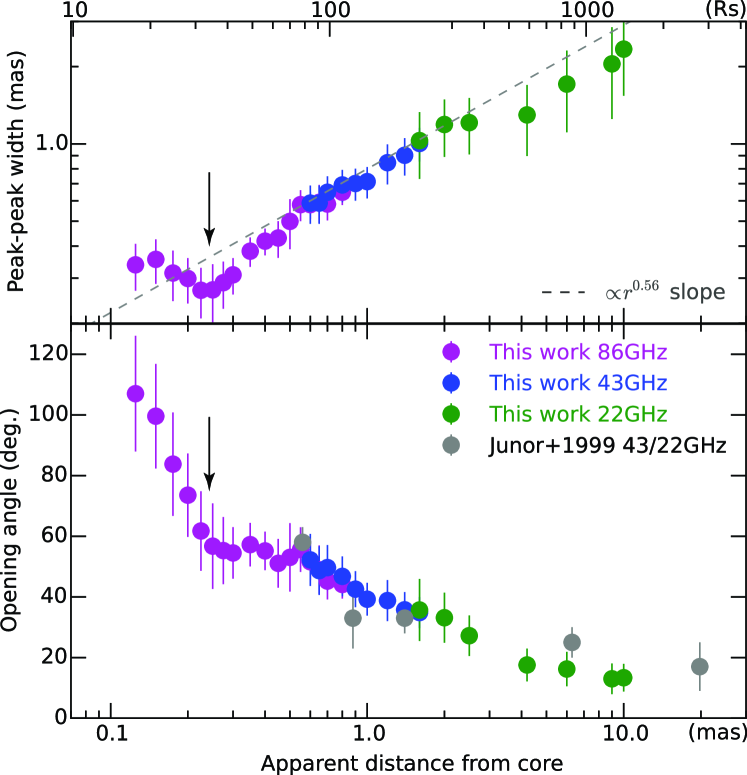
Using Figure 8, we analyzed the radial evolution of the transverse jet structure in detail. The results are presented in Figure 9, where we supplemented lower-frequency measurements at 43 and 24 GHz further down the jet. The upper panel indicates the observed jet width profile , while the lower panel plots the corresponding (apparent) opening angle profile assuming the size of the jet origin being infinitesimally small. As for here we defined it by the peak-to-peak separation of the two limbs perpendicular to the jet axis (thus for clarity, we redenote the present measurements as and ) rather than the usual outer-edge-to-outer-edge separation that would be more appropriate for expressing an “entire jet width”. The reason why we use here is because measurements of peak-to-peak separation are less affected by the applied convolving beam, while the measurements based on the outer edges are more sensitive to the beam size. This is particularly relevant to the near-core region where the jet cross section is comparable to or even smaller than that of the synthesized beam. Our present purpose is not to determine an absolute width of the jet but rather to measure a radial dependence of the jet evolution as close to the core as possible by using a specific streamline in the jet. In this respect, is a proper way which permits to use a super-resolution image and thus to quantify the streamline closer to the core. We note that the radial dependence of can be different from that of . This should be in fact an interesting topic to be examined, but determining a detailed difference between them is beyond the scope of our present work. Such an advanced analysis of the jet profile is indeed possible by taking in advantage of the sparse modeling technique mentioned above, and hence will be presented in the forthcoming paper.
The following interesting features are found in Figure 9. Beyond 0.5–0.6 mas from the core, the measured jet shape is well described by a parabolic collimation profile. There are several previous measurements for jet width and opening angle on this scale. For the jet width, Asada & Nakamura (2012) and Hada et al. (2013) determined a radial profile to be over the distance from 1 mas to 500 mas from the core, and the present beyond 0.5 mas is in good agreement with this dependence. For the opening angle, it was previously measured by Junor et al. (1999) and Biretta et al. (2002), and their finding of opening angle at 0.5 mas from the core is consistently seen in our result at the same distance111In Junor et al. (1999) and Biretta et al. (2002) the opening angle is defined with respect to the full-width-quarter-maximum (FWQM) on jet intensity slice profiles. This gives a slightly larger opening angle than that in our method at the same .. On the other hand, closer to the core where our 86 GHz image can access, the jet profile becomes more complicated. From the distance of 0.6 mas to 0.3–0.2 mas where the constriction exists, the observed opening angle remains roughly constant at , indicating the jet having a conical geometry. Then, even closer to the core within 0.25 mas, the jet widens again by a factor of 1.5–2. As a result, the apparent opening angle rapidly increases from up to in this region. This trend can be recognized in Figure 8 with the guide of polar coordinates. If the opening angle is defined with respect to instead of , the value should be even larger.
Note that the opening angle may become smaller if the jet launch point has a finite size (cross section). However, all the previous EHT observations of M87 at 230 GHz constrained a jet-launch size to be remarkably small (40 as; Doeleman et al., 2012; Akiyama et al., 2015). For reference, we superpose the corresponding model of the 230 GHz core on the coordinate origin of Figure 8. As seen from this map, the modification of the opening angle is sufficiently small at our scale of interest, so our assumption should be reasonablly valid. Therefore, this is the largest opening angle ever observed in any astrophysical jets as well as in M87 itself.
3.4 Polarimetry
In Figure 10 we show a result of our 86 GHz polarimetry analysis for the M87 jet. Here we display the data on February 26, since on this epoch the data quality is better and also we can perform the more reliable EVPA correction with the help of an external close-in-time VLBA observation of the calibrator 3C 273 (see Appendix in more detail). The result on February 11 is essentially consistent with Figure 10, although the SNR is lower than that on February 26.
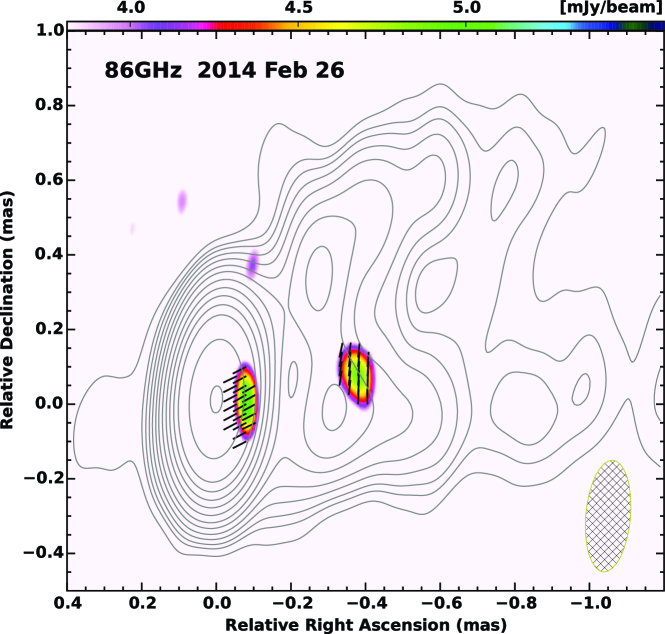
Given that the M87 jet is only weakly polarized (or highly depolarized) on pc-to-subpc scales presumably due to a dense foreground Faraday screen (Zavala & Taylor, 2002), the present observation is still challenging to reveal the whole polarimetric structure of this jet. Nevertheless, we indeed detected some significant polarized emission in a few parts of the jet at SNR4.5. One polarized feature was detected at 0.1 mas downstream of the core. This feature has a polarized intensity of 5.0 mJy beam-1, and its fractional polarization is a level of 3–4%. On the other hand, we detected another polarized feature at 0.4 mas downstream in the jet. While this feature has a similar polarized intensity (4.9 mJy beam-1) to that of the other one, the observed fractional polarization becomes as high as 20%. Since the previous VLBI polarimetric observations of this jet (which are usually made at 15 GHz or lower frequencies) reported a fractional polarization up to 11.5% (Junor et al., 2001), this is the highest fractional polarization ever reported on pc-to-subpc scales of this jet. This polarized feature appears to be located at the boundary of S1 and the central “valley” of emission (so-called the “spine” part of the jet).
Regarding EVPA, the near-core feature shows a mean EVPA direction along the jet, while the near-S1 feature indicates a mean EVPA roughly perpendicular to the jet. If this is the case, the corresponding magnetic-field-vector-polarization angle (MVPA) of the near-core/near-S1 features are perpendicular/parallel to the jet axis, respectively. However, we remind that there is still a large uncertainty in our EVPA correction procedure (; see Section 2.2 or Appendix). Moreover, there might be an additional external EVPA rotation if there is a significant amount of the foreground Faraday screen toward M87 (e.g., if RM104 rad m-2). This does not permit us to fix the intrinsic EVPA definitively.
4 Discussion
4.1 Jet viewing angle and speed
The viewing angle of the M87 jet has been discussed for a long time and still remains as a puzzling issue for this jet. Owen et al. (1989) suggest that the jet is not too far out of the plane of the sky () based on the patterns of the helically-wrapped filaments seen in the kpc-scale VLA jet. On pc-to-subpc scales Ly et al. (2007) suggest 30–45∘ based on a proper motion and brightness ratio measurement with VLBA at 43 GHz. On the other hand, a strong constraint is obtained from optical observations of the active knot HST-1 at 0.8′′ from the nucleus, where Biretta et al. (1999) found a superluminal motion up to 6 , tightly requiring to be smaller than 19∘ from our line of sight. Perlman et al. (2011) also suggest a similar range (11–19∘) based on the optical polarization properties of HST-1.
In the present study, we estimate near the jet base based on the measured apparent motions in the jet and the counter jet, such that , in the assumption that the bidirectional jet is intrinsically symmetric. If we compare CJ with S1 or S2 (as explained in Section 3.2.4), the proper motion ratio results in 1.5–2.5. Searching for a common area with , we then obtain solutions of and to be – and –, respectively. With these ranges of and , we can also estimate an expected BR, and this results in a range of – (assuming a continuous jet model with ), which is consistent with the observed BR in our 43 GHz images. Therefore, our estimate of is rather similar to those suggested in Ly et al. (2007), whose measurement was also made at a similar distance from the core. In contrast, the derived range of is larger than that obtained from the optical HST-1 kinematics.
We do not rule out the possibility of the smaller as suggested from the HST-1 observations, since there can be still an overlap if we allow the maximum proper motion ratio within the 1 errors. Also, a recent VLBA 43 GHz monitoring program of the inner jet by Walker et al. suggests a fast apparent motion (in the main jet) of (1–2) (Walker et al., 2008), which might favor a small viewing angle. Thus the more accurate measurements of proper motion as well as brightness ratio are important in future studies.
One issue, however, we should note is that the M87 jet is highly limb-brightened. A commonly invoked explanation for limb-brightening structure in relativistic jets is that there is a velocity gradient transverse to the jet, such that the flow speed becomes faster toward the jet central axis (e.g., Ghisellini et al., 2005; Nagai et al., 2014). According to this idea, the brighter part of the jet (i.e., the limb/sheath) has a larger Doppler factor ( where is the bulk Lorentz factor) to the observer, while the dim part of the jet (i.e., the central spine) has a smaller due to the lower beaming relative to the sheath. Since reaches a maximum at , if we consider the case of –, the faster yields the larger for most of unless is unrealistically higher than . This results in , indicating that the jet brightness profile would lead to a ridge-brightened structure. On the other hand, if we consider the case of –, reaches a maximum at 0.70–0.87. Then beyond this , starts to decrease, which in principle can reproduce a limb-brightened intensity profile.
Therefore, the observed limb-brightened structure of M87 may not be simply explained by a transverse velocity gradient alone if –, requiring some other process being at work (e.g., Lobanov & Zensus, 2001; Stawarz & Ostrowski, 2002; Gopal-Krishna et al., 2007; Zakamska et al., 2008; Clausen-Brown et al., 2011).
An alternative hypothesis to accommodate the apparent discrepancy of between the inner jet and HST-1 is that the viewing angle of M87 is not constant all the way down the jet. Our long-term VLBI monitoring of HST-1 has recently revealed significant variations in the observed position angles (from PA270∘ to PA310∘) of the substructures’ trajectories (Giroletti et al., 2012; Hada et al., 2015)222Changes in position angle of parsec-scale superluminal components are also seen in another nearby radio galaxy 3C 120 (Gómez et al., 2000, 2001; Casadio et al., 2015). This implies a deprojected (intrinsic) change in direction to be 10∘ (for a fixed ). Thus, it would not be surprising if the of HST-1 is also variable at this level, and the fastest 6 speed could be seen when its is maximally beamed to us. Such a local misalignment of from the central jet axis can be realized if the HST-1 complex is traveling along a 3-dimensional helical trajectory with respect to the central jet axis.
From the point of view of the high-energy emission, the jet base of M87 is proposed to be a likely site of the very-high-enery (VHE) -ray production (e.g., Aharonian et al., 2006; Acciari et al., 2009; Abramowski et al., 2012; Hada et al., 2012, 2014). The detection of VHE -ray emission usually prefers a small viewing angle of the jet, which may also be opposed to the viewing angle derived above. However, it would be interesting to note the jet base of M87 has a very wide apparent opening angle up to (Figure 8 and Figure 9). If we consider the case of , the intrinsic opening angle is estimated to be . This means that the near side of the sheath is almost pointing toward us at 5∘ close to the jet base (assuming an axially-symmetric jet). This value is quite similar to the typical viewing angle in blazars. Therefore, the observed VHE emission from the jet base could be associated with a locally beamed substructure in the near side of the sheath (e.g., Lenain et al., 2008; Giannios et al., 2010).
We also note that the bulk flow speed near the jet base may be somewhat faster than what we measure in the component speeds. In fact, derived from the proper motion ratio is applicable to both bulk and pattern speeds, and one cannot distinguish between these two with such measurement alone. A bulk flow speed is more directly related to the brightness ratio BR. The expected BR of 8.7 described above (with and ) is actually only partially consistent with the present observations (i.e., still inconsistent with the measured BR at 86 GHz), and this situation is essentially the same for the smaller angle of e.g., (). To reproduce the observed BR in our 43/86 GHz images fully consistently, we suggest that the bulk flow speed needs to be faster than at this location.
4.2 Confinement of magnetized jet by hot accretion flow/corona?
One of the most intriguing features found from our 86 GHz observation is that the initial jet formation structure evolves in a quite complicated manner; there are multiple stages before the jet finally reaches the well-defined parabola in the outer scale. The jet is formed with 100∘, then rapidly collimated into 60∘ within 0.25 mas (a projected distance of ) from the core, and subsequently reaches the “constricted” point. From there, the jet expands roughly conically at 60∘ until 0.6 mas (84 , projected) down the jet, and finally enters the large-scale parabola collimation zone. A possible structural change of the jet profile near the black hole is originally suggested in Hada et al. (2013). While this kind of feature might be self-formed through some instabilities (such as the sausage-pinch instability in a magnetohydrodynamic flow; e.g., Begelman, 1998), this may also be a signature of the interaction of the jet with the surrounding medium. In fact, there are growing implications that a pressure support from an external medium is necessary to build an efficient collimation of a jet (e.g., Nakamura et al., 2006; Komissarov et al., 2007, 2009). Therefore, in what follows we discuss whether the formation of the M87 jet on this scale can be subject to an external effect or not, based on a simple comparison of the pressure balance between the jet () and the external medium ().
Here we consider the case that the internal pressure of the M87 jet is approximated by the sum of the leptons () and the magnetic fields (), and that the relative contribution from protons is small (Reynolds et al., 1996). In Kino et al. (2014), we examined an allowed range of the energy balance between electrons and magnetic fields at the base of this jet based on the synchrotron self-absorption (SSA) theory, and showed that the radio core at 43 GHz can be highly magnetized or at most in roughly equipartition ()333The equipartition range cited here (that is originally from Kino et al. (2014)) was derived, for simplicity, in the assumption that the underlying magnetic-field configuration is isotropic (the equation (11) in Kino et al. (2014)). However, the same formula is also applicable for the case of an ordered magnetic-field geometry just by multiplying a small modification factor of to the total field strength (see the more detailed explanation in that paper). unless the power index of the electron energy distribution is too steep (i.e., unless where ). The observed spectral index for the optically-thin part of the jet in our 24/43/86 images (– i.e., 2.2–2.6 where in the present definition) satisfies this condition. In this case, the total pressure of the jet is predominantly due to the magnetic fields, or the particle pressure is at most of the same order of magnitude of the magnetic one. Therefore, we can reasonably adopt that at the 43 GHz core. As for the 86 GHz core, we can similarly estimate its value based on the SSA formula (the equation (11) in Kino et al., 2014) in combination with the modelfit parameters listed in Table 2, and this results in 8.3 G. This value is just in between and derived in Kino et al. (2014, 2015), and a magnetically-dominated state can be consistently satisfied. Thus adopting this , we obtain . For the jet downstream of the core, depends on the radial profile of the magnetic fields. In any case, to support/confine the jet on these scales, the external medium needs to have a pressure that can be balanced with the suggested level of of .
According to the observed frequency dependence of the core shift (Hada et al., 2011), the radio core at 86 GHz is estimated to be located at 3 from the black hole on the plane of the sky. This indicates a deprojected distance of the 86 GHz core to be between 6 and 12 for a range of or , respectively. On these scales a likely source of the external confinement medium may be the inner part of accretion flow or associated coronal region (McKinney, 2006; McKinney & Narayan, 2007). Since the accretion rate onto the M87 nucleus is significantly sub-Eddington (Di Matteo et al., 2003), the accretion mode of the M87 black hole is thought to be an advection-dominated, hot accretion flow state (ADAF; e.g., Narayan & Yi, 1994). As ADAF is geometrically thick and roughly approximated by a spherically symmetric structure, such a configuration may be suitable in shaping/confining the initial stage of a jet. While the original ADAF assumed a radially-constant mass accretion rate (), subsequent theoretical studies favorably suggest that decreases with decreasing radius due to convection (Quataert & Gruzinov, 2000) or outflows (Blandford & Begelman, 1999). In fact, the recent polarimetric study for the M87 nucleus at 230 GHz has derived at from the black hole to be yr-1 (Kuo et al., 2014), which is more than 100 times smaller than that measured at the Bondi radius (0.1 yr-1 at 230 pc; Di Matteo et al., 2003). For such modified ADAF flows, Yuan et al. (2012) and Yuan & Narayan (2014) present an updated set of self-similar solutions by taking into account radially-variable (i.e., where 0.5–1). Among these solutions, the pressure profile is described as dyn cm-2, where , and are the dimensionless viscosity parameter, and (), respectively444The self-similar solutions presented in Yuan et al. (2012), Yuan & Narayan (2014) and also in Narayan & Yi (1994) (for the original ADAF) are obtained using a height-integrated system of equations. Thus “” in this case corresponds to the cylindrical radius, not the spherical radius from the central black hole. However, the effect of the vertical integration is examined in detail by Narayan & Yi (1995), and they proved that the height-integrated solutions are quite accurate approximations (within 10% for the pressure) of the exact (sperically-averaged) solutions in the limit of advection-dominated state. Hence, we can reasonably treat that in the height-integrated solutions corresponds to the radial distance from the black hole.. For onto the black hole, here we assume together with . These values are selected so that the extrapolated values of at and consistently satisfy the above observations, and thus would be a reasonable combination of and . With these values, we finally obtain dyn cm-2. Therefore, if we assume to be of the order of (e.g., Yuan et al., 2012), the ADAF pressure results in 2.7 dyn cm-2 at . Interestingly, this is quite comparable to estimated at the 86 GHz core. Hence, we suggest that the pressure support from the inner part of the hot accretion flow may be dynamically important in shaping and confining the launch stage of the M87 jet.
Given that the external pressure contribution is significant at the jet base, the observed constricted structure at a projected distance of 35 from the core may reflect some important physical signature resulting from the jet-surrounding interaction. One possibility is that this feature marks a reconfinement node of the flow (e.g., Daly & Marscher, 1988; Gómez et al., 1997; Komissarov et al., 1997; Kohler et al., 2012; Matsumoto et al., 2012; Mizuno et al., 2015). Such a flow reconfinement can be realized if the radial profile of the external pressure downstream of the core decreases more slowly than that of the jet pressure. Alternatively, this constriction might be a signature of the sudden “breakout” from the central dense confining medium (presumably ADAF/hot corona), analogous to a jet in Gamma-Ray Bursts (e.g., Morsony et al., 2007). If the breakout is the case, one may constrain a scale height (thickness) of the central confining medium to be of the order of (for ).
We note that the above discussion still leaves a considerable uncertainty in each parameter space and the actual force balance at the jet boundary may be more complicated (e.g., if the jet ram pressure at the boundary is significant or if there exists some instability in the accretion flow). In particular, the deep 86 GHz images obtained here evoke the following simple question: why is the suggested hot accretion flow still not detected in emission, despite the fact that an accretion scale well below 100 near the black hole is already imaged? This issue should be explored by future higher-sensitivity imaging observations (e.g., including the phased-up ALMA; Fish et al., 2013). Also, the lack of additional 86 GHz images at different epochs with a similar sensitivity does not permit us to conclude whether the observed constricted feature is a persistent structure or just a temporal one (although we note that the subsequent 43 GHz images in Figure 6 still show a hint of the corresponding feature at the same location). In any case, our simple order-of-magnitude estimate discussed here implies a non-negligible contribution of the external medium to the initial evolution of the M87 jet. Further VLBI monitoring for the jet base at 86 GHz will enable us to address this issue more definitively.
4.3 Implications for Faraday screen and magnetic field near the jet base
Finally we briefly discuss the polarization structure of the M87 jet. While on kpc scales polarimetric properties of this jet are intensively studied in radio and optical (e.g., Owen et al., 1989; Perlman et al., 1999; Chen et al., 2011; Perlman et al., 2011), on pc-to-subpc scales the polarization structure is still highly uncertain. This is because polarization signals from the M87 inner jet are generally quite low presumably due to a dense foreground medium on these scales, as suggested by Zavala & Taylor (2002). They found an extreme RM distribution that varies from to in the jet at 20 mas (1.6 pc, projected) from the core. Recently, Kuo et al. (2014) performed the first RM measurement toward the nucleus in the 230 GHz band with the Submillimeter Array. Although the angular resolution in their study is limited to , they suggested a value of RM near the central black hole to be within , by assuming that the bulk of the 230 GHz emission originates in the jet base within from the black hole.
The detection of polarized signals in our 86 GHz VLBI images provides some important insights into the close vicinity of the central black hole of M87. First, the detection of a polarized feature at 0.1 mas (14 , projected) from the black hole provide evidence that the RM associated with this feature is not larger than a certain value. If we assume that the depolarization has an external origin and that the observed fractional polarization degree is given by (where , and are observed fractional polarization, intrinsic polarization and standard deviation of the RM fluctuations, respectively; Burn, 1966), the maximum is constrained to be (5.8–17) (adopting – damping of ). This is consistent with obtained at a similar scale by Kuo et al. (2014). As a future work more dedicated VLBI polarimetric studies would be fruitful to reveal the more detailed spatial distribution of RM near the jet base.
The second point is that we detected a fractional polarization of 20% in the region at 0.4 mas from the core, which is the highest value ever seen in the pc-to-subpc scales of this jet. Since observed polarized signals are a consequence of multiple depolarization effects under propagation (internal/external Faraday depolarization, bandwidth/beam depolarization), the intrinsic fractional polarization must be higher than the observed one (e.g., in a manner mentioned above). Therefore, the observed highly polarized signal indicates the presence of a well-ordered magnetic field in this region. The origin of such an ordered field is still not clear, but a possible hint from our observation is that this feature is located at the boundary of the southern limb (“sheath”) and the central valley of emission (“spine”), where the presumed velocity shear may amplify the longitudinal field component (e.g., Laing, 1980). Interestingly, the observed EVPA for this feature (that is perpendicular to the jet) seems to be consistent with the shear interpretation, although the accuracy of the present EVPA calibration is still not fully adequate to confirm this scenario. Alternatively, the ordered field could be associated with a global helical/twisted field geometry, as predicted by the magnetically-driven jet scenario (e.g., Broderick & Loeb, 2009).
Ultimately, the further increase of the array sensitivity to total/polarized intensity is necessary, as well as the implementation of a better polarimetric calibration strategy. The upcoming incorporation of the Large Millimeter Telescope (Hughes et al., 2010) and of the phased-up ALMA to the millimeter VLBI network is enormously powerful in this respect (Fish et al., 2013). This will allow us to image the magnetic field structure in the jet-launching site as well as the surrounding accretion flow structure in much more detail.
5 Summary
We reported results obtained from a new high-sensitivity, high-resolution VLBA+GBT observation of the M87 jet at 86 GHz. We summarize our main results as follows.
-
1.
We obtained a high-quality image of the jet-launch region of the M87 jet down to 10 near the black hole. The resulting image dynamic range is greater than 1500 to 1, which is the highest ever obtained for this source at 86 GHz. The high-sensitivity image clearly confirmed some important well-known features of this jet such as a wide-opening angle jet launch, a limb-brightened intensity profile, a parabola-shape collimation profile and a counter jet. The limb-brightened structure is already well developed at (projected) from the core, and the corresponding apparent full-opening angle near the black hole becomes as broad as 100∘. This is the broadest opening angle ever seen in any astrophysical jets as well as in the M87 jet itself.
-
2.
We discovered a complicated jet launch shape near the black hole (100 ) in our 86 GHz image, indicating multiple collimation stages before the jet finally reaches the well-defined parabola profile in the larger scale. In particular, there is a “constricted” structure at 35 (projected) from the core, where the jet cross section is locally shrinking. We suggest that an external pressure support/contribution from the inner part of accretion flow (presumably an ADAF type hot accretion flow or associated corona) may be dynamically significant in shaping and confining the M87 jet on this scale.
-
3.
Complementing our 86 GHz data with close-in-time multi-epoch lower-frequency data, we detected proper motions in both the main jet and the counter jet, which were all subrelativistic. A mean speed of the main jet components were 0.32, while the counter jet was slightly slower at 0.17. Comparing the measured proper motions in the jet and the counter jet, the viewing angle for the inner jet is estimated to be 29–45∘, although the more dedicated proper motion studies are necessary.
-
4.
We reported on the first VLBI 86 GHz polarimetric result of the M87 jet. While it is still challenging to reveal the entire polarimetric property of this jet, we detected some polarized features near the jet base at this frequency. The detection of the polarization signals at this frequency implies that the magnitude of the rotation measure toward these features are not larger than (5–17), which is consistent with the result reported in the recent 230 GHz polarimetric study. Moreover, one of the polarized features has an observed fractional polarization up to 20%, which is the highest value ever seen on pc-to-subpc scales of this jet. This indicates the presence of a well-ordered magnetic field in the formation and collimation zone of the M87 jet.
Appendix A The calibrator 3C 273
Here we describe our data analysis and imaging for the bright quasar 3C 273 obtained by the 86 GHz VLBA+GBT program plus an additional 43 GHz archival dataset. Checking the total-intensity and polarimetric status of this source is important for validating the results for M87 (particularly the polarimetric one).
3C 273 was observed on 2014 February 11 and 26 with VLBA+GBT at 86 GHz as an overall calibrator of our program. In the top-left panel of Figure 11 we show an 86 GHz total intensity image of 3C 273 taken on February 26. The observed jet structure consists of the bright core with several discrete knots down the jet. We achieved a dynamic range of 670 to 1, allowing a firm detection of the weaker emission down to 5 mas from the core. For comparison, in the top-right panel of Figure 11 we show a close-in-time VLBA 43 GHz image of this source that was observed on 2014 February 25 as a part of the Boston University blazar monitoring program. The dynamic range of the 86 GHz image is about twice greater than that of the 43 GHz one. This enables a comparison of the images at a high confidence, despite the steep-spectral nature of the synchrotron emission. The overall jet structure and the positions of the individual features in these two images are in excellent agreement with each other.
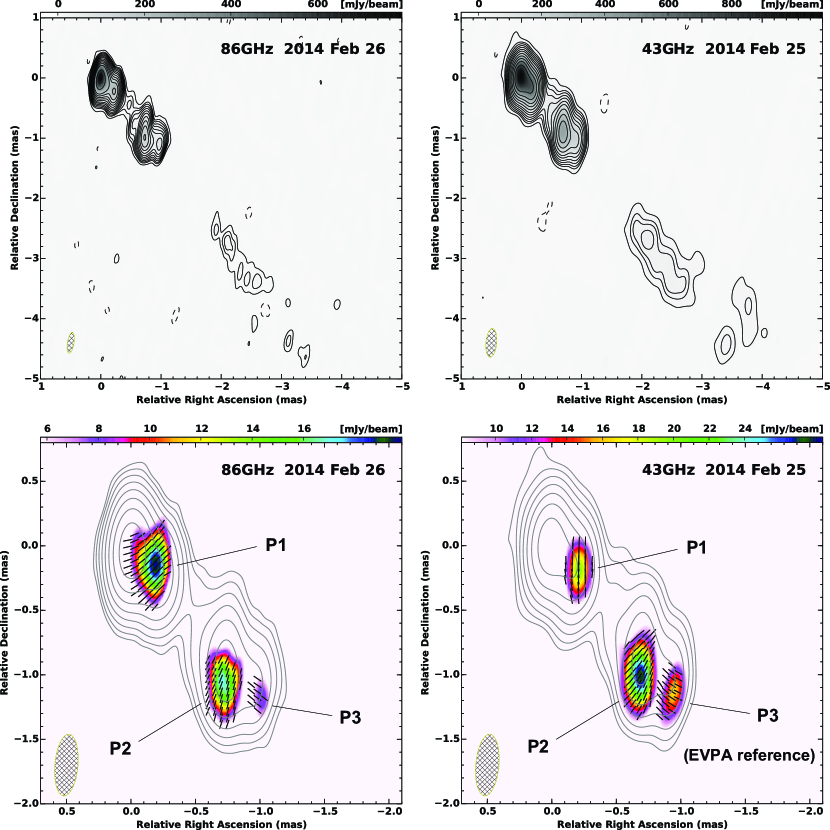
Regarding polarimetry, our results are summarized in the bottom two panels of Figure 11. The bottom-left panel shows the result obtained from the VLBA+GBT 86 GHz observation on 2014 February 26, while the bottom-right panel is the result from the VLBA 43 GHz observation on 2014 February 25. Within the central 2 mas of the jet, we identified three prominent polarized components that were consistently detected in the 86 and 43 GHz images. As described in Figure 11 these are termed as P1, P2 and P3 starting from the upstream side. At 43 GHz the highest polarized intensity is in P2, while P1 is the strongest polarized component at 86 GHz. At both frequencies the largest fractional polarization was in P3 (10–15%), while P1 was the smallest (4–7%). The observed positions of P2 and P3 are in good agreement in both 43 and 86 GHz images. For the innermost component P1, the peak position of the polarized flux is slightly offset between 43 and 86 GHz, in the sense that the polarized emission at 86 GHz can be seen closer to the core than that at 43 GHz. As described below, this is presumably due to the decrease of the Faraday depolarization effect at the higher frequency.
In terms of EVPA, we made use of the 43 GHz polarization image as a reference for our EVPA correction for the 86 GHz data. Here we assume that the EVPA of the outermost component P3 is stable with both time and frequency, and performed a nominal EVPA correction by matching the observed 86 GHz EVPA of P3 to that of the 43 GHz one. The EVPA map shown in the bottom-left panel of Figure 11 was produced through this procedure. As a result, one can see that the EVPA of P2 is also closely aligned between the two frequencies. This indicates that the absolute difference in rotation measure between P3 and P2 is relatively small.
On the other hand, the previous concurrent 43/86 GHz polarimetric VLBA study of this source suggested a large RM (2) for the inner jet at 0.8 mas from the core (Attridge et al., 2005). In fact, looking into our innermost component P1, we can find a notable difference in EVPA direction between the two frequencies, in contrast to the good EVPA alignment at P2 and P3. The observed EVPA difference in P1 between 43/86 GHz (in the assumption that the P3’s EVPAs are aligned between the two frequencies) is . This indicates that there is an absolute difference in RM between P3 and P1 of at least . This level of RM is very similar to that reported by Attridge et al. (2005). It seems that there is an additional (i.e., another 15∘) rotation of EVPA at the near-core side of P1 in the 86 GHz image. This implies the further increase of RM toward the core, which is consistent with the non-detection of polarized signal in the corresponding region at 43 GHz.
To estimate the absolute uncertainty of our EVPA correction procedure, it is necessary to know the absolute difference of P3’s EVPA between 43 and 86 GHz. Unfortunately this is difficult to derive from the present data alone. If P3 has a similar level of RM as seen toward P1, the EVPA distribution shown in the bottom-left panel of Figure 11 will have another rotation. However, this level of uncertainty should be regarded as an upper limit, and the actual uncertainty should be smaller than this value, since P3 is located further downstream and shows the higher fractional polarization than that of P1, favoring the less amount of Faraday screen toward P3. On the larger scales (i.e., from a few to 10 mas from the core), several authors reporte RM values of hundreds to a few thousands rad m-2 (e.g., Asada et al., 2002; Zavala & Taylor, 2005). Looking into the adjacent component P2, there is actually a slight () difference in EVPA between 43 and 86 GHz. This suggests an absolute difference in between P3 and P2 of , which is just in between the values for P1 and the outer jet in the literature. Therefore, we regard that a level of would be a reasonable measure of at P3, and thus a likely uncertainty of our 86 GHz EVPA correction relative to the 43 GHz data would be . In summary, adopting that the EVPA uncertainty of the Boston 43 GHz map is (Jorstad et al., 2005), we estimate that a potential total uncertainty of EVPA in our 3C 273’s 86 GHz images is a level of .
References
- Abramowski et al. (2012) Abramowski, A., Acero, F., Aharonian, F., et al. 2012, ApJ, 746, 151
- Acciari et al. (2009) Acciari, V. A., Aliu, E., Arlen, T., et al. 2009, Science, 325, 444
- Aharonian et al. (2006) Aharonian, F., Akhperjanian, A. G., Bazer-Bachi, A. R., et al. 2006, Science, 314, 1424
- Agudo et al. (2007) Agudo, I., Bach, U., Krichbaum, T. P., et al. 2007, A&A, 476, L17
- Akiyama et al. (2015) Akiyama, K., Lu, R.-S., Fish, V. L., et al. 2015, arXiv:1505.03545
- Asada et al. (2002) Asada, K., Inoue, M., Uchida, Y., et al. 2002, PASJ, 54, L39
- Asada & Nakamura (2012) Asada, N. & Nakamura, M. 2012, ApJ, 745, L28
- Attridge et al. (2005) Attridge, J. M., Wardle, J. F. C., & Homan, D. C. 2005, ApJ, 633, 85
- Begelman et al. (1984) Begelman, M. C., Blandford, R. D., & Rees, M. J. 1984, RvMP, 56, 255
- Begelman (1998) Begelman, M. C. 1998, ApJ, 493, 291
- Biretta et al. (1999) Biretta, J. A., Sparks, W, B., & Macchetto, F. 1999, ApJ, 520, 621
- Biretta et al. (2002) Biretta, J. A., Junor, W., & Livio, M. 2002, New. Astron. Rev., 46, 239
- Blakeslee et al. (2009) Blakeslee, J. P., Jordán, A., Mei, S., et al. 2009, ApJ, 694, 556
- Blandford & Rees (1974) Blandford, R. D., & Rees, M. J. 1974, MNRAS, 169, 395
- Blandford & Königl (1979) Blandford, R. D., & Königl, A. 1979, ApJ, 232, 34
- Blandford & Znajek (1977) Blandford, R. D., & Znajek, R. L. 1977, MNRAS, 179, 433
- Blandford & Payne (1982) Blandford, R. D., & Payne, D. G. 1982, MNRAS, 199, 883
- Blandford & Begelman (1999) Blandford, R. D., & Begelman, M. C. 1999, MNRAS, 303, L1
- Boccardi et al. (2015) Boccardi, B., Krichbaum, T., Bach, U., et al. 2015, arXiv:1504.01272
- Broderick & Loeb (2009) Broderick, A. E, & Loeb, A. 2009, ApJ, 697, 1164
- Burn (1966) Burn, B. J. 1966, MNRAS, 133, 67
- Casadio et al. (2015) Casadio, C., G omez, J.-L., Grandi, P., et al. 2015, arXiv:1505.03871
- Chen et al. (2011) Chen, Y. J., Zhao, G.-Y., & Shen, Z.-Q. 2011, MNRAS, 416, L109
- Curtis (1918) Curtis, H. D. 1918, Publications of Lick Observatory, 13, 31
- Clausen-Brown et al. (2011) Clausen-Brown, E., Lyutikov, M., & Kharb, P. 2011, MNRAS, 415, 2081
- Daly & Marscher (1988) Daly, R. A., & Marscher, A. P. 1988, ApJ, 334, 539
- Deller et al. (2011) Deller, A. T., Brisken, W. F., Phillips, C. J., et al. 2011, PASP, 123, 275
- Di Matteo et al. (2003) Di Matteo, T., Allen, S. W., Fabien, A. C., & Wilson, A. S. 2003, ApJ, 582, 133
- Doeleman et al. (2012) Doeleman, S. S., Fish, V. L., Schenck, D. E., et al. 2012, Science, 338, 355
- Dodson et al. (2006) Dodson, R., Edwards, P. G., & Hirabayashi, H. 2012, PASJ, 58, 243
- Fish et al. (2013) Fish, V., Alef, W., Anderson, J., et al. 2013, arXiv:1309.3519
- Fomalont (1999) Fomalont, E. B. 1999, in ASP Conf. Ser. 180, Synthesis Imaging in Radio Astronomy II, A Collection of Lectures from the Sixth NRAO/NMIMT Synthesis Imaging Summer School, ed. G. B. Taylor, C. L. Carilli, and R. A. Perley (San Francisco, CA: ASP), 301
- Ford et al. (1994) Ford, H. C., Harms, R. J., Tsvetanov, Z. I., et al. 1994, ApJ, 435, 27
- Gebhardt & Thomas (2009) Gebhardt, K., & Thomas, J. 2009, ApJ, 700, 1690
- Gebhardt et al. (2011) Gebhardt, K., Adams, J., Richstone, D., Lauer, T. R., Faber, S. M., 2011, ApJ, 729, 119
- Ghisellini et al. (2005) Ghisellini, G., Tavecchio, F., & Chiaberge, M. 2005, A&A, 432, 401
- Giannios et al. (2010) Giannios, D., Uzdensky, D. A., & Begelman, M. C. 2010, MNRAS, 402, 1649
- Giroletti et al. (2008) Giroletti, M., Giovannini, G., Cotton, W. D., et al. 2008, A&A, 488, 905
- Giroletti et al. (2012) Giroletti, M., Hada, K., Giovannini, G., et al. 2012, A&A, 538, L10
- Gómez et al. (1997) Gómez, J.-L., Martí, J. M., Marscher, A. P., Ibáñez, J. M., & Alberdi, A. 1997, ApJ, 482, L33
- Gómez et al. (2000) Gómez, J.-L., Marscher, A. P., Alberdi, A., Jorstad, S. G., & García-Miró, C., 2000, Science, 289, 2317
- Gómez et al. (2001) Gómez, J.-L., Marscher, A. P., Alberdi, A., Jorstad, S. G., & Agudo, I., 2001, ApJ, 561, L161
- Gopal-Krishna et al. (2007) Gopal-Krishna, Dhurde, S., Sircar, P., & Wiita, P. J. 2007, MNRAS, 377, 446
- Hada et al. (2011) Hada, K., Doi, A., Kino, M., et al. 2011, Nature, 477, 185 (H11)
- Hada et al. (2012) Hada, K., Kino, M., Nagai, H., et al. 2012, ApJ, 760, 52
- Hada et al. (2013) Hada, K., Kino, M., Doi, A., et al. 2013, ApJ, 775, 70
- Hada et al. (2014) Hada, K., Giroletti, M., Kino, M., et al. 2014, ApJ, 788, 165
- Hada et al. (2015) Hada, K., Giroletti, M., Giovannini, G., et al. 2015, arXiv:1504.01808
- Harms et al. (1994) Harms, R. J., Ford, H. C, Tsvetanov, Z. I., et al. 1994, ApJ, 435, 35
- Harris et al. (2006) Harris, D. E., Cheung C. C., Biretta, J. A., et al. 2006, ApJ, 640, 211
- Hirabayashi et al. (1998) Hirabayashi, H., Hirosawa, H., Kobayashi, H., et al. 1998, Science, 281, 1825
- Hodgson et al. (2015) Hodgson, J. A., Krichbaum, T. P., Marscher, A. P., et al. 2015, arXiv:1504.03136
- Honma et al. (2014) Honma, M., Akiyama, K., Uemura, M., & Ikeda, S. 2014, PASJ, 66, 95
- Hughes et al. (2010) Hughes, D., Jáuregui Correa, J.-C., Schloerb, F. P., et al. 2010, Proc. SPIE, 7733, 31
- Jorstad et al. (2005) Jorstad, S. G., Marscher, A. P., Lister, M. L., et al. 2005, 130, 1418
- Junor et al. (1999) Junor, W., Biretta, J. A., & Livio, M. 1999, Nature, 401, 891
- Junor et al. (2001) Junor, W., Biretta, J. A., & Wardle, J. F. C. 2001, in IAU Symp. 205, Galaxies and their Constituents at the Highest Angular Resolutions, ed. R. T. Schilizzi (San Francisco, CA: ASP), 136
- Kardashev et al. (2013) Kardashev, N. S., Khartov, V. V., Abramov, V. V., et al. 2013, ARep, 57, 153
- Kino et al. (2014) Kino, M., Takahara, F., Hada, K., & Doi, A. 2014, ApJ, 786, 5
- Kino et al. (2015) Kino, M., Takahara, F., Hada, K., et al. 2015, ApJ, 803, 30
- Kohler et al. (2012) Kohler, S., Begelman, M. C., & Beckwith, K. 2012, MNRAS, 422, 2282
- Komissarov et al. (1997) Komissarov, S. S., & Falle, S. A. E. G. 1997, MNRAS, 288, 833
- Komissarov et al. (2007) Komissarov, S. S., Barkov, M. V., Vlahakis, N., & Königl, A. 2007, MNRAS, 380, 51
- Komissarov et al. (2009) Komissarov, S. S., Vlahakis, N., Königl, A., & Barkov, M. V. 2009, MNRAS, 394, 1182
- Königl (1981) Königl, A. 1981, ApJ, 243, 700
- Kovalev et al. (2007) Kovalev, Y. Y., Lister, M. L., Homan, D. C, & Kellermann, K. I. 2007, ApJ, 668, L27
- Koyama et al. (2015) Koyama, S., Kino, M., Giroletti, M., et al. 2015, arXiv:1505.04433
- Krichbaum et al. (2006) Krichbaum, T. P., Graham, D. A., Bremer, M., et al. 2006, JPhCS, 54, 328
- Kuo et al. (2014) Kuo, C. Y., Asada, K., Rao, R., et al. 2014, ApJL, 783, L33
- Laing (1980) Laing, R. A. 1980, MNRAS, 193, 439
- Lee et al. (2008) Lee, S.-S., Lobanov, A. P., Krichbaum, T. P., et al. 2008, A&A, 136, 159
- Lenain et al. (2008) Lenain, J.-P., Boisson, C., Sol, H., & Katarzyński, K. 2008, A&A, 478, 111
- Leppänen et al. (1995) Leppänen, K. J., Zensus, J. A., & Diamond, P. J. 1995, AJ, 110, 2479
- Lobanov & Zensus (2001) Lobanov, A. P., & Zensus, J. A. 2001, Science, 294, 128
- Ly et al. (2004) Ly, C., Walker, R. C., & Wrobel, J. M. 2004, AJ, 127, 119
- Ly et al. (2007) Ly, C., Walker, R. C., & Junor, W. 2007, ApJ, 660, 200
- Macchetto et al. (1997) Macchetto, F., Marconi, A., Axon, D. J., et al. 1997, ApJ, 489, 579
- Martí-Vidal et al. (2012) Martí-Vidal, I., Krichbaum, T. P., Marscher, A., et al. 2012, A&A, 542, A107
- Matsumoto et al. (2012) Matsumoto, J., Masada, Y., & Shibata, K. 2012, ApJ, 751, 140
- McKinney (2006) McKinney, J. C. 2006, MNRAS, 368, 1561
- McKinney & Narayan (2007) McKinney, J. C., & Narayan, R. 2007, MNRAS, 375, 513
- McKinney & Blandford (2009) McKinney, J. C., & Blandford, R. 2009, MNRAS, 394, L126
- McKinney et al. (2012) McKinney, J. C., Tchekhovskoy, A., & Blandford, R. 2012, MNRAS, 423, 3083
- Mizuno et al. (2015) Mizuno, Y., Gomez, J.-L., Nishikawa, K., et al. 2015, arXiv:1505.00933
- Molina et al. (2014) Molina, S. N., Agudo, I., Gómez, J. L., et al. 2014, A&A, 566, 26
- Morsony et al. (2007) Morsony, B. J., Lazzati, D., & Begelman, M. C. 2007, ApJ, 665, 569
- Nagai et al. (2014) Nagai, H., Haga, T., Giovannini, G., et al. 2014, ApJ, 785, 53
- Nakamura et al. (2006) Nakamura, M., Li, H., & Li, S. 2006, ApJ, 652, 1059
- Nakamura & Asada (2013) Nakamura, M., & Asada, K. 2013, ApJ, 775, 118
- Narayan & Yi (1994) Narayan R, & Yi I. 1994, ApJ, 428, L13
- Narayan & Yi (1995) Narayan R, & Yi I. 1995. ApJ, 444, 231
- Owen et al. (1989) Owen, F. N., Hardee, P. E., & Cornwell, T. J. 1989, ApJ, 340, 698
- Perlman et al. (1999) Perlman, E. S., Biretta, J. A., Zhou, F., Sparks, W. B., & Macchetto, F. D. 1999, AJ, 117, 2185
- Perlman et al. (2001) Perlman, E. S., Biretta, J. A., Sparks, W. B., Macchetto, F. D., & Leahy, J. P. 2001, ApJ, 551, 206
- Perlman et al. (2011) Perlman, E. S., Adams, S. C., Cara, M., et al. 2011, ApJ, 743, 119
- Quataert & Gruzinov (2000) Quataert, E., & Gruzinov, A. 2000, ApJ, 539, 809
- Reynolds et al. (1996) Reynolds, C. S., Fabian, A. C., Celotti, A., & Rees, M. J. 1996, MNRAS, 283, 873
- Rioja & Dodson (2011) Rioja, M., & Dodson, R. 2011, AJ, 141, 114
- Roberts et al. (1994) Roberts, D. H., Wardle, J. F. C., & Brown, L. F. 1994, ApJ, 427, 718
- Shepherd et al. (1994) Shepherd, M. C., Pearson, T. J., & Taylor, G. B. 1994, BAAS, 26, 987
- Stawarz & Ostrowski (2002) Stawarz, Ł., & Ostrowski, M. 2002, ApJ, 578, 763
- Tchekhovskoy et al. (2011) Tchekhovskoy, A., Narayan, R., & McKinney, J. C. 2011, MNRAS, 418, L79
- Walker et al. (2008) Walker, R. C., Ly, C., Junor, W., & Hardee, P. J. 2008, JPhCS, 131, 012053
- Walsh et al. (2013) Walsh, J. L., Barth, A. J., Ho, L. C., & Sarzi, M. 2013, ApJ, 770, 86
- Yuan et al. (2012) Yuan, F., Wu, M., & Bu, D. 2012, ApJ, 761, 129
- Yuan & Narayan (2014) Yuan, F., & Narayan, R. 2014, ARA&A, 52, 529
- Zakamska et al. (2008) Zakamska, N. L., Begelman, M. C., & Blandford, R. D. 2008, ApJ, 679, 990
- Zavala & Taylor (2002) Zavala, R. T., & Taylor, G. B. 2002, ApJ, 566, L9
- Zavala & Taylor (2005) Zavala, R. T., & Taylor, G. B. 2005, ApJ, 626, L73