The scaling properties of dynamical fluctuations in temporal networks
Abstract
The factorial moments analyses are performed to study the scaling properties of the dynamical fluctuations of contacts and nodes in temporal networks based on empirical data sets. The intermittent behaviors are observed in the fluctuations for all orders of the moments. It indicates that the interaction has self-similarity structure in time interval and the fluctuations are not purely random but dynamical and correlated. The scaling exponents for contacts in Prostitution data and nodes in Conference data are very close to that for 2D Ising model undergoing a second-order phase transition.
I Introduction
Interactions in complex systems are not static but change over time, which can be modelled in terms of temporal networks Holme2012 . Temporal network consists of a set of contacts , emphasizing on the time when node and have a connection. The addition of time dimension provides a new sight into the framework of complex network theory. In temporal networks, both structural properties and spreading dynamics crucially depend on the time-ordering of links.
The research of temporal networks has attracted great attention and it mainly focuses on two major aspects from the point view of time dimension. One is corresponding to the strategy of time aggregation especially when the topological characteristics are more relevant than the temporal properties. The topological structure of temporal network is achieved through aggregating contacts over a certain time interval and the temporal network is then represented as a series of snapshots of static graphs. Consequently, many existing concepts and tools of static graphs can be adopted to analyze temporal networks, since it is usually easier to analyze static networks. For example, the degree of a node is described as the number of links that it has to other nodes within the time window . The error and attack strategies in static networks have been applied to evaluate the temporal vulnerability Trajanovski , and so on. In order to understand the structure of temporal networks, it plays a crucial role to choose an optimal time interval to construct static graphs from temporal networks. Krings et al. studied the influences of time intervals when aggregating the mobile phone network over time Krings . Holme analyzed three ways of constructing static snapshots from temporal networks Holme2013 , but no candidate weighing out as a best choice. It is now still an open question on how to choose the time interval to represent temporal networks.
The other aspect is related to using dynamical processes to probe into the influence of time series on temporal network. We should take into account the time-ordering of each contact and the inter-event time between two consecutive contacts. The inter-event time distribution in temporal network follows a power-law, which is also called burstiness Barabasi2005 . Although it is recognized that time-ordering and bursty characters have strong influences on the dynamical processes of temporal networks, numerous studies have appeared to arrive at contradictory results. Lambiotte et al. had stressed that time-ordering and burstiness of contacts were critical in spreading process, which leaded to slow down spreading Lambiotte . In the work of Rocha et al, they concluded that temporal correlations accelerated outbreaks Rocha2011 in SI and SIR model. Miritello et al. demonstrated that bursts hindered propagation at large scales, but group conversations favored local rapid cascades Miritello .
Despite the promoting results in temporal networks, this field is still in its early stages about how temporal effect and topological structure interplay and hence affect the dynamical process. In this paper, based on empirical data sets, we will investigate the scaling properties of the dynamical fluctuations of contacts and nodes in temporal networks by using the factorial moments. We are aiming at extracting the fundamental properties from the large amount of data and revealing the influences of time effects on temporal networks from a new perspective.
The rest of the paper is organized as follows. Section II briefly introduces the method of factorial moments. In Section III we give a brief description of the data sets and present the corresponding results, especially the scaling properties of fluctuations for contacts and nodes in the empirical data sets. Conclusions are offered in the final section.
II Method of factorial moments
Temporal network consists of a sequence of contacts , representing that node and node has a contact at time . The number of contacts characterizes the frequency that individuals are connected with each other and the number of nodes describe the activeness that individuals are involved. In this paper, factorial moments will be used to study the dynamical fluctuations of contacts and nodes in temporal networks and the scaling properties of those fluctuations in the system.
Factorial moments are originally introduced in nuclear physics to study the multiplicity fluctuation of hadrons produced during the high energy collisionsBialas1986 . The fluctuations and correlations in multiplicity distributions provide a general and sensitive method to characterize the dynamical interactions. Here we will focus on the multiplicity of contacts and nodes in temporal networks. Consider the time series of contacts (or nodes) , where is the time that contacts happen and ranges from 0 to . We divide the whole time range into equal bins (the remainders are discarded). So the time interval in each bin is . Within each bin window (), denote the number of contacts (or nodes) as . Of course, fluctuates for different bin windows. To measure the fluctuations and correlations, the order factorial moment is introduced as,
| (1) |
In factorial moments, is the mean number of contacts (or nodes) under a certain bin size, averaged over all the bins . Note that must be greater than in order to contribute to , and is usually an integer. As increases, is decreased and the average multiplicity in a bin decreases. This may lead to which is not allowed. Thus high corresponds to higher in the bin under consideration, i.e., large fluctuations from Hwa1998 .
Normalized factorial moments are more generally used,
| (2) |
It can be proved that can filter out the statistical fluctuations. The method of factorial moments has been applied to analyze different complex systems, such as multiplicity of produced hadrons Chunbin1998 , human electroencephalogram and gait series in biology Hwa2002 ; Yang2002 , financial price series Schoeffel , critical fluctuations in Bak-Sneppen model Xiao , spectra analysis of complex networks Yang2005 , to name a few. Specially it indicates that the fluctuations in the system have self-similarity when has a power-law dependence on the bin size .
| (3) |
This phenomenon is referred to as the intermittency. Intermittency basically means random deviations from smooth or regular behavior. Intermittent behavior is expected in a variety of statistical systems at the phase transition point of the second-order type. Hence the existence of intermittency suggests that the fluctuations are not purely Poisson distribution, but the indication of dynamical processes in the fluctuations.
III Results and discussions
In this paper the factorial moments analyses are performed to uncover the scaling properties of the fluctuations in temporal networks based on the following two empirical data sets.
-
Prostitution: The data set consists of sexual contacts between sex buyers and sellers from a Brazilian web forum Rocha2010 . The time resolution is 1 day and the whole time range is days.
-
Conference: The data set was collected at a 3-day conference from face-to-face interactions between conference participants. A contact is recorded every 20-second intervals if two individuals are within range of 1.5m Isella . The whole time range is seconds.
We now divide the whole time range into bins and count the number of contacts and nodes in each bin window. Calculate and according to Eq. (1) and (2), respectively. It is noticed that is averaged over all bins (known as the horizontal average).
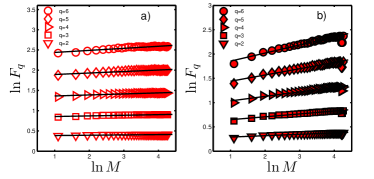
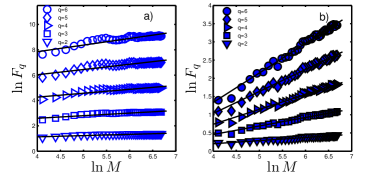
Figure 1 presents the log-log plot of as a function of for contacts (open circles) and nodes (filled circles) in Prostitution data. With ranging from about 3 to 60 bins, it means that the time interval extends approximately from 30 to 750 days. We find that increases linearly with for both contacts and nodes by varying from 2 to 6. The slopes of nodes are a little larger than that of contacts. The same phenomena have also been observed in Conference data in Fig. 2.
The increase of bin size means that the fluctuations of arbitrary sizes can appear in the system, and consequently leading to the growth of factorial moment with . The scaling relationship between and , , indicates the existence of intermittency. As stated in Ref. Schoeffel , for uncorrelated Poissonian or Gaussian distributions, for all orders ; whereas for correlated contacts or nodes distributions, should increase with the growth of bin size . Hence the intermittent behavior implies that the fluctuations of contacts and nodes in both Prostitution and Conference data have self-similar structures and the fluctuations are not random Poisson distribution but have dynamical and correlated behaviors inside.
Further investigations have been performed on and . The scaling between and is more general than intermittency, which could be true even under the condition that intermittency does not exist.
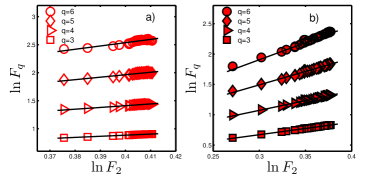
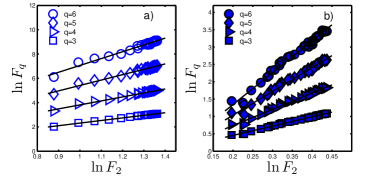
We plot as a function of on the log-log scale for Prostitution and Conference data sets in Fig. 3 and 4, respectively. The scaling relationship between and can be clearly observed in both figures.
| (4) |
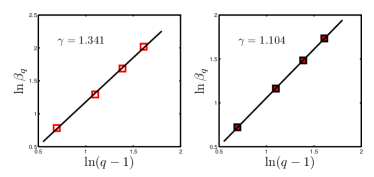
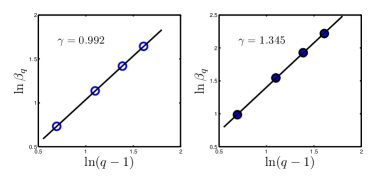
where for the case of intermittency. We are interested more in the dependence of on . The plot of as a function of is presented on a log-log scale in Fig. 5 for Prostitution data and in Fig. 6 for Conference data. There is a remarkably linear relationship between and for all . Now one has
| (5) |
The linear fits are also plotted in the figures. In Prostitution data, are 1.341 for contacts and 1.104 for nodes. In Conference data are 0.992 and 1.345 for contacts and nodes, respectively. It should be recognized that the power-law relationship in Eq. (5) implies that the exponents are independent of bin size . It suggests a common feature of scaling invariance in temporal networks.
It is known that is approximately 1.3 for 2D Ising model undergoing a second-order phase transition HwaPRL . The exponents of contacts in Prostitution data and of nodes in Conference data are very close to this value.
IV Conclusions
The factorial moments analyses are performed to study the scaling properties for fluctuations of contacts and nodes in temporal networks based on empirical data sets. The phenomena of intermittency have been observed for all orders in the fluctuations of contacts and nodes for both Prostitution and Conference data sets. The result indicates that the system has self-similar structure and the fluctuations are not purely random, but have dynamical and correlated behaviors embedded in the system. A more general scaling relationship between and has also been presented, . We further find that scales with as . The exponents for nodes in the Prostitution data and for contacts in the Conference data are very close to that for 2D Ising model. The other exponents are not.
Still, there are some issues to be addressed. First, what is the driving mechanism(s) behind these scaling properties of fluctuations in temporal networks? Second, why are some scaling exponents close to that of Ginzburg-Landau second-order phase transition? Are they belong to the same universal class? All these topics cannot be covered in this paper and will be discussed later.
The scaling invariances of fluctuations shed light on the temporal correlations of contact series and provide a new sight into understanding the influence of time dimension in temporal networks.
Acknowledgments
We are grateful to Professor Petter Holme for providing the data. This work was supported in part by the programme of Introducing Talents of Discipline to Universities under No. B08033, and by the self-determined research funds of CCNU from the colleges’ basic research and operation of MOE under No. CCNU2015A05046.
References
- [1] P. Holme and Jari Saramäki, “Temporal networks,” Physics Reports, vol.519, 97, 2012.
- [2] S. Trajanovski, S. Scellato and I. Leontiadis, “Error and attack vulnerability of temporal networks,” Phys. Rev. E, vol.85, 066105, 2012.
- [3] Krings G, Karsai M, Bernhardsson S, et al,“Effects of time window size and placement on the structure of an aggregated communication network,” EPJ Data Science vol.1, 1, 2012.
- [4] Holme P, “Epidemiologically optimal static networks from temporal network data,” PLoS computational biology vol.9, e1003142, 2013.
- [5] A.-L. Barabási, “The origin of bursts and heavy tails in human dynamics,” Nature, vol.435, 207, 2005.
- [6] R. Lambiotte and L. Tabourier, “Burstiness and spreading on temporal networks,” Eur. Phys. J. B, vol.86, 320, 2013.
- [7] L.E.C. Rocha, F. Liljeros, P. Holme, “Simulated epidemics in an empirical spatiotemporal network of 50185 sexual contacts,” PLoS computational biology, vol.7, e1001109, 2011.
- [8] G. Miritello, E. Moro and R. Lara, “Dynamical strength of social ties in information spreading,” Phys. Rev. E, vol. 83, 045102, 2011.
- [9] A. Bialas and R. Peschanski, “Moments of rapidity distributions as a measure of short-range fluctuations in high-energy collisions,” Nucl. Phys. B, vol.273, 703, 1986; A. Bialas and R. Peschanski, “Moments of rapidity distributions as a measure of short-range fluctuations in high-energy collisions,” Phys. Lett. B, vol.207, 59, 1988.
- [10] R.C. Hwa, “Universal behavior of multiplicity differences in the quark-hadron phase transition,” Phys. Rev. D, vol.57, 1831, 1998.
- [11] C.B. Yang and X. Cai, “Analytical investigation for multiplicity difference correlators under quark-gluon plasma phase transition,” Phys. Rev. C, vol.57, 2049, 1998.
- [12] R.C. Hwa and T.C. Ferree,“Scaling properties of fluctuations in human electroencephalogram,” Phys. Rev. E, vol.66, 021901, 2002.
- [13] Huijie Yang, Fangcui Zhao, Yizhong Zhuo, Xizhen Wu and Zhuxia Li, “Investigation on gait time series by means of factorial moments,” Physica A, vol.312, 23, 2002.
- [14] L. Schoeffel, “Factorial moments in complex systems,” arXiv:1108.5946v1, Available at SSRN: http://ssrn.com/abstract=1955253.
- [15] Fangcui Zhao, Huijie Yang and Binghong Wang, “Scaling invariance in spectra of complex networks: A diffusion factorial moment approach,” Phys. Rev. E, vol.72, 046119, 2005.
- [16] L.E.C. Rocha, F. Liljeros, P. Holme, “Information dynamics shape the sexual networks of internet-mediated prosititution,” Proc. Natl. Acad. Sci., vol.107, 5706, 2010.
- [17] L. Isella, J. Stehlé, A. Barrat, C. Cattu, J.F. Pinton and W. van den Broeck, “What’s in a crowd? Analysis of face-to-face behavioral networks,” J. Theor. Biol., vol.271, 166, 2011.
- [18] S.S. Xiao and C.B. Yang, “Critical fluctuations in the Bak-Sneppen model,” Eur. Phys. J. B, vol.85, 154, 2012.
- [19] R.C. Hwa and M.T. Nazariv, “Intermittency in Second-Order phase transitions,” Phys. Rev. Lett., vol.69, 741, 1992; R.C. Hwa and J. Pan, “Intermittency in the Ginzburg-Landau theory,” Phys. Lett. B, vol.297, 35, 1992.