Spectral and timing evolution of the bright failed outburst of the transient black hole Swift J174510.8–262411
Abstract
We studied time variability and spectral evolution of the Galactic black hole transient Swift J174510.8–262411 during the first phase of its outburst. INTEGRAL and Swift observations collected from 2012 September 16 until October 30 have been used. The total squared fractional rms values did not drop below 5% and QPOs, when present, were type-C, indicating that the source never made the transition to the soft-intermediate state. Even though the source was very bright (up to 1 Crab in hard X-rays), it showed a so called failed outburst as it never reached the soft state. XRT and IBIS broad band spectra, well represented by a hybrid thermal/non-thermal Comptonisation model, showed physical parameters characteristic of the hard and intermediate states. In particular, the derived temperature of the geometrically thin disc black body was about 0.6 keV at maximum. We found a clear decline of the optical depth of the corona electrons (close to values of 0.1), as well as of the total compactness ratio . The hard-to-hard/intermediate state spectral transition is mainly driven by the increase in the soft photon flux in the corona, rather than small variations of the electron heating. This, associated with the increasing of the disc temperature, is consistent with a disc moving towards the compact object scenario, i.e. the truncated-disc model. Moreover, this scenario is consistent with the decreasing fractional squared rms and increasing of the noise and QPO frequency. In our final group of observations, we found that the contribution from the non-thermal Comptonisation to the total power supplied to the plasma is and that the thermal electrons cool to kT keV.
keywords:
Gamma-rays: general – accretion, accretion discs – black hole physics – radiation mechanisms: non-thermal – X-rays: binaries – stars: individual: Swift J174510.8-2624111 Introduction
Galactic black-hole binaries (BHB) emit strong X/-ray radiation when accreting matter from the stellar companion. Most of them are transients, i.e. they spend most of the time in a dim, quiescent state, displaying X-ray luminosities as low as L erg s-1, spaced out by episodic outbursts during which the sources show X-ray luminosities of L erg s-1. Based on the different X/-ray spectral properties, BHBs are known to show different spectral states over their outbursts (Zdziarski & Gierkiński, 2004; McClintock & Remillard, 2006). Usually, the spectral variability is interpreted as being due to changes in the geometry of the central parts of the accretion flow (Zdziarski, 2000; Done et al., 2007).
At the beginning of the outburst, these sources are in the hard state (HS) with the spectrum roughly described
by a dominant cut-off power-law (typically, photon index 1.5 and high energy cut-off 100 keV)
and (often) a faint soft thermal component with a black-body temperature kT 0.3 keV ascribed to the emission from an
accretion disk truncated at large distances from the central BH (100 km; Done et al. 2007).
The hard X-ray emission in the HS is believed to originate from thermal Comptonisation of soft disc-photons
in a hot electron cloud (Eardley et al., 1975; Sunyaev & Titarchuck, 1980).
Thanks to the large area of the RXTE satellite, it was observed that the spectral states are related to the timing properties (Homan & Belloni, 2005; Belloni, 2011).
The power density spectrum (PDS) of sources in the hard state can be decomposed into a number of broad
Lorentzian components and sometime with type-C quasi periodic oscillations (QPO).
The type-C QPOs are characterised by a strong (up to 16% rms), narrow (7–12), and variable peak frequency. A subharmonic
and a second harmonic peak are sometime seen (Casella et al., 2005; Wijnands et al., 1999).
Strong band-limited noise components with rms values of about 30% are observed
and the radio emission indicates the presence of a steady compact jet (Fender, 2001).

As the outburst progresses, the X-ray and radio luminosities both increase, but the X-ray colour of the spectrum remains hard (Corbel, 2005).
Then, the transient BHB evolves into an intermediate state at an almost constant flux level
with spectral parameters in between the two main states. The disc black-body shows typical temperatures of kT 0.3-0.5 keV,
while the hard X-ray spectra are usually explained with the hybrid thermal/non-thermal Comptonisation (e.g. Zdziarski et al. 2004; Done et al. 2007; Del Santo et al. 2008).
Based on quite complex timing characteristics, Homan & Belloni (2005) identified two different intermediate states, namely the HIMS and the soft-intermediate state (SIMS).
Despite slight spectral softening, the PDS before and after the HIMS-to-SIMS transition showed significant differences:
from rms values about 10-20% and strong type-C QPOs to much weaker noise (a few %) and (possibly) type-B QPOs
(see Belloni 2011 for a recent review).
However, based on the X/-ray spectra of BHBs, a firm separation between HIMS and SIMS cannot be established
since this transition can display different properties in different outbursts (Del Santo et al., 2008, 2009).
Thereafter, most BHBs reach the second main state, namely soft state (SS), which is characterised by a thermal component, i.e. the multi-color black-body emission
from an accretion disc (Shakura & Sunyaev, 1973)
peaking at a few keV and much softer high energy power law () (Zdziarski, 2000).
In the framework of the truncated-disc model, in the SS, the geometrically thin accretion disc is believed to extend down to the innermost stable circular orbit
(ISCO)111Note however that a number of papers report on discs remaining at the ISCO in hard state (Miller et al., 2006; Reis et al., 2010; Reynolds et al., 2010; Miller et al., 2012).
and it is the source of soft seed photons for non-thermal Comptonisation in small active coronal regions located above and below the disc (Zdziarski & Gierkiński, 2004).
In this state, the variability is in the form of a weak (down to 1% fractional rms) steep component. Very weak QPOs are sometimes detected in the
10-30 Hz range (Belloni, 2010).
When the flux starts to decrease a reverse transition occurs until the source is back to the HS then to quiescence.
| Group | Rev | Step | Obs | Sub-group | Start | End | |
|---|---|---|---|---|---|---|---|
| [ks] | |||||||
| A | 1212 | 30 | 5 | 6 | 2012-09-16T01:15:58 | 2012-09-17T05:34:09 | |
| B | 1213-1214 | 100 | 10 | 10 | 2012-09-18T17:34:10 | 2012-09-23T01:02:18 | |
| C | 1215 | 60 | 10 | 6 | 2012-09-24T17:07:31 | 2012-09-27T04:59:38 | |
| D | 1216-1224 | 248 | 48(∗) | 4 | 2012-09-28T09:28:38 | 2012-10-24T07:38:54 |
Despite the general pattern followed during most of the outbursts of transient BH binaries, a number of unusual outbursts, in which sources do not show soft states, have been observed. There are different types of these so called ”failed” outbursts: a number of sources never leave the HS during the outburst (Brocksopp et al., 2004), while others proceed to an intermediate state before returning to the hard state and quiescence (Capitanio et al., 2009; Ferrigno et al., 2012; Soleri et al., 2013). It is worth noting that some sources have undergone both canonical outbursts and failed outbursts (Sturner & Shrader, 2005). Since most of the failed outburst are under-luminous, the lack of soft-state transitions is possibly connected to a premature decrease of the mass accretion rate, as during the 2008 outburst of H1743–322 (Capitanio et al., 2009).
The X-ray source Swift J174510.8–262411 (hereafter SwJ1745) was discovered by the Burst Alert Telescope (BAT; Barthelmy et al. 2005) on board the Swift satellite on 2012 September 16 (Cummings et al., 2012). Almost simultaneously observed by the INTEGRAL satellite, SwJ1745 appeared immediately as a bright Galactic BHB, since the 20–40 keV flux increased from 63 mCrab up to 617 mCrab in one day (Vovk et al., 2012). Soon after a number of multi-wavelength campaigns, including Swift/XRT (Tomsick et al., 2012), were performed. Optical spectroscopy and photometry inferred an orbital period 21 h, a companion star with a spectral type later than A0 and a distance closer than 7 kpc (Munoz-Darias et al., 2013). Multi-frequency data from radio arrays showed that a discrete ejection event occurred for the first time in a ”failed” outburst (Curran et al. 2014; see radio flares indicated in Fig. 1). These events are expected in the intermediate state when the source crosses the ’jet-line’ (Fender et al. 2009 and ref. therein). As reported in Fender et al. (2009), the time coincidence of the crossing of the jet line and the HIMS-SIMS transition is not exact. However, in SwJ1745 the SIMS seems to be never reached.
In this paper we present spectral and timing results of two Target of Opportunity campaigns performed during the first part of the SwJ1745 outburst, i.e. 1 Ms with INTEGRAL (P.I.: T. Belloni) and a number of Swift/XRT pointings (P.I.s: M. Del Santo and B. Sbaruffatti), while the decay of the same outburst (beginning of 2013) is reported in Kalemci et al. (2014).
| Group | Rev | Obs | |
|---|---|---|---|
| [ks] | |||
| 1212 | 5 | ||
| 1213 | 13 | ||
| 1213-1215 | 17 | ||
| 1215-1224 | 81 |
2 Observations and data reduction
2.1 INTEGRAL
We have analysed the INTEGRAL (Winkler et al., 2003) data of SwJ1745 collected in the period 2012 September-October. The IBIS (Ubertini et al., 2003) data-set has been obtained selecting all observations including SwJ1745 in a partially coded field of view (FOV) of where the instrument response is well known. This resulted in 438 pointings (Science Window, SCW) from INTEGRAL revolution 1212 up to 1224. The INTEGRAL data analysis and reduction has been performed with the off-line analysis software, OSA v.10.1 (Goldwurm et al., 2003; Courvoisier et al., 2003). After the data reduction and correction (i.e. dead time), the total IBIS/ISGRI (Lebrun et al., 2003) effective observing time is roughly 650 ks. The IBIS/ISGRI light curve in the 20–40 keV and 40–80 keV bands and the related hardness ratio are shown in Fig. 1. Spectra by SCW (1.7–3.5 ks of duration) have been extracted in 62 channels from 20 keV up to 500 keV.
| Seq. # | Beginning of obs. | End of obs. | Exposure (s) | Average Rate (cps) | Inner extraction radius (pix) |
|---|---|---|---|---|---|
| 000 | 2012-09-16T09:37:11 | 2012-09-16T14:25:47 | 6502 | 18 | 0 |
| 002 | 2012-09-17T17:49:22 | 2012-09-17T19:32:17 | 996 | 93 | 1 |
| 003 | 2012-09-18T19:03:30 | 2012-09-18T22:18:50 | 990 | 131 | 1 |
| 005 | 2012-09-19T11:43:28 | 2012-09-19T16:21:57 | 982 | 152 | 1 |
| 006 | 2012-09-19T03:05:21 | 2012-09-19T05:18:15 | 976 | 158 | 1 |
| 007 | 2012-09-20T04:55:43 | 2012-09-20T05:09:58 | 833 | 171 | 1 |
| 008 | 2012-09-20T16:17:29 | 2012-09-20T16:34:58 | 1036 | 180 | 1 |
| 009 | 2012-09-24T04:59:09 | 2012-09-24T05:07:09 | 470 | 241 | 2 |
| 011 | 2012-09-25T00:12:25 | 2012-09-25T00:30:58 | 1096 | 268 | 2 |
| 012 | 2012-09-25T11:49:39 | 2012-09-25T12:05:58 | 966 | 312 | 3 |
| 013 | 2012-09-26T08:16:11 | 2012-09-26T08:36:58 | 1221 | 297 | 2 |
| 014 | 2012-09-27T07:02:45 | 2012-09-27T07:21:58 | 1140 | 359 | 3 |
| 015 | 2012-09-28T10:11:58 | 2012-09-28T10:16:58 | 278 | 363 | 3 |
| 016 | 2012-09-29T02:22:06 | 2012-09-29T02:38:58 | 993 | 352 | 3 |
| 017 | 2012-10-01T06:58:20 | 2012-10-01T07:14:58 | 969 | 384 | 3 |
| 018∗ | 2012-09-30T08:39:21 | 2012-09-30T08:56:58 | 103 | 477 | 4 |
| 019 | 2012-10-02T07:09:55 | 2012-10-02T07:28:58 | 1118 | 385 | 3 |
| 020 | 2012-10-03T07:14:03 | 2012-10-03T07:30:58 | 992 | 352 | 3 |
| 021 | 2012-10-04T08:45:34 | 2012-10-04T09:04:58 | 1143 | 360 | 3 |
| 022 | 2012-10-05T00:48:34 | 2012-10-05T01:03:58 | 901 | 398 | 3 |
| 023 | 2012-10-07T04:07:27 | 2012-10-07T04:21:57 | 857 | 412 | 4 |
| 024 | 2012-10-06T17:22:57 | 2012-10-06T18:34:21 | 972 | 390 | 3 |
| 025 | 2012-10-08T06:01:15 | 2012-10-08T06:17:55 | 973 | 367 | 3 |
| 026 | 2012-10-09T12:16:24 | 2012-10-09T12:31:58 | 913 | 360 | 3 |
| 027 | 2012-10-10T04:16:42 | 2012-10-10T04:32:58 | 968 | 353 | 3 |
| 029 | 2012-10-12T04:24:09 | 2012-10-12T04:39:58 | 939 | 311 | 3 |
| 030 | 2012-10-13T06:02:46 | 2012-10-13T06:19:58 | 1020 | 294 | 2 |
| 031 | 2012-10-14T01:17:47 | 2012-10-14T01:33:58 | 961 | 227 | 2 |
| 032 | 2012-10-15T02:57:15 | 2012-10-15T03:12:58 | 922 | 295 | 3 |
| 033 | 2012-10-16T01:24:17 | 2012-10-16T01:39:58 | 932 | 271 | 2 |
| 034 | 2012-10-17T04:39:41 | 2012-10-17T04:55:58 | 962 | 280 | 2 |
| 035 | 2012-10-22T08:04:47 | 2012-09-17T19:32:17 | 964 | 226 | 2 |
| 036 | 2012-10-21T11:14:04 | 2012-10-21T11:32:58 | 1110 | 292 | 2 |
| 037 | 2012-10-23T14:32:37 | 2012-10-23T14:47:57 | 915 | 268 | 2 |
| 038 | 2012-10-24T12:59:51 | 2012-10-24T13:14:58 | 899 | 319 | 3 |
| 039 | 2012-10-25T06:38:09 | 2012-10-25T06:53:58 | 923 | 276 | 2 |
| 040 | 2012-10-26T15:04:12 | 2012-10-26T15:20:57 | 980 | 339 | 3 |
| 041 | 2012-10-27T03:31:17 | 2012-10-27T03:46:58 | 920 | 301 | 2 |
| 042 | 2012-10-22T08:20:58 | 2012-10-28T02:13:58 | 983 | 291 | 2 |
| 043 | 2012-10-29T00:28:40 | 2012-10-29T00:42:58 | 845 | 269 | 2 |
| 045∗ | 2012-10-31T13:38:44 | 2012-10-31T13:55:58 | 1029 | 360 | 3 |


In order to increase the statistics, the 438 spectra were averaged as follows. First, based on the discontinuities in the observations we identified 3 groups (A, B and C, see Fig. 1, bottom); the last group (D) contains all observations (even those that were not continuous) of the last part of the outburst observed by INTEGRAL in 2012 (Fig. 1, bottom). Then, within each group, spectra have been averaged as reported in Tab. 1 resulting in 26 final spectra. Because of the low statistics the last sub-group, i.e. D4, includes 104 spectra instead of 48. Due to the known IBIS/ISGRI calibration issue related to the energy reconstruction, systematics of about 3-4% are required by the spectral fits to avoid large residuals at energy around 50 keV and 100 keV.
Quasi-simultaneous INTEGRAL/JEM-X (Lund et al., 2003) data have been analysed. Because of the smaller JEM-X FOV, the total number of analysed pointings is 116 (see Tab. 2). JEM-X2 spectra have been extracted in 32 channels. Although recommendation from the JEM-X calibration team is to use the energy range 5-22 keV, we fitted spectra from 6 keV up to 18 keV by adding systematics of 3% because of additional residuals appearing especially in bright and variable sources.
2.2 Swift
The Swift/XRT monitoring campaign of the outburst of SwJ1745 was performed mainly in Windowed Timing (WT) observing mode.
The XRT observations used for this paper were performed quasi-simultaneously with the INTEGRAL ToO campaign,
i.e. from September 16 to October 30, 2012 (see XRT count rate in Fig. 1). A journal of the observations is given in Table 3.
To obtain XRT spectra, data were processed using the FTOOLS software package distributed
inside HEASOFT (v6.16) and the related calibration files from the
NASA Calibration Database. We ran the task xrtpipeline applying
calibrations and standard filtering criteria.
Events with grades 0 were selected, in order
to reduce the effect of energy redistribution at low energies that is
known to affect XRT data for bright, heavily absorbed sources222see http://www.swift.ac.uk/analysis/xrt/digest_cal.php for details.
For the same reason spectral analysis was performed in the 1–10 keV energy band. Due to the high count rates, the data are
affected by pile-up starting with sequence 1. The pile-up correction for the WT data was performed following the same procedure
used by Romano et al. (2006), determining the size of the region to be excluded from the photon extraction studying the event grade distribution.
Source photons were thus extracted
from an annular region with an outer radius 30 pixels (1 pixel = 2”.36)
and an inner radius 0 to 4 pixel, depending on count rate (see Tab. 3).
According to the XRT calibration document333see http://heasarc.gsfc.nasa.gov/docs/heasarc/caldb/swift/docs/xrt/SWIFT-XRT-CALDB-09_v19.pdf, high signal-to-noise WT spectra typically show residuals of about 3% near the gold edge (2.2 keV) and the silicon edge (1.84 keV), and can be as high as 10%. We obtained good fits by including 3% of systematics in the XRT spectra and in a few cases (when the residuals around the edges were higher) we ignored the channels between 1.8 and 2.4 keV.
From each XRT observation we have extracted a light curve with 0.003532 s time resolution from a region 40 pixels wide centred on the source. For timing analysis, we produced Leahy-normalized Power Density Spectra (PDS) from 128 s segments and averaged them, obtaining one average PDS per observation. The power spectra cover the frequency range from 7.8125 mHz to 142 Hz. We subtracted the Poissonian noise contribution estimated as the mean power level above 20 Hz, where no source signal was seen. We converted the PDS to squared fractional rms (Belloni & Hasinger, 1990).


3 Spectral analysis with simple models
First of all, we fit separately the 26 IBIS/ISGRI spectra and the 39 XRT spectra by using simple models, such as cutoff power-law (Fig. 2) and an absorbed (tbabs in xspec) multicolor disc black-body (diskbb in xspec) plus a power law (Fig. 3), respectively. We used cross sections of Verner et al. (1996) and abundances of Wilms et al. (2000) for the interstellar absorption and left NH as a free parameter.
The power-law of the IBIS/ISGRI hard X-ray spectra (Fig. 2) steepens as the cut-off energy decreases in group A, until MJD 56188.
Then, starting from group B,
the cutoff starts to increase again until it stalls.
This behaviour of the cut-off during the BHB outbursts has been already observed in GX 339-4 by Motta et al. (2009).
However, cut-off power-law (cutoffpl in xspec) is an empirical model, which is only roughly related to the electron temperature of the Comptonising plasma.
In complex spectra, i.e. when additional components play a role (non-thermal Comptonisation, reflection),
the high energy cut-off does not reflect the evolution of the electron temperature of the corona.
Indeed, in Section 5, we present results by using a physical model, i.e. the hybrid Comptonisation model eqpair.
In Fig. 3, we show the evolution of the spectral parameters of the soft X-ray spectra.
While the disc black-body component is not needed in the first two spectra,
its addition improves considerably the spectral fit of the following spectra (from MJD 56188).
In spectrum #003 the F-test probability is 6.5.
The inner disc black-body temperature (kTin) varies between 0.4 and 0.7 keV, the power-law photon index steepens from 1.5 up to 2.2 and then it stays constant,
the NH varies roughly between 1.4 and 1.7 during this part of the outburst.
We note that the value of this parameter is significantly different than the one found by Kalemci et al. (2014) in the hard state during the outburst decay (2.2 cm-2).
Based on the XRT and ISGRI spectral behaviour, we conclude that the HS-to-HIMS spectral transition occurred during the gap (between A and B) in the INTEGRAL observations and since XRT pointing #003 (roughly at MJD 56188). This is also confirmed by the timing analysis (see Sec. 4).
4 Timing analysis results
Each PDS was fit with a zero-centered Lorentzian (see Belloni et al. 2002) and inspected for residuals. Then, PDSs were fitted with a zero-centered Lorentzian plus a QPO, also modeled as a Lorentzian (Fig. 4B). The starting frequency was based on the residuals, and the starting width was typically 0.05-0.1 Hz (the final best fit parameters do have some dependence on the starting parameters). In some cases, the QPO is not statistically significant (). If another noise peak (broad or narrow) appeared in the residuals, then we fit the PDS with a combination of three Lorenztians, one of which zero-centered (Fig. 4C and 4D). This procedure led to the detection of a single QPO peak in 20 observations and two QPO peaks in about ten observations, where the second peak is consistent with being the first overtone of the first peak. However, only in a few observations the second QPO seems to be significant (). A broad component in addition to the zero-centered Lorentzian plus a faint QPO is observed in the HS, pointing #000 (see Fig. 4A).
The evolution of the main timing parameters is plotted in Fig. 5 (left). The QPO centroid frequency increased as a function of time until MJD 56210, then it decreased again to become non detectable after MJD 56215. At the same time, the noise break frequency increased and the total fractional rms decreased. On the other hand, the QPO fractional rms increased until roughly MJD 56188 and then it decreased. This is consistent with a typical evolution of HS and then HIMS.
In the harder RXTE/PCA energy band (2–40 keV), Munoz-Darias et al. (2011a) found that below 5% total fractional rms GX 339-4 entered the SIMS. Here, no observation shows a value below 5%. Fig. 5 (right) shows the QPO centroid frequency as a function of total fractional rms, a good indicator to establish the QPO type (Motta et al., 2011). Comparing with Fig. 4 of Motta et al. (2011), it is clear that all QPOs observed here are of type C, indicating that at least until MJD 56214 the source was in the HIMS (QPO frequency and rms only for those observations where the first QPO was significant have been plotted) .
In order to relate the timing evolution with the spectral properties, we show the relation between the Swift/XRT power law spectral index and the total fractional rms (Fig. 6). The relation between these two parameters is, although noisy, roughly monotonic, without large outliers. Similar correlations have been reported in other sources both with spectral fit based parameters such as (Grinberg et al., 2014) or empirical measures for the spectral shape, such as hardness (Munoz-Darias et al., 2011b). The tight correlation between the total fractional rms and the QPO frequency (Fig. 5, right) implies a similar correlation between the QPO frequency and spectral shape. Overall, the timing parameters seem to trace the spectral behaviour, as expected in the canonical view of state evolution of BHBs.


5 Describing broad-band emission with hybrid Comptonisation models
The IBIS spectra have been combined (when possible) with the XRT quasi-simultaneous spectra and fit with eqpair, the hybrid thermal/non-thermal Comptonisation model developed by Coppi (1999). In eqpair, the emission of the disc/corona system is modelled by a spherical hot plasma cloud with continuous acceleration of electrons illuminated by soft photons emitted by the geometrically thin accretion disc. At high energy the distribution of Comptonising electrons is non-thermal, but at low energies a thermal population (Maxwellian) is established. The non-dimensional compactness parameter determines the properties of the plasma:
| (1) |
where is a power (luminosity) of the source supplied by different components, is the radius of the sphere, is the Thomson cross-section, is the electron mass and is the speed of light. The eqpair compactness parameters are: , , and , corresponding to the power in soft disc photons entering the plasma, thermal electron heating, electron acceleration and total power supplied to the plasma, respectively. The spectral shape strongly depends on the compactness ratios and and not on the single parameters. It is customary to fix (parameter in xspec) to some reasonable value when fitting data with eqpair (e. g. Gierliński et al. 1999; Del Santo et al. 2008). Indeed, as suggested by the developer of eqpair444see https://heasarc.gsfc.nasa.gov/xanadu/xspec/models/eqpap4.ps, for Galactic BHBs the best recourse may be simply to leave the soft photon compactness frozen at the unity. As a cross-check, we fit our spectra with =10 obtaining no variation in the spectral parameters. We definitely assumed =1 (see also Del Santo et al. 2013; Joinet et al. 2007; Malzac et al. 2006) which implies that the variations of the ratio is only due to changes in . However, we do not know if this is what really happens or if it is the which changes (there is no possibility to fix in xspec).
High values of (greater than 10) and () are usually measured in spectra of BH binaries in hard state (e. g. Ibragimov et al. 2005; Del Santo et al. 2013). Thus, spectra between A1 and A6 of SwJ1745 (Tab. 4, Fig. 7) show parameters typical of the HS, as also indicated by the timing features (see energy spectrum and PDS in Fig. 4, upper panel), while starting from group B1 to D4 typical parameters of the HIMS, i.e. of the order of the unity, are inferred (Tab. 4). Interestingly, the Thomson optical depth of the corona is continuously decreasing as the outburst evolves, dropping from values of about 2.5 at the beginning of the HS down to 0.1 in the HIMS. It is worth noting that this parameter is also very variable within the HIMS itself, possibly associated to the variation of the size of the emitting region (see Sec. 6).
Usually, the reflection component (parameter /) is faint (Zdziarski et al., 1999) or sometimes absent in hard state.
Such a signature appears stronger in the intermediate states and becomes very strong in soft states.
This is expected when the system evolves from a geometry where the reflecting disc
is truncated at a large distance from the black hole to a situation where the accretion disc is sandwiched by the illuminating corona (Done et al., 2007).
In the latest version of eqpair (v. 1.10), the code uses ireflct, a convolution model for reflection from ionised material according to Magdziarz & Zdziarski (1995),
and rdblur for rotational blurring.
In SwJ1745, this component appears in spectrum A3. Introducing the reflection component in the model to our spectra improves the fit significantly
(F-test probability= 2.3 ).
When the statistical quality of the spectrum was too low to constrain the reflection parameter, this was fixed at / (see Tab. 4).
As a disc model (internal to eqpair), we use an extension of the diskbb, i.e. a pseudo-newtonian disc (diskpn in xspec) including corrections for temperature distribution near the black hole. The seed photon temperature kTmax was frozen at 100 eV in the harder spectra (A1–A6). Then, from B1 to B4 and from B6 to B10, kTmax was fixed at 300 eV which is comparable with the value inferred from the B5-008 spectrum. According to the temperature obtained for spectra C1-011 and C2-012, we fixed kTmax at 400 eV in C3 and C4. Finally, from group C5-013 onwards, the disc black-body temperature increases up to eV.
The non-thermal electrons are injected with a power-law distribution , with Lorentz factors ranging from to . Because of the low statistics at high energy, it is not possible to give constraints to the parameter, so as expected from shock acceleration models, we fixed at 2.5.
Concerning the fraction of Comptonization by non-thermal electrons, we found an indication of non-negligible values of the parameter only in the spectra D1-016, D2-019 and D3-020. The fraction of electron acceleration to the total power supplied to the plasma is about 0.25 (see Sec. 5.1 for an extensive discussion).
We have also estimated the bolometric fluxes (0.1-1000 keV) for each sub-group, and the fluxes of the two main spectral components over the whole band, such as the geometrically thin disc black-body and the Comptonisation by the hybrid corona electrons (see Tab. 4).
5.1 Focussing on the non-thermal Comptonisation component
Despite the statistically acceptable fits obtained when fixing at 0 in spectra D1-016, D2-019 and D3-020, we have noted some residuals in the fits. In order to investigate further the possible presence of the non-thermal component during the HIMS, the spectrum D1-016 has been fit with the compPS model (assuming a spherical geometry) with Maxwellian electron distribution (Poutanen & Svensson, 1996). This resulted in a reduced of 1.07 (652 d.o.f.). Adding a power-law component with a slope of , the reduced definitely improved down to 0.95 (650 d.o.f.). The F-test probability that this improvement was by chance is . In addition, assuming a hybrid electron distribution in compPS, we obtained a =0.99(651). However, because of the low statistics at high energy, we did not manage to constrain the electron power-law index (). Similar results have been obtained for the two spectra D2-019 and D3-020.
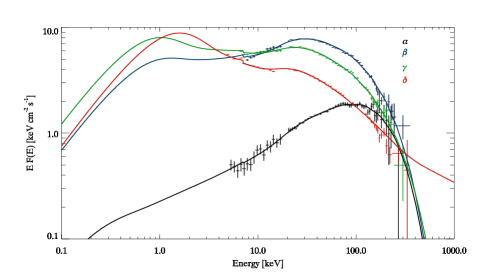
In order to better quantify the Comptonisation fraction by non-thermal electrons, we averaged the 26 IBIS spectra to increase the statistics at high energy (above 100 keV). We identified 4 bigger groups showing similar values of the parameter : A, B1–B5, B6–C2, C3–D4, namely , , , (see Fig. 1, bottom). We combined them with the JEM-X2 (quasi) simultaneous spectra (IBIS cross-normalization factor of about 0.9) and performed the fitting procedure with both eqpair and compPS (best-fit in Tab. 5). First, in eqpair we fixed for all spectra obtaining an unacceptable reduced of 4.72(49) by fitting the spectrum . In the latter, a fraction of electron acceleration to the total power supplied to the plasma of is required. In Fig. 8, the four JEM-X2–IBIS energy spectra and best-fit models are shown.
Then, we fitted the four JEM-X2/IBIS spectra with compPS in the case of a Maxwellian electron distribution. Also in this case, the fit of the last spectrum was unacceptable giving a reduced of 9.3(49). So that, assuming a hybrid thermal/non-thermal electron population also in compPS provides a good fit (see Tab. 5).
6 Discussion
During the SwJ1745 outburst, we have observed only the HS-to-HIMS transition which occurred most likely between MJD 56187.2 and MJD 56188.7 (in the gap between groups A and B, see Fig. 1) when the QPO rms started to decrease (see Fig. 5, left). We did not witness the SIMS, which is characterised by noise that is even weaker than we observe, i.e. below 5%. Even though the decreasing X-ray flux seems to indicate an evolution back to the hard state (see Kalemci et al. 2014), we cannot exclude that a secondary maximum (i.e. a transition to the soft state) occurred during the gap in INTEGRAL and Swift observations (2012 November-2013 January). This second peak in the X-ray light curve occurring several months after the first one has been observed in other transient BH binaries (Chen et al., 1993; Castro-Tirado et al., 1997). However, radio band observations strengthen the failed outburst hypothesis, since they indicate that the self-absorbed radio jets were never fully quenched (Curran et al., 2014).
A correlation between the timing and spectral parameters (i.e. total rms and power-law slope) obtained with the XRT data has been derived. The total fractional rms diminishes during a transition from hard to softer states for two reasons. The first reason is an increase of the amount of soft photons coming from an increasingly bright accretion disc in the energy band where the rms is measured (0.3-10 keV here). The disc photons are generally speaking not variable (but see Wilkinson & Uttley 2009) and therefore they dilute the variability carried by the harder photons, causing a general decrease of the fractional rms. The second reason is an intrinsic decrease of the variability of the hard photons. In the context of the truncated disc model and rigid precession of the inner flow (see e.g. Ingram et al. 2009, Motta et al. 2015), both the noise and the QPOs observed in the HS and in the HIMS are produced in the inner part of the accretion flow that precesses in a rigid fashion following the Lense-Thirring effect. The QPOs are produced via the modulation imprinted by the precession to the emission, while the noise, which carries most of the variability, is produced via propagation of mass accretion rate fluctuations in the same flow, fundamentally causing intrinsic brightness variability. The decrease of the outer radius of the inner flow (linked to the truncation radius of the disk) causes the loss of the variability at low frequencies as the source moves to softer states. This effect combines with a cooling of the inner hot flow, that is responsible for the decrease in the number of hard photons (both producing the noise and the QPOs), causing a further decrease of the total fractional variability.
Fitting the XRT/ISGRI spectra with a hybrid Comptonisation model (eqpair), we have observed a decreasing of the parameter during the outburst.
We do not know whether the variation is due to changes in the heating rate
of the corona (related to ), changes in the luminosity of the disc (), or both.
In SwJ1745, we observe a change of the coronal optical depth by a factor of 20 which could be associated either with a change in electron density
or in the size of the corona (since ).
A constant electron density () would imply that the corona is larger in the HS than in the HIMS by up to a factor of 20.
Looking at the flux variation (Fig. 7 and Tab. 4), it is clear that the bolometric flux increases in a few days and is mainly driven by the Comptonisation component.
Then, during the transition to the HIMS, the Comptonisation luminosity, which is related both to the electron heating and electron acceleration, varies by only a factor of 2,
while the disc flux increases by a factor of 10 or even more as the outburst proceeds.
This would imply that the HS-to-HIMS spectral transition is driven by changes in the soft photon flux in the corona
also associated with the increase of disc temperatures (which is also observed). The increasing of the soft photon flux
should be also responsible of the cooling of the corona which reflects in the hard X-ray spectral softening observed (Gilfanov et al., 1999).
In contrast, the heating rate of the electrons in the corona appears to change by only a factor of 2.
Although other models (i.e. dynamic accretion disc corona) cannot be ruled out,
these results are consistent with the so-called truncated disc model (Done et al., 2007),
also supported by the increase of the Compton reflection and by the larger QPO frequencies in the HIMS compared to the HS (Zdziarski et al., 1999; Gilfanov et al., 1999).
We did not find in the HS any contribution from the non-thermal electron Comptonisation as observed by INTEGRAL in a number of BHBs (e.g. Bouchet et al. 2009; Pottschmidt et al. 2008; Droulans et al. 2010). This is possibly due to the lack of long observations in a stable spectral state, which results in low statistics carried out above 200 keV in the IBIS spectra. However, as expected, this component is observed in the HIMS, when the thermal electrons of the corona cool and the non-thermal Comptonisation occurs.
7 Conclusions
We have presented spectral and timing analysis of INTEGRAL and Swift observations of the transient BHB SwJ1745. Data covered the first part of the outburst spanning from 2012 September 16 until October 30. Our results can be briefly summarised:
-
1)
Despite the source brightness (up to LLEdd), SwJ1745 never reached the SS state, increasing the number of ”failed outbursts” observed in BHBs. This implies that the low luminosities observed in most of the previous failed outburst is not the only discriminant for such a phenomenon.
-
2)
The truncated disc model is supported by the evolution of the spectral parameters as the source goes from the HS to the HIMS and by the high flux of disc photons combined with the increasing of the black-body temperature. In addition, the timing results and, in particular, the correlation between the spectral softening and the total fractional rms strengthen this scenario.
-
3)
We did not find any contribution from non-thermal Comptonisation in the HS. On the contrary, a non-thermal fraction of 0.6 contributes to the total Comptonisation emission in the HIMS, when the cooling of thermal electrons is also observed.
Acknowledgments
MDS thanks Milvia Capalbi and Carlo Ferrigno for useful discussion on Swift/XRT and INTEGRAL data analysis, respectively. TMB acknowledges support from INAF PRIN 2012-6. JAT acknowledges partial support from the Swift Guest Observer program through NASA grants NNX13AJ81G and NNX14AC56G. VG acknowledges funding support by NASA through the Smithsonian Astrophysical Observatory (SAO) contract SV3-73016 to MIT for Support of the Chandra X-Ray Center (CXC) and Science Instruments; CXC is operated by SAO for and on behalf of NASA under contract NAS8-03060. JR acknowledges funding support from the French Research National Agency: CHAOS project ANR-12-BS05-0009 (http://www.chaos-project.fr), and from the UnivEarthS Labex program of Sorbonne Paris Cité (ANR-10-LABX-0023 and ANR-11-IDEX-0005-02). TMD acknowledges support by the Spanish Ministerio de Economia y competitividad (MINECO) under grant AYA2013-42627.
References
- Arnaud et al. (2007) Arnaud, K., Dorman, B., & Gordon, C., 2007, ApJ, An X-ray Spectral Fitting Package - User Guide for version 12.4.0, Heasarc Astrophysics Science Division.
- Barthelmy et al. (2005) Barthelmy S. D., et al., 2005, SSRv, 120, 143
- Belloni (2011) Belloni T. M., Motta S. E., Munoz-Darias T., Bull. Astr. Soc. India, 2011, 39, 409
- Belloni (2010) Belloni T., 2010, in ”The Jet Paradigm”, Ed. T. Belloni, Lecture Notes in Physics, Volume 794, 53
- Belloni et al. (2002) Belloni T. M., Psaltis D., van der Klis M., 2002, ApJ, 572, 392
- Belloni & Hasinger (1990) Belloni T. & Hasinger G., 1990, A&A, 230, 103
- Bouchet et al. (2009) Bouchet L., Del Santo M., Jourdain E., Roques J. P., Bazzano A., De Cesare G., 2009, ApJ, 693, 1871
- Brocksopp et al. (2004) Brocksopp C., Bandyopadhyay R. M., Fender R. P., 2004, NewA, 9, 249
- Capitanio et al. (2009) Capitanio F., Belloni T., Del Santo M., Ubertini P., 2009, MNRAS, 398, 1194
- Casella et al. (2005) Casella P., Belloni T., Stella L., 2005, ApJ, 629, 403
- Castro-Tirado et al. (1997) Castro-Tirado A. J., Ortiz J. L., Gallego J., 1997, A&A, 322, 507
- Chen et al. (1993) Chen W., Livio M., Gehrels N., 1993, ApJ, 408, 5
- Coppi (1999) Coppi P. S., 1999, ASP Conf. Ser. 161: High Energy Processes in Accreting Black Holes, 161, 375
- Corbel (2005) Corbel S., 2005, Ap&SS, 300, 275
- Courvoisier et al. (2003) Courvoisier T. J.-L., et al., 2003, A&A, 411, L53
- Cummings et al. (2012) Cummings J. R., et al. 2012, GRB Coordinates Network, 13775, 1
- Curran et al. (2014) Curran P. A., et al., 2014, MNRAS 437, 3265
- Del Santo et al. (2008) Del Santo M., Malzac J., Jourdain E., Belloni T., Ubertini P., 2008, MNRAS, 390, 227
- Del Santo et al. (2009) Del Santo M., et al., 2009, MNRAS, 392, 992
- Del Santo et al. (2013) Del Santo M., Malzac J., Belmont R., Bouchet L., De Cesare G., 2013, MNRAS, 430, 209
- Done et al. (2007) Done C., Gierkiński M., Kubota A., 2007, A&ARv, 15, 1
- Droulans et al. (2010) Droulans R., Belmont R., Malzac J., Jourdain E., 2010, ApJ, 717, 1022
- Eardley et al. (1975) Eardley D. M., Lightman A. P., Shapiro S. L., 1975, ApJ, L199, 153
- Fender et al. (2009) Fender R. P., Homan J., Belloni T. M., 2009, MNRAS, 396, 1370
- Fender (2001) Fender R. P., 2001, MNRAS, 322, 31
- Ferrigno et al. (2012) Ferrigno C., Bozzo E., Del Santo M., Capitanio F., 2012, A&AL, 537, 7
- Gierliński et al. (1999) Gierliński M., Zdziarski A. A., Poutanen J., Coppi P. S., Ebisawa K., Johnson W. N., 1999, MNRAS, 309, 496
- Gilfanov et al. (1999) Gilfanov M., Churazov E., Revnivtsev M., 1999, A&A, 352, 182
- Goldwurm et al. (2003) Goldwurm A., et al., 2003, A&A, 41, 223
- Grinberg et al. (2014) Grinberg V., et al., 2014, A&A, 565, 1
- Homan & Belloni (2005) Homan J., Belloni T., 2005, Ap&SS, 300, 107
- Ibragimov et al. (2005) Ibragimov A., Poutanen J., Gilfanov M., Zdziarski A. A., Shrader C. R., 2005, MNRAS, 362, 1435
- Ingram et al. (2009) Ingram A., Done C., Fragile P. C., 2009, MNRAS, 397, L101
- Joinet et al. (2007) Joinet A., Jourdain E., Malzac J., et al., 2007, ApJ, 657, 400
- Kalemci et al. (2014) Kalemci E., et al., 2014, MNRAS, 445, 1288
- Lebrun et al. (2003) Lebrun F., et al., 2003, A&A, 411, L141
- Lund et al. (2003) Lund N., et al., 2003, A&A, 411, L231
- Malzac et al. (2006) Malzac J., et al., 2006, A&A, 448, 1125
- McClintock & Remillard (2006) McClintock J. E., & Remillard R. A., 2006, in “Compact stellar X-ray sources”, W. H. G. Lewin & M. van der Klis Eds., Cambridge University Press
- Miller et al. (2006) Miller J. M., et al. 2006, ApJ, 653, 525
- Miller et al. (2012) Miller J. M., Pooley G. G., Fabian A. C., Nowak M. A., Reis R. C., Cackett E. M., Pottschmidt K., Wilms J., 2012, ApJ, 757, 11
- Motta et al. (2009) Motta S., Belloni T., Homan J., 2009, MNRAS, 400, 1603
- Motta et al. (2011) Motta S., Muñoz-Darias T., Casella P., Belloni T., Homan, J., 2011, MNRAS, 418, 2292
- Motta et al. (2015) Motta S. E.;,Casella P., Henze M., Muñoz-Darias T., Sanna A., Fender R., Belloni T., 2015, MNRAS, 447, 2059
- Munoz-Darias et al. (2013) Muñoz-Darias T., et al., 2013, MNRAS, 432, 1133
- Munoz-Darias et al. (2011a) Muñoz-Darias T., Motta S., Belloni T. M., 2011a, MNRAS, 410, 679
- Munoz-Darias et al. (2011b) Muñoz-Darias T., Motta S., Stiele H., Belloni T. M., 2011b, MNRAS, 415, 292
- Pottschmidt et al. (2008) Pottschmidt K., et al., 2008, POS(INTEGRAL08), 098
- Poutanen & Svensson (1996) Poutanen J., Svensson R., 1996, ApJ, 470, 249
- Reis et al. (2010) Reis R. C., Fabian A. C., & Miller J. M. 2010, MNRAS, 402, 836
- Reynolds et al. (2010) Reynolds M. T., Miller J. M., Homan J., & Miniutti G. 2010, ApJ, 709, 358
- Romano et al. (2006) Romano P., et al. 2006, A&A, 456, 917
- Shakura & Sunyaev (1973) Shakura, N. I., & Sunyaev, R. A., 1973, A&A, 24, 337
- Soleri et al. (2013) Soleri P., et al., 2013, MNRAS, 429, 1244
- Sturner & Shrader (2005) Sturner S. J. , & Shrader C. R. , 2005, ApJ, 625, 923
- Sunyaev & Titarchuck (1980) Sunyaev R. A., Titarchuk L. G., 1980, A&A, 86, 121
- Tomsick et al. (2012) Tomsick J. A., Del Santo M., Belloni T. M., 2012, ATel #4393
- Ubertini et al. (2003) Ubertini P., et al., 2003, A&A, 411, L131
- Verner et al. (1996) Verner D. A., Ferland G. J., Korista K. T., Yakovlev D. G., 1996, ApJ, 465, 487
- Vovk et al. (2012) Vovk I., 2012, ATel, #4381
- Wilkinson & Uttley (2009) Wilkinson T., Uttley P., 2009, MNRAS, 397, 666
- Wilms et al. (2000) Wilms J., Allen A., McCray R., 2000, ApJ, 542, 914
- Winkler et al. (2003) Winkler C., et al., 2003, A&A, 411, L1
- Wijnands et al. (1999) Wijnands R., Homan J., van der Klis M., 1999, ApJ, 526, L33
- Zdziarski & Gierkiński (2004) Zdziarski A. A., Gierkiński M., 2004, Progress of theoretical Physics, 155, 99
- Zdziarski (2000) Zdziarski A. A., 2000, Proceedings of IAU Symposium, 195, 153
- Zdziarski et al. (2004) Zdziarski A. A., Gierliński M., Mikolajewska J., Wardziński G., Smith D. M., Harmon B. A., Kitamoto S., 2004, MNRAS, 351, 791
- Zdziarski et al. (1999) Zdziarski A. A., Lubiński P., Smith D. A., 1999, MNRAS, L303, 11
- Magdziarz & Zdziarski (1995) Magdziarz P., & Zdziarski A. A., 1995, MNRAS, 273, 837
| Group | NH | / | k | (dof) | ||||||
| IBIS-XRT | cm-2 | [eV] | [erg cm-2 s-1 ] | |||||||
| Bol | disc | Compt | ||||||||
| A1 | - | (0) | (0) | (100) | 1.10(39) | 6.2 | 0.2 | 6.0 | ||
| A2 | - | (0) | (0) | (100) | 0.80(46) | 8.8 | 0.14 | 8.7 | ||
| A3-000 | (0) | (100) | 1.05(730) | 16.8 | 0.19 | 12.8 | ||||
| A4-002 | (0) | (100) | 0.85(154) | 20.0 | 1.1 | 15.5 | ||||
| A5 | - | (0) | (100) | 0.98(45) | 28.5 | 0.9 | 24.7 | |||
| A6 | - | (0) | (100) | 0.77(47) | 31.2 | 1.0 | 23.9 | |||
| B1 | - | (0) | (300) | 0.66(45) | 61.4 | 8.2 | 49.5 | |||
| B2 | - | (0) | (300) | 0.97(45) | 59.6 | 9.1 | 43.9 | |||
| B3 | - | (0) | (300) | 0.71(45) | 60.3 | 10.7 | 42.7 | |||
| B4 | - | (0) | (300) | 0.81(48) | 56.2 | 11.4 | 35.0 | |||
| B5-008 | (0) | 1.04(709) | 50.7 | 10.0 | 26.1 | |||||
| B6 | - | (300) | 1.11(46) | 71.4 | 25.1 | 37.3 | ||||
| B7 | - | (300) | 0.69(36) | 65.6 | 21.4 | 35.8 | ||||
| B8 | - | (1) | (300) | 0.83(48) | 53.7 | 12.1 | 33.5 | |||
| B9 | - | (1) | (300) | 0.80(46) | 62.1 | 20.1 | 34.1 | |||
| B10 | - | (300) | 0.79(46) | 66.1 | 22.5 | 35.6 | ||||
| C1-011 | (1) | 1.03(659) | 68.6 | 25.8 | 34.6 | |||||
| C2-012 | 1.04(695) | 71.5 | 21.4 | 40.2 | ||||||
| C3 | - | (400) | 1.08(46) | 52.8 | 27.8 | 19.8 | ||||
| C4 | - | (400) | 0.72(46) | 54.7 | 27.7 | 21.6 | ||||
| C5-013 | (1) | (0) | 1.03(705) | 77.2 | 26.2 | 40.9 | ||||
| C6-014 | 0.99(703) | 83.6 | 29.8 | 45.4 | ||||||
| D1-016 | 0.95(651) | 68.4 | 25.1 | 36.4 | ||||||
| D2-019 | 0.93(656) | 81.9 | 28.1 | 43.9 | ||||||
| D3-020 | 0.97(677) | 84.2 | 31.9 | 43.4 | ||||||
| D4 | - | 0.74(48) | 29.4 | 11.5 | 14.3 | |||||
| Group | / | k | k | (dof) | |||
| -y | k | ||||||
| [eV] | keV | ||||||
| (0) | (100) | - | 0.93(60) | ||||
| - | - | (100) | 1.01 (60) | ||||
| (0) | (300) | - | 1.03(57) | ||||
| - | - | (300) | 0.98 (57) | ||||
| (0) | (300) | - | 0.91(59) | ||||
| - | - | (300) | 0.91(59) | ||||
| (1) | (500) | - | 0.95(48) | ||||
| - | (1) | (500) | 0.75(48) |