CK Vul: a smorgasbord of hydrocarbons rules out a 1670 nova (and much else besides)
Abstract
We present observations of CK Vul obtained with the Spitzer Space Telescope. The infrared spectrum reveals a warm dust continuum with nebular, molecular hydrogen and HCN lines superimposed, together with the “Unidentified Infrared” (UIR) features. The nebular lines are consistent with emission by a low density gas. We conclude that the Spitzer data, combined with other information, are incompatible with CK Vul being a classical nova remnant in “hibernation” after the event of 1670, a “Very Late Thermal Pulse”, a “Luminous Red Variable” such as V838 Mon, or a “Diffusion-induced nova”. The true nature of CK Vul remains a mystery.
keywords:
circumstellar matter – stars: individual, CK Vul – infrared: stars – ISM: molecules1 Introduction
CK Vul111As in Evans et al. (2002) we refer to the 1670 event as “Nova Vul 1670” and to the object observed post-1980 as CK Vul. has been the subject of considerable interest. Shara, Moffat & Webbink (1985) proposed that CK Vul is the oldest “old nova”, as its optical faintness ties in well with the “hibernation” hypothesis for classical novae (CNe; see e.g. Vogt, 1990). Shara et al. (1985) reconstructed its visual light curve from contemporary documents (their paper also includes an excellent contemporary finding chart) and concluded that its light curve resembled that of very slow novae.
However Harrison (1996), on the basis of infrared (IR) data, suggested that CK Vul might be the result of a “very late thermal pulse” (VLTP) in a low mass ( M⊙) star. VLTPs are caused by re-ignition of a residual helium shell as the star evolves towards the white dwarf (WD) region of the H–R diagram, following which it retraces its evolutionary track (e.g. Iben, 1982; Herwig, 2005) and becomes a “Born-again” giant. CK Vul’s sub-millimetre properties (Evans et al., 2002, hereafter EvLZ), coupled with the discovery of a planetary nebula (PN) in the vicinity of the eruptive object (Hajduk et al., 2007), further suggest that it might be the result of a VLTP; indeed Shara et al. considered the possibility that CK Vul is a very young PN. Other interpretations include a stellar merger event (Kato, 2003; Kamiński et al., 2015; Prodan et al., 2015), and a “diffusion-induced nova” (DIN; Miller Bertolami et al., 2011, see Section 5 below). The nature of Nova Vul 1670 and of CK Vul is discussed by Hajduk et al. (2007), who consider various scenarios and conclude that none is without difficulty. In particular they argue that the observational properties (e.g. light curve, ejected mass, low ejecta velocity) of CK Vul are inconsistent with a CN.
CK Vul was detected as a thermal radio source by Hajduk et al. (2007), who also found that it lies at the centre of a faint bipolar H nebula of extent ( pc at a distance of 550 pc; Shara et al., 1985), the previously-known nebula (see e.g. Shara et al., 1985; Naylor et al., 1992) lying at its waist. Hajduk et al. (2013) found that the flux of the latter nebula had declined over the period 1991–2010, and that background stars were rendered variable by motion of dust in the vicinity of CK Vul.
Kamiński et al. (2015; hereafter KMT) have carried out sub-millimetre spectroscopy of CK Vul, with spatial resolution ranging from to . They reported a rich spectrum of small hydrocarbon molecules, including HCO+, HCN, HNC and their isotopologues. They conclude that the gas around CK Vul is greatly enhanced in nitrogen, and contains a number of O-bearing molecules (such as SiO, H2CO) that are also seen in C-rich stars. On the other hand, the absence of molecules (such as SiC, HC3N) that are common in C-rich environments led them to conclude that the gas around CK Vul does not appear to be carbon rich. Isotopic ratios (such as 12C/13C, 16O/18O) are grossly non-solar. KMT determine the mass of gas to be M⊙, far in excess of what would be expected for a CN eruption. They conclude, on the basis of isotopic ratios and current luminosity, that the most likely interpretation of CK Vul is a stellar merger.
| Wavelength | Identification | Transition | Flux | cloudy flux | |||
|---|---|---|---|---|---|---|---|
| (m) | (UpperLower) | (cm-1) | (cm-3) | ( W m-2) | ( W m-2) | ||
| [S iv] 10.510m | 2P3/2 – 2P1/2 | 951 | 0.44 | ||||
| H12CN, H13CN | See text | — | |||||
| H2 17.035m | S(1) | 705 | — | ||||
| [S iii] 18.713m | 3P2 – 3P1 | 833 | 2.71 | ||||
| [O iv] 25.890m | 2P – 2P | 386 | 1.91 | ||||
| H2 28.219m | S(0) | 354 | — | ||||
| [S iii] 33.481m | 3P1 – 3P0 | 299 | 2.30 | ||||
| [Si ii] 34.815m | 2P – 2P | 287 | 13.30 |
2 The IRS spectrum

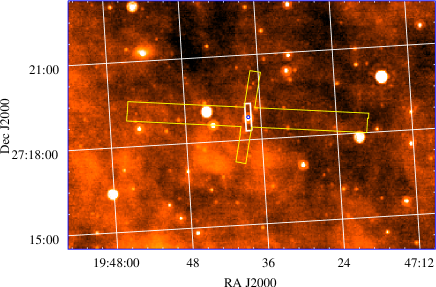
CK Vul was observed at low resolution () with the Spitzer IRS in mapping mode (AOR 10839296) on 2004 October 24. In the short wavelength (5.8–14.2m) range the ramp duration was 14 s. Step size parallel to the slit was ; step size perpendicular to the slit , with seven pointings along the dispersion. In the long wavelength (14.2–40.0m) range the ramp duration was 120 s, with steps parallel to the slit, perpendicular. There were seven pointings along the dispersion. The observation time was 3350 s. The sky coverage is given in Fig. 1.
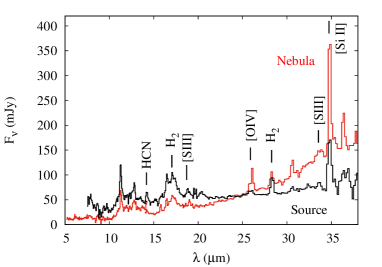
The spectra were extracted with spice version 2.5 using the “Extended Source” extraction module. The individual spectral scans did not differ significantly from position to position and the spectrum shown in Fig. 2 (top), labelled “Nebula”, is the result of averaging all 28 spectra. The flux density given in Fig. 2 is that through the IRS slit; it corresponds to a brightness of MJy ster-1 at 15m, and MJy ster-1 at 32m.
There is clearly a point source at the position of CK Vul, as shown in Fig. 1 (see also KMT); the latter is an image obtained with the Multiband Imaging Photometer for Spitzer (MIPS; Rieke et al., 2004). CK Vul (FWHM ) is unresolved in the 24m MIPS image. We have also used spice to extract the IRS spectrum of the point source. This spectrum, labelled ‘Source’, is also shown in Fig. 2 (top). The IRS fluxes for the ‘Source’ are consistent, within the IRS calibration uncertainties, with the data in Table 1 of EvLZ and the spectrum shown by KMT.
3 Emission features
3.1 Ionic lines
A number of emission lines from the gas phase are evident in Fig. 2; these are listed in Table 1, together with suggested identifications; none of the ionic emission lines is resolved, and all have very low excitation ( in cm-1 is included in Table 1). For fine structure lines, the critical density at K above which collisional de-excitation dominates radiative de-excitation is given (mostly taken from Giveon et al., 2002; Helton et al., 2011).
Naylor et al. (1992) and Hajduk et al. (2013) note the presence of [N ii] and [S ii] lines in the optical spectrum of CK Vul; using their flux ratios (there is negligible change in the flux ratios over the period 1992–2010) and data in Osterbrock & Ferland (2006), we find K and cm-3. However the [S iii] 18.71m/33.48m line ratio points to a somewhat higher , cm-3, but these values of are generally below the critical densities in Table 1.
The [O iv] 2PP1/2 25.890m line, which is ubiquitous in mature CNe (Helton et al., 2012) and common (but not universal) in PNe (Stanghellini et al., 2012), is clearly present. However its full-width half-maximum (0.54m) is significantly greater than that of the other lines (m), suggesting that there may be a contribution from another species. The [S iv] 2PP1/2 10.510m line, which is often strong in PNe, is present in CK Vul. While it is possible that there is a contribution from H i Hu (12.369m) and/or the [Ne ii] 2PP3/2 12.814m fine structure line to the feature at m, this is more likely to be a UIR feature; we discuss this further below.
The features at 33.56m and 34.74m are also present in the VLTP object FG Sge, but they are very strong in CK Vul compared to their strength in FG Sge (Evans et al., 2015). We identify these features as [S iii] 33.481m 3P1 – 3P0 (33.56m) and [Si ii] 2PP1/2 34.815m (34.74m) respectively (see Fig. 2).
We have used the photo-ionisation code cloudy (Ferland et al., 2013) to obtain some pointers to the environment of CK Vul. We take the luminosity of the central source to be 0.9 L⊙ (KMT), and explore a range of effective temperatures (from 40 kK to 120 kK) and abundances (including solar). We use the above values of and as a guide, on the assumption that the optical and IR lines arise in the same region. The unknown (and almost certainly large) dust opacity in the visual/ultra-violet between the (unknown) ionising source and the surrounding nebula means that any discussion of line intensities is highly uncertain, and parameters have been changed in an ad hoc fashion. Further the relatively few ionic lines in the IRS range means that our ability to constrain parameters such as source properties and abundances are limited, so our conclusions should be regarded with considerable caution. In particular, the lack of C and N lines in the IRS range means that we can neither confirm nor refute KMT’s conclusions about the abundances of these species, but the presence of UIR features (see Section 4.1 below) suggests a carbon-rich environment. We confine the cloudy output to the IRS wavelength range.
The absence of certain lines (e.g. [Ne ii] 12.81m, [Ar iii] 8.99m), the presence of [S ii] and [O iv], and the high , point to non-solar abundances and the presence of a central source with effective temperature at least kK. The “cloudy flux” values in Table 1 are based on a central source with temperature 100 kK, density H atoms cm-3, neon and argon both solar, sulphur solar, and iron heavily depleted; the resultant K. If iron is indeed heavily depleted it may be locked up in grains.
We have no satisfactory identification for lines at m and m (with fluxes of and W m-2, respectively. S i] 5S – 3P1 (30.405m) and S i 3F – 3D0 (32.296m) match the wavelengths but their excitation energies are far higher than any of the other features, and neither featured in our cloudy runs; and while [P ii] 3P2 – 3P1 has an excitation energy of 469 cm-1 and was present in cloudy output, its wavelength (32.871m) is a poor match to the feature. While some crystalline silicates have features at these wavelengths, they can be ruled out as we would expect additional features elsewhere.
3.2 Molecular lines
There is a significant emission line at m; we assign this to the S(1) line from the ground vibrational state of molecular hydrogen; this sits atop broader UIR features centred at 17.4m and 16.4m. A feature at 28.25m is at the expected wavelength of the corresponding S(0) line (28.219m) and, in view of the presence of the S(1) line, we assign the 28.25m feature to H2. The non-detection of S(2) (12.28m) is likely due to the fact that the level (1169 cm-1, 0.15 eV) is not sufficiently populated. The H2 rotational excitation is probably collisional, the level of internal excitation ( eV) being similar to that of [S iii] ( eV).
A possible identification for the line at 14.183m is H i 13–9; however for K and cm-3, the flux in the H i 13–9 line would be that of Hu- (cf. Storey & Hummer, 1995); however it is doubtful whether Hu- is present (see above) so the H i 13–9 line flux should be negligible. In view of the detection of HCN in CK Vul by KMT and the low 12C/13C ratio, a more plausible identification is a blend of H12CN ( at 14.00m, at 14.04m) and H13CN (Q branch at 14.1605m).
4 The dust features
4.1 The UIR features
The Unidentified InfraRed (UIR) features are clearly present but there is no clear evidence for the 9.7m and 18m silicate features (see Fig. 2). While it is not uncommon to see the simultaneous presence of both silicates and UIR features in CNe and evolved objects (e.g. Evans et al., 2005; Guzman-Ramirez et al., 2011; Helton et al., 2011) the likelihood is that we may be seeing dust formed in a carbon-rich environment in CK Vul. The UIR features at 6.2m, 7.7m, 8.6m, 11.2m, 12.7m and 16.4–18.9m (see Tielens, 2008, for details) are prominent in both the point source and the inner nebula. While KMT concluded that C-bearing molecules typically present in C-rich environments are missing (see Section 1), it is feasible that C is depleted from the gas phase and present in UIR carriers. The excitation of the UIR features requires a source of ultraviolet (UV) radiation (Tielens, 2008) and it seems likely that the central object (whatever its nature) is that source, although it is likely to be highly extinguished by the surrounding dust.
The “6.2m” feature, which is due to CC stretch, seems to be relatively weak in CK Vul. Hudgins, Bauschlicher & Allamandola (2005) suggest that this feature arises from substitution of some C atoms in the C-ring structure by N. However, this is difficult to reconcile with the suggestion that the abundance of nitrogen is greatly enhanced in CK Vul (KMT) – possibly the result of CNO cycling. Its weakness may be due to a predominance of neutral PAHs.
The central wavelength of the “7.7m” feature is well-known to be correlated with the effective temperature of the exciting star (see Fig. 5 of Sloan et al., 2007) and the central wavelength of m in CK Vul indicates an exciting source with an effective temperature of at least K; a similar constraint on the effective temperature is implied by the central wavelength of m for the “11.2m” feature (Sloan et al., 2007; Candian & Sarre, 2015). This is the effective temperature “seen” by the UIR carriers: as internal extinction has the effect of making a blackbody appear cooler than it actually is, this provides a lower limit on the temperature of the central object.
As noted in Section 3.1 the feature at 12.7m is most probably the UIR “12.7m” feature. As shown by Hony et al. (2001), the 12.7m UIR feature is skewed, being steep on the long wavelength side and with a strong blue wing (cf. Fig. 2). The relative strengths of the 11.2m and 12.7m features is an indication of the molecular structure of the emitting PAH molecules (Tielens, 2008). Hony et al. (2001) argue that the 11.2m feature arises predominantly from neutral PAH molecules, while the latter arises from positively charged PAHs.
The flux ratio depends on the parameter , where is the gas temperature and is a measure of the flux between the Lyman continuum and 0.2m, normalised to the value in the solar neighbourhood (the latter being W m-2; see Tielens, 2005; Galliano et al., 2008). In CK Vul which, with the assumed value of and taking (as is the case, for example, in photo-dissociation regions and other ionised environments; Tielens, 2005), gives . This value is comparable with the value of for the PN NGC 7027 and the reflection nebula NGC 2023 ( and respectively; Galliano et al., 2008). These considerations confirm the premise that there is a source of UV radiation in the CK Vul system.
4.2 Comparison with nova UIR features
The formation of carbon-rich dust in CN winds is not uncommon (Evans & Rawlings, 2008; Gehrz, 2008; Helton et al., 2011; Evans & Gehrz, 2012). Likely, CK Vul is the remnant of what was recorded as “Nova Vul 1670”. Comparison of the UIR features in CK Vul with those in dusty CNe that show UIR features (see Helton et al., 2011, for a summary) is therefore of interest.
In the CN DZ Cru the dust had a temperature K at 1477 days after maximum (Evans et al., 2010) and by 2010, the dust had cooled to K (Evans et al., 2014). Were it to continue cooling at the same rate for years (the age of CK Vul) it would cool to K, comparable with the temperature of dust in the diffuse interstellar medium (Abergel et al., 2014). The underlying dust continuum of CK Vul (Fig. 2) however resembles a modified black body at K (KMT), somewhat warmer than would be expected for dust produced in a CN eruption in 1670 and cooling as it flows away from the site of the eruption. By comparison, no dust was detected in a Spitzer observation of the dusty CN NQ Vul some 27.5 years after eruption (Helton et al., 2012).
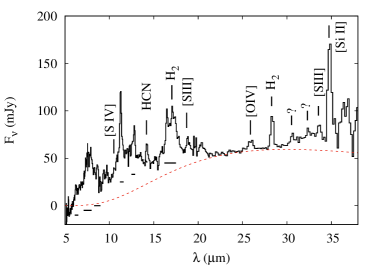
Secondly, over the limited wavelength range of the IRS spectrum, the “continuum” resembles a 173 K black body; we subtract this from the spectrum in Fig. 2 to highlight the UIR features in CK Vul. The UIR emission in CK Vul is are entirely unlike those typical of CNe. The latter display strong 6.2m, 7.7m and 8.6m features and a relatively weak 11.2m feature (Evans et al., 2010; Helton et al., 2011); the reverse is the case for CK Vul. As noted by Helton et al., the UIR features in novae tend to lie in “Class C”, as described by Peeters et al. (2002), with classes “A” and “B” excluded; the UIR features in CK Vul on the other hand are closer to Peeters et al.’s “Class A”, given the peak wavelength for the 11.2m feature of m. The 11.2m profile has a redward tail as is commonly found, but the slope of the short-wavelength side is less steep than found in many objects. Noting the peak wavelength and gradual short-wavelength slope, the profile in CK Vul is consistent with a distribution of lower-mass PAHs than found in Class A objects (Candian & Sarre, 2015). Finally, the 16–18m region is very prominent with UIR band peaks at m and m. Unfortunately, neither feature is understood, although they have been the subject of a critical assessment (Boersma et al., 2010).
While these considerations do not in themselves demonstrate the non-nova-like nature of CK Vul, the cumulative UIR evidence suggests that the dusty environment of CK Vul is entirely unlike that of dusty CNe.
5 Discussion and conclusion
| CK Vul | CN | VLTP | Merger | DIN[1] | |
| Visual light curve | Erratic | Erratic | Erratic | Erratic | Like slow novae |
| (slow novae) | + deep minimum | ||||
| Peak luminosity ( L⊙) | |||||
| Luminosity after 350 years ( L⊙) | 0.9 | ? | |||
| after 350 years (1 000 K) | ? | ||||
| Ejected mass ( M⊙) | ? | ||||
| Presence of PN/remnant | Yes | Yes | Yes | ? | No |
| Presence of Li | In “PN” | Not expected | Possibly [2] | Produced in WD mergers [3] | ? |
| C abundance of star | CO | — | CO | OC for known | CO |
| C abundance of inner neb | CO | C or O [4] | CO | CO | |
| [1] Miller Bertolami et al. (2011). [2] Hajduk et al. (2005). [3] Longland et al. (2012). [4] Of ejecta; see Starrfield, Illiadis & Hix (2008). | |||||
The visual light curve of Nova Vul 1670 (Shara et al., 1985) could pass for that of a very slow CN, a stellar merger or a VLTP. The visual magnitude at maximum was (Shara et al., 1985); as we have no information about the bolometric correction for 1670, and the interstellar reddening is somewhat uncertain, all we can confidently conclude is that the luminosity at outburst was L⊙, assuming a distance of 550 pc (Shara et al., 1985). Its current luminosity, based entirely on the dust emission, is L⊙ (KMT) and the effective temperature of the central source, based on the UIR features, must currently be K (Section 4.1), and possibly as high as K (Section 3.1) . It is also likely that the immediate environment of the central source, and that of the inner nebulosity, is carbon-rich. Any speculation regarding the nature of Nova Vul 1670 and CK Vul must satisfy these constraints; a summary of these properties is given in Table 2.
The Spitzer IRS spectrum of CK Vul, together with the IR-sub-millimetre properties (EvLZ, KMT) point conclusively to the non-nova nature of Nova Vul 1670. While we have no coverage of a bona fide CN over years, the strong, long-wavelength, dust continuum (EvLZ, KMT), emission by small hydrocarbon molecules and molecular ions and the large ejected mass (KMT), are inconsistent with what is expected for a dusty CN some 350 years after eruption. The CN interpretation may now therefore be discounted completely.
There are similarities between CK Vul and the VLTP objects FG Sge and V4334 Sgr (Sakurai’s Object; Evans et al., 2015). These objects (and other VLTPs) and CK Vul are carbon-rich, display UIR and small hydrocarbon molecules, and lie at the centre of a faint PN (Dürbeck & Benetti, 1996; Hajduk et al., 2007). There are also similarities between the IRS spectrum of CK Vul with those of post-AGB stars and young PNe (see e.g. Cerrigone et al., 2009).
However as discussed by KMT, it is unlikely that CK Vul is a post-main sequence object because (a) its current luminosity is L⊙ and (b) the implied abundances in CK Vul are atypical of VLTPs. As discussed by Hajduk et al. (2005) in the context of Sakurai’s Object, a VLTP some 350 years after the event would have luminosity L⊙ and effective temperature K. The former is incompatible with the current luminosity of CK Vul (we dismiss the contrived case of an optically thick dust torus that intercepts only of the radiation from the central object). However a serious problem for this interpretation is the detection of lithium in the CK Vul nebula (Hajduk et al., 2013). While lithium can be produced in a VLTP by a hydrogen-ingestion flash (Herwig, 2005; Hajduk et al., 2005), KMT’s strongest argument is that the current luminosity and isotopic abundances in CK Vul are not those expected of an evolved object. So unless our understanding of VLTPs is seriously in error (and the case of Sakurai’s Object suggests that this might not be entirely out of the question) we conclude that CK Vul is not the result of a VLTP.
KMT suggest that CK Vul may be a unique transient, possibly related to “Luminous Red Variables” such as V1309 Sco (Tylenda et al., 2011) and V838 Mon (Bond et al., 2003); the mounting evidence is that such transients are stellar mergers. A possible difficulty with this interpretation for CK Vul is that the mergers observed to date seem invariably to be oxygen-rich (e.g. Banerjee et al., 2007; Nicholls et al., 2013), whereas the environment of CK Vul seems to be carbon-rich. However no known stellar merger has been observed years after the event, and little seems to be known about the expected C:O ratio and isotopic abundances of stellar mergers. On the other hand, Li production is a prediction of the merger of two He or CO WDs (Longland et al., 2012). Clearly a better understanding of the evolution of merged stars, including their properties and evolution in the first years after the merger, is required.
Finally, Miller Bertolami et al. (2011) have suggested that CK Vul may have been a DIN. In this model, inward diffusion of H, together with outward diffusion of C, into the He zone in the WD remnant of a low metallicity star leads to runaway CNO burning, mimicking a slow CN eruption. While there are a number of features of the DIN scenario that match those of Nova Vul 1670 and CK Vul, a difficulty with the DIN hypothesis is the inferred outburst luminosity (see Miller Bertolami et al., 2011). Further, the DIN interpretation suggests that there should be no PN associated with CK Vul, whereas there manifestly is (Hajduk et al., 2007, KMT).
In conclusion, there still seems to be no satisfactory explanation for Nova Vul 1670, CK Vul, and the relationship (if any) between them: the object remains a “riddle wrapped in a mystery inside an enigma” (Churchill, 1939).
Acknowledgments
We thank the referee for helpful comments which have helped to improve the paper. RDG was supported by NASA and the United States Air Force. CEW was supported in part by NASA Spitzer grants to the University of Minnesota. PJS thanks the Leverhulme Trust for award of a Research Fellowship. SS acknowledges partial support from NASA, NSF and Spitzer grants to ASU.
References
- Abergel et al. (2014) Abergel A., et al., 2014, A&A, 566, A55
- Banerjee et al. (2007) Banerjee D. P. K., Misselt K. A., Su K. Y. L., Ashok N. M., Smith P. S., 2007, ApJ, 666 L25
- Boersma et al. (2010) Boersma, C., Bauschlicher C. W., Allamandola L. J., Ricca A., Peeters E., Tielens A. G. G. M., 2010, A&A 511, A32
- Bond et al. (2003) Bond H. E., et al., 2003, Nature, 422, 405
- Candian & Sarre (2015) Candian A., Sarre P. J., 2015 MNRAS, 448, 2960
- Cerrigone et al. (2009) Cerrigone L., Hora J. L. Umana G., Trigilio C., 2009, ApJ, 703, 585
- Churchill (1939) Churchill W. S., 1939, www.churchill-society-london.org.uk/RusnEnig.html
- Dürbeck & Benetti (1996) Dürbeck H. W., Benetti S., 1996, ApJ, 486, L11
- Evans et al. (2002) Evans A., van Loon J. Th., Zijlstra A. A., Pollacco D., Smalley B., Tyne V. H., Eyres S. P. S., 2002, MNRAS, 332, L35 (EvLZ)
- Evans et al. (2005) Evans A., Tyne V. H., Smith O., Geballe T. R., Rawlings J. M. C., Eyres S. P. S., 2005, MNRAS, 360, 1483
- Evans & Rawlings (2008) Evans A., Rawlings J. M. C., 2008, in Classical Novae, second edition, p. 308, eds M. F. Bode & A. Evans, Cambridge University press
- Evans et al. (2010) Evans A., et al., 2010, MNRAS, 406, L86
- Evans & Gehrz (2012) Evans A., Gehrz R. D., 2012, BASI, 40, 213
- Evans et al. (2014) Evans A., Gehrz R. D., Woodward C. E., Helton L. A., 2014, MNRAS, 444, 1683
- Evans et al. (2015) Evans A., Gehrz R. D., Helton L. A., Woodward C. E., 2015, in The Physics of Evolved Stars,eds F. Millour, E. Lagadec, T. Lanz, EAS Publication Series (arXiv:1507.06961)
- Ferland et al. (2013) Ferland G. J., et al., 2013, Rev. Mex. Astron. Astrofis., 49, 137
- Galliano et al. (2008) Galliano F., Madden S. C., Tielens A. G. G. M., Peeters A., Jones A. P., 2008, ApJ, 679, 310
- Gehrz et al. (2007) Gehrz R. D., et al., 2007, Rev. Sci. Instr., 78, 011302
- Gehrz (2008) Gehrz R. D., 2008, in Classical Novae, second edition, p. 167, eds M. F. Bode & A. Evans, Cambridge University press
- Giveon et al. (2002) Giveon U., Sternberg A., Lutz D., Feuchtgruber H., Pauldrach A. W. A., 2002, ApJ, 566, 880
- Guzman-Ramirez et al. (2011) Guzman-Ramirez L., Zijlstra A. A., Níchuimín R., Gesicki K., Lagadec E., Millar T. J., Woods P. M., 2011, MNRAS, 414, 1667
- Hajduk et al. (2005) Hajduk M., et al., 2005, Science, 308, 231
- Hajduk et al. (2007) Hajduk M., et al., 2007, MNRAS, 378, 1298
- Hajduk et al. (2013) Hajduk M., van Hoof P. A. M., Zijlstra A. A., 2013, MNRAS, 432, 167
- Helton et al. (2011) Helton L. A., Evans A., Woodward C. E, Gehrz, R. D., 2011, in PAHs and the Universe, eds C. Joblin, A. G. G. M. Tielens, EAS Publications Series, vol. 46, 407
- Helton et al. (2012) Helton L. A., et al., 2012, ApJ, 755, 37
- Harrison (1996) Harrison T. E., 1996, PASP, 108, 1112
- Herwig (2005) Herwig F., 2005, ARAA, 43, 435
- Hony et al. (2001) Hony S., Van Kerckhoven C., Peeters E., Tielens A. G. G. M., Hudgins D. M., Allamandola L. J., 2001, A&A, 370, 1030
- Houck et al. (2004) Houck J. R., et al., 2004, ApJS, 154, 18
- Hudgins et al. (2005) Hudgins D. M., Bauschlicher C. W., Allamandola L. J., 2005, ApJ, 632, 36
- Iben (1982) Iben I., 1982, ApJ, 260, 821
- Kamiński et al. (2015) Kamiński T., Menten K. M., Tylenda R., Hajduk M., Patel N. A., Kraus A., 2015, Nature, 520, 322 (KMT)
- Kato (2003) Kato T., 2003, A&A, 399, 695
- Longland et al. (2012) Longland R., Lorén-Aguilar P., José, J., García-Berro E., Althaus L. G., 2012, A&A, 542, A117
- Miller Bertolami et al. (2011) Miller Bertolami M. M., Althaus L. G., Olano C., Jiménez N., 2011, MNRAS, 415, 1396
- Naylor et al. (1992) Naylor T., Charles P. A., Mukai K., Evans, A., 1992, MNRAS, 258, 449
- Nicholls et al. (2013) Nicholls C. P., et al., 2013, MNRAS, 431, L33
- Osterbrock & Ferland (2006) Osterbrock D. E., Ferland G. F., 2006, Astrophysics of Gaseous Nebulae and Active Galactic Nuclei, second edition, University Science Books
- Peeters et al. (2002) Peeters E., Hony S., Van Kerckhoven C., Tielens A. G. G. M., Allamandola L. J., Hudgins D. M., Bauschlicher C. W., 2002, A&A, 390, 1089
- Prodan et al. (2015) Prodan S., Antonini F., Perets H. B., 2015, ApJ, 799, 118
- Rieke et al. (2004) Rieke G., et al., 2004, ApJS, 154, 25
- Shara et al. (1985) Shara M. M., Moffat A. F. J., Webbink R. F., 1985, ApJ, 294, 271
- Sloan et al. (2007) Sloan G. C., et al., 2007, ApJ, 664, 1144
- Stanghellini et al. (2012) Stanghellini L., García-Hernández D. A., García-Lario P., Davies J. E., Shaw R. A., Villaver E., Manchado A., Perea-Calderón J. V., 2012, ApJ, 753 172
- Starrfield et al. (2008) Starrfield S., Illiadis C., Hix W. R., 2008, in Classical Novae, second edition, eds M. F. Bode & A. Evans, Cambridge University Press
- Storey & Hummer (1995) Storey P. J., Hummer D. G., 1995, MNRAS, 272, 41
- Tielens (2005) Tielens A. G. G. M., 2005, The Physics and Chemistry of the Interstellar Medium, Cambridge University Press
- Tielens (2008) Tielens A. G. G. M., 2008, ARAA, 46, 289
- Tylenda et al. (2011) Tylenda R., et al., 2011, A&A, 528, A114
- Vogt (1990) Vogt N., 1990, ApJ, 356, 609
- Werner et al. (2003) Werner M. W., et al., 2004, ApJS, 154, 1