11email: ruizlara@ugr.es
Instituto Carlos I de Física Teórica y computacional, Universidad de Granada, E-18071 Granada, Spain
School of Physics, University of Exeter, Stocker Road, Exeter EX4 4QL, UK
E.A. Milne Centre for Astrophysics, Deptartment of Physics & Mathematics, University of Hull, Hull, HU6 7RX, UK
Leibniz-Institut für Astrophysik Potsdam (AIP), An der Sternwarte 16, 14482 Potsdam, Germany
Departamento de Física Teórica, Universidad Autónoma de Madrid, E-28049 Cantoblanco, Spain
The imprint of satellite accretion on the chemical and dynamical properties of disc galaxies
Abstract
Aims. We study the effects of the cosmological assembly history on the chemical and dynamical properties of the discs of spiral galaxies as a function of radius.
Methods. We make use of the simulated Milky-Way mass, fully-cosmological discs, from RaDES (Ramses Disc Environment Study). We analyse their assembly history by examining the proximity of satellites to the galactic disc, instead of their merger trees, to better gauge which satellites impact the disc. We present stellar age and metallicity profiles, Age-Metallicity Relation (AMR), Age-Velocity dispersion Relation (AVR), and Stellar Age Distribution (SAD) in several radial bins for the simulated galaxies.
Results. Assembly histories can be divided into three different stages: i) a merger dominated phase, when a large number of mergers with mass ratios of 1:1 take place (lasting 3.20.4 Gyr on average); ii) a quieter phase, when 1:10 mergers take place (lasting 4.42.0 Gyr) - these two phases are able to kinematically heat the disc and produce a disc that is chemically mixed over its entire radial extension; iii) a “secular” phase where the few mergers that take place have mass ratios below 1:100, and which do not affect the disc properties (lasting 5.52.0 Gyr). Phase ii ends with a final merger event (at time ) marking the onset of important radial differences in the AMR, AVR, and SAD.
Conclusions. Inverted AMR trends in the outer parts of discs, for stars younger than , are found as the combined effect of radial motions and star formation in satellites temporarily located in these outer parts. “U-shaped” stellar age profiles change to an old plateau (10 Gyr) in the outer discs for the entire RaDES sample. This shape is a consequence of inside-out growth of the disc, radial motions of disc stars (inwards and outwards), and the accretion of old stars from satellites. We see comparable age profiles even when ignoring the influence of stellar migration due to the presence of early in-situ star formation in the outer regions of the galaxy.
Key Words.:
galaxies: stellar content — galaxies: spiral — galaxies: evolution — galaxies: formation — galaxies: structure — methods: numerical1 Introduction
The accepted scenario of galaxy formation involves an extended process of hierarchical merging of structures until systems settle into the entities we observe today (e.g. White & Rees, 1978; Lacey & Cole, 1993). During these mergers, satellites are thought to leave a signature of their “impact” upon the host. Whether these signatures are major, minor, long- or short-lived, remains an intense topic of debate; what is clear though is that the interplay between such merger/interaction-driven processes and later, internal, secular evolution, all combine to shape the galaxies we see now (e.g. Dressler, 1980; Donzelli & Pastoriza, 2000; Márquez et al., 2002; Lambas et al., 2003; Kewley et al., 2006; Michel-Dansac et al., 2008).
While idealised galaxy simulations are key to understanding secular processes (e.g. Athanassoula, 2005; Debattista et al., 2006; Roškar et al., 2008a, 2012; Athanassoula et al., 2009a, b, 2010), simulations run in a cosmological context allow us to study the environmental effects of evolution, including the impact of satellite-host interactions through to the quiescent, settled, disc-phase (e.g. Katz & Gunn, 1991; Navarro & Benz, 1991; Katz et al., 1992; Navarro & White, 1994; Steinmetz & Muller, 1995; Steinmetz & Navarro, 2002; Abadi et al., 2003). These simulations are a critical tool for understanding the effect of accretion and interactions in the build-up of disc galaxies (e.g. Abadi et al., 2003; Governato et al., 2004; Kazantzidis et al., 2008).
However, early cosmological simulations failed at replicating late-type massive spiral galaxies because of the so-called ‘angular momentum problem’ (e.g. Steinmetz & Navarro, 2002). This problem consists of the over-production of the spheroid component of simulated galaxies due to enhanced star formation at early epochs. Nowadays, by modifying numerical and physical parameters in the simulations, more realistic galaxies have been reproduced (see Hummels & Bryan, 2012, for a study about the effect on the angular momentum of numerical parameters such as supernova feedback, spatial resolution, and star formation efficiency, amongst many others). State-of-the-art numerical simulations have overcome this ‘angular momentum problem’ and are able to reproduce the scaling relations and galaxy properties found in nature (e.g. Robertson et al., 2004; Governato et al., 2007; Scannapieco et al., 2009; Sánchez-Blázquez et al., 2009; Stinson et al., 2010; Rahimi et al., 2010; Brooks et al., 2011; Brook et al., 2012; Stinson et al., 2012; Calura et al., 2012; Gibson et al., 2013; Obreja et al., 2014; Few et al., 2014, amongst others).
Most of the successful cosmological simulations have been focused on reproducing Milky Way-type galaxies (e.g. House et al., 2011; Macciò et al., 2012; Calura et al., 2012; Gibson et al., 2013; Walker et al., 2014; Marinacci et al., 2014). Our privileged position inside the Milky Way allows us to take high quality spatial and spectroscopic data against which to confront simulations. A number of contemporary observational studies are exploring the solar neighbourhood with unprecedented quality, providing astronomers with a vast amount of information, including Gaia (Perryman et al., 2001), RAVE (Steinmetz et al., 2006; Zwitter et al., 2008; Siebert et al., 2011; Kordopatis et al., 2013), and SEGUE (Yanny et al., 2009). Simulations play a pivotal role in interpreting the physical mechanisms which shape these datasets.
One of the most striking observations that needs a theoretical counterpart to be understood is the Age-Metallicity Relation (AMR) in the solar neighbourhood (e.g. Powell, 1972; Hearnshaw, 1972; Twarog, 1980). Stars are born from the collapse of molecular clouds that imprint their chemical composition upon newly formed stars. Those stars undergo nuclear fusion reactions in their cores thereby changing their chemical composition. According to stellar evolution and galactic chemical evolution models (e.g. Prantzos & Aubert, 1995; Fenner & Gibson, 2003; Romano et al., 2005), once these stars reach the end of their lives they form new elements and expel part of their mass to the interstellar medium, increasing the latter’s metal content. As a direct consequence, the subsequent generation of stars is more metal-rich than the former,111Note though that certain star formation and infall rate scenarios can lead, in some cases, to a subsequent decline in metalicity (e.g. Matteucci & Gibson, 1995). resulting in a tightly correlated AMR, with younger stars being more metal-rich and older stars being more metal-poor. However, studies of the AMR in the solar neighbourhood have found an almost flat AMR for thin disc stars, with significant dispersion in metallicity at a given age (e.g. Carlberg et al., 1985; Edvardsson et al., 1993; Feltzing et al., 2001; Nordström et al., 2004; Bergemann et al., 2014), while thick disc stars seem to show a steep AMR (Haywood et al., 2013).
Different theoretical works have been able to reproduce aspects of the observed AMR of the solar neighbourhood, bulge, and nearby dwarf discs, by allowing for stellar radial motions in their models that contaminate the expected relation for stars born in the solar neighbourhood (e.g. Roškar et al., 2008a; Sánchez-Blázquez et al., 2009; Schönrich & Binney, 2009; Pilkington et al., 2012b). Radial motions (especially of older stars) can mix stars with different enrichment histories and different chemical composition (i.e. formed from different molecular clouds at different galaxy evolutionary stages). This effect can lead to flattening and greater dispersion in the AMR. Several authors have tried to explain what stimulates stars to move radially. Some of the proposed causes are i) the exchange of angular momentum at the corotation resonance of transient spiral arms (e.g. Sellwood & Binney, 2002; Roškar et al., 2008b); ii) non-linear coupling between the bar and the spiral waves (e.g. Minchev & Famaey, 2010; Minchev et al., 2012b, a); and iii) the influence of satellites (e.g. Younger et al., 2007; Quillen et al., 2009; Bird et al., 2012). These theoretical works have eased the debate about the observed AMR in the solar neighbourhood. However, there are some observational works still claiming that, although some changes to the AMR can be attributed to stellar migration, a large part of the observed scatter is intrinsic to the star formation processes or related to contamination of the solar neighbourhood by stars on apo- and pericentres (Feltzing et al., 2001; Haywood et al., 2013).
Despite the high quality, spatial resolution, and details of the data that we can acquire for stars in the Milky Way, the study of our Galaxy presents a number of significant disadvantages: i) the Milky Way is just one galaxy amongst the myriad different types of galaxies in the Universe; ii) our inside-view restricts our observations to the solar neighbourhood because the observable region is obscured by dust, preventing a global view of the Milky Way. To achieve a wider understanding of galaxies in the Universe, we need to study external systems (e.g. MacArthur et al., 2009; Yoachim et al., 2012; Pérez & Sánchez-Blázquez, 2011; Sánchez-Blázquez et al., 2011; Peletier et al., 2012; Catinella et al., 2013; Ahn et al., 2014; Sánchez-Blázquez et al., 2014). Those studies provide us with statistical information about integrated properties such as age and metallicity gradients (mass- and light-weighted), Star Formation Histories (SFHs), light and mass distributions, or age-metallicity relations. The new full spectrum fitting techniques used on these unresolved systems have been proved reliable when compared with the analysis of resolved stellar populations (Ruiz-Lara et al., 2015).222Conversely, comparing resolved stellar populations with only a restricted sub-set of line indices can prove problematic (e.g. Gibson et al., 1999).
The joint study of observations and realistic simulations can expand our knowledge about galaxy formation and evolution (e.g. Bakos et al., 2008; Sánchez-Blázquez et al., 2009; Martínez-Serrano et al., 2009; Pilkington et al., 2012a; Yoachim et al., 2012). Simulations allow one to isolate the primary impact of satellite merging in different environments, including for example, the formation of thick discs (e.g. Quinn et al., 1993; Brook et al., 2004; Villalobos & Helmi, 2008), inflows of external material (e.g. Kereš et al., 2005; Dekel & Birnboim, 2006), or radial mixing (e.g. Quillen et al., 2009; Bird et al., 2012). The establishment of testable predictions through simulations can be a powerful tool in designing future observational campaigns.
In this paper, we make use of the cosmological hydrodynamical simulations of Milky Way-mass galaxies presented in Few et al. (2012) (RaDES: Ramses Disc Environment Study). We study those simulated galaxies to search for signatures of their assembly processes in the age-metallicity-radius relationship. The study of assembly of the outer parts of the disc is especially important as, although it represents a small fraction of a galaxy’s total mass, it is very sensitive to satellite accretion or external mass perturbations, providing a guide to galaxy formation and evolution.
In Sect. 2, we present the sample of galaxies, the simulations, and their assembly histories. Sect. 3 presents the main observational characteristics of each simulation. The primary results are shown in Sect. 4 where we discuss the impact of the assembly history on both the AMR and spatially-resolved SFH of the disc. The discussion and main conclusions are provided in Sect. 5.
2 Sample of galaxies
In this work, we use the RaDES (Few et al., 2012) galaxies. The RaDES set of galaxies was created to study differences between galaxies in loose group and field environments through cosmological simulations. RaDES comprises 19 galaxies with masses similar to the Milky Way and disc characteristics similar to other observed disc galaxies (Few et al., 2012; Pilkington et al., 2012a). While each system has similar properties in relation to their matter content (total, dark, stellar, baryonic, and gaseous mass), they also show important differences concerning their kinematic heating profiles (see Figure 9 of Few et al., 2012), star formation histories (see Figure A.1 of Few et al., 2012), disc fractions, and assembly histories.
For brevity, in this work we focus on the analysis of three discs from the RaDES sample. These three span the range of assembly histories of the full sample, from intensive to quiescent; our conclusions are robust against the specific choice of systems.
2.1 Simulations
The RaDES galaxies are simulated with the adaptive mesh refinement code ramses (Teyssier, 2002). The simulations track dark matter, stars and gas on cosmological scales. The hydrodynamical evolution of gas uses a refining grid such that the resolution of the grid evolves to follow over-densities reaching a peak resolution of 436 pc (16 levels of refinement). ramses includes gas cooling/heating and a polytropic equation of state is used for dense gas to prevent numerical fragmentation.
Star formation occurs in gas that is more dense than 0.1 nH cm-3 at a rate of , where )-1/2, with Gyr. Stellar feedback is delayed by years and imparts kinetic energy, mass, and metals to the gas within a 2-cell radius sphere. The mass fraction of stellar particles that explode as SN is 10% and each SN provides 1051 erg; 10% of non-metals are converted to metals by each star particle.
The galaxies were simulated with cosmological parameters as follows: =70 km s-1Mpc-1, =0.28, =0.72, =0.045, and =0.8.333Here, is the Hubble constant, the fraction of total matter, the fraction of the dark energy, and the strength of the primordial density fluctuations. Two volumes are used with a size of 20 Mpc and 24 Mpc. The mass resolution of dark matter particles is either 5.5106 M⊙ or 9.5106 M⊙ depending on which of two volumes the galaxy is drawn from. Details of the halo selection process and the simulation parameters may be found in Few et al. (2012) and in Sect. 2.2, below.
2.2 RaDES assembly histories
The assembly histories of the RaDES galaxies have been obtained by a careful study of the merger trees discussed in Few et al. (2012). In short, we use the adaptahop algorithm (Aubert et al., 2004) to create at each time step a catalogue of haloes and sub-haloes in the simulation. We are able to identify, not only each halo, but also their progenitors, descendants, sub-haloes, etc. By linking all these catalogues, we can create merger trees for the different haloes following the “most massive substructure method” (Tweed et al., 2009). The analysis of those merger trees shows that all RaDES galaxies display, generally speaking, similar disc assembly histories in terms of phases or stages.
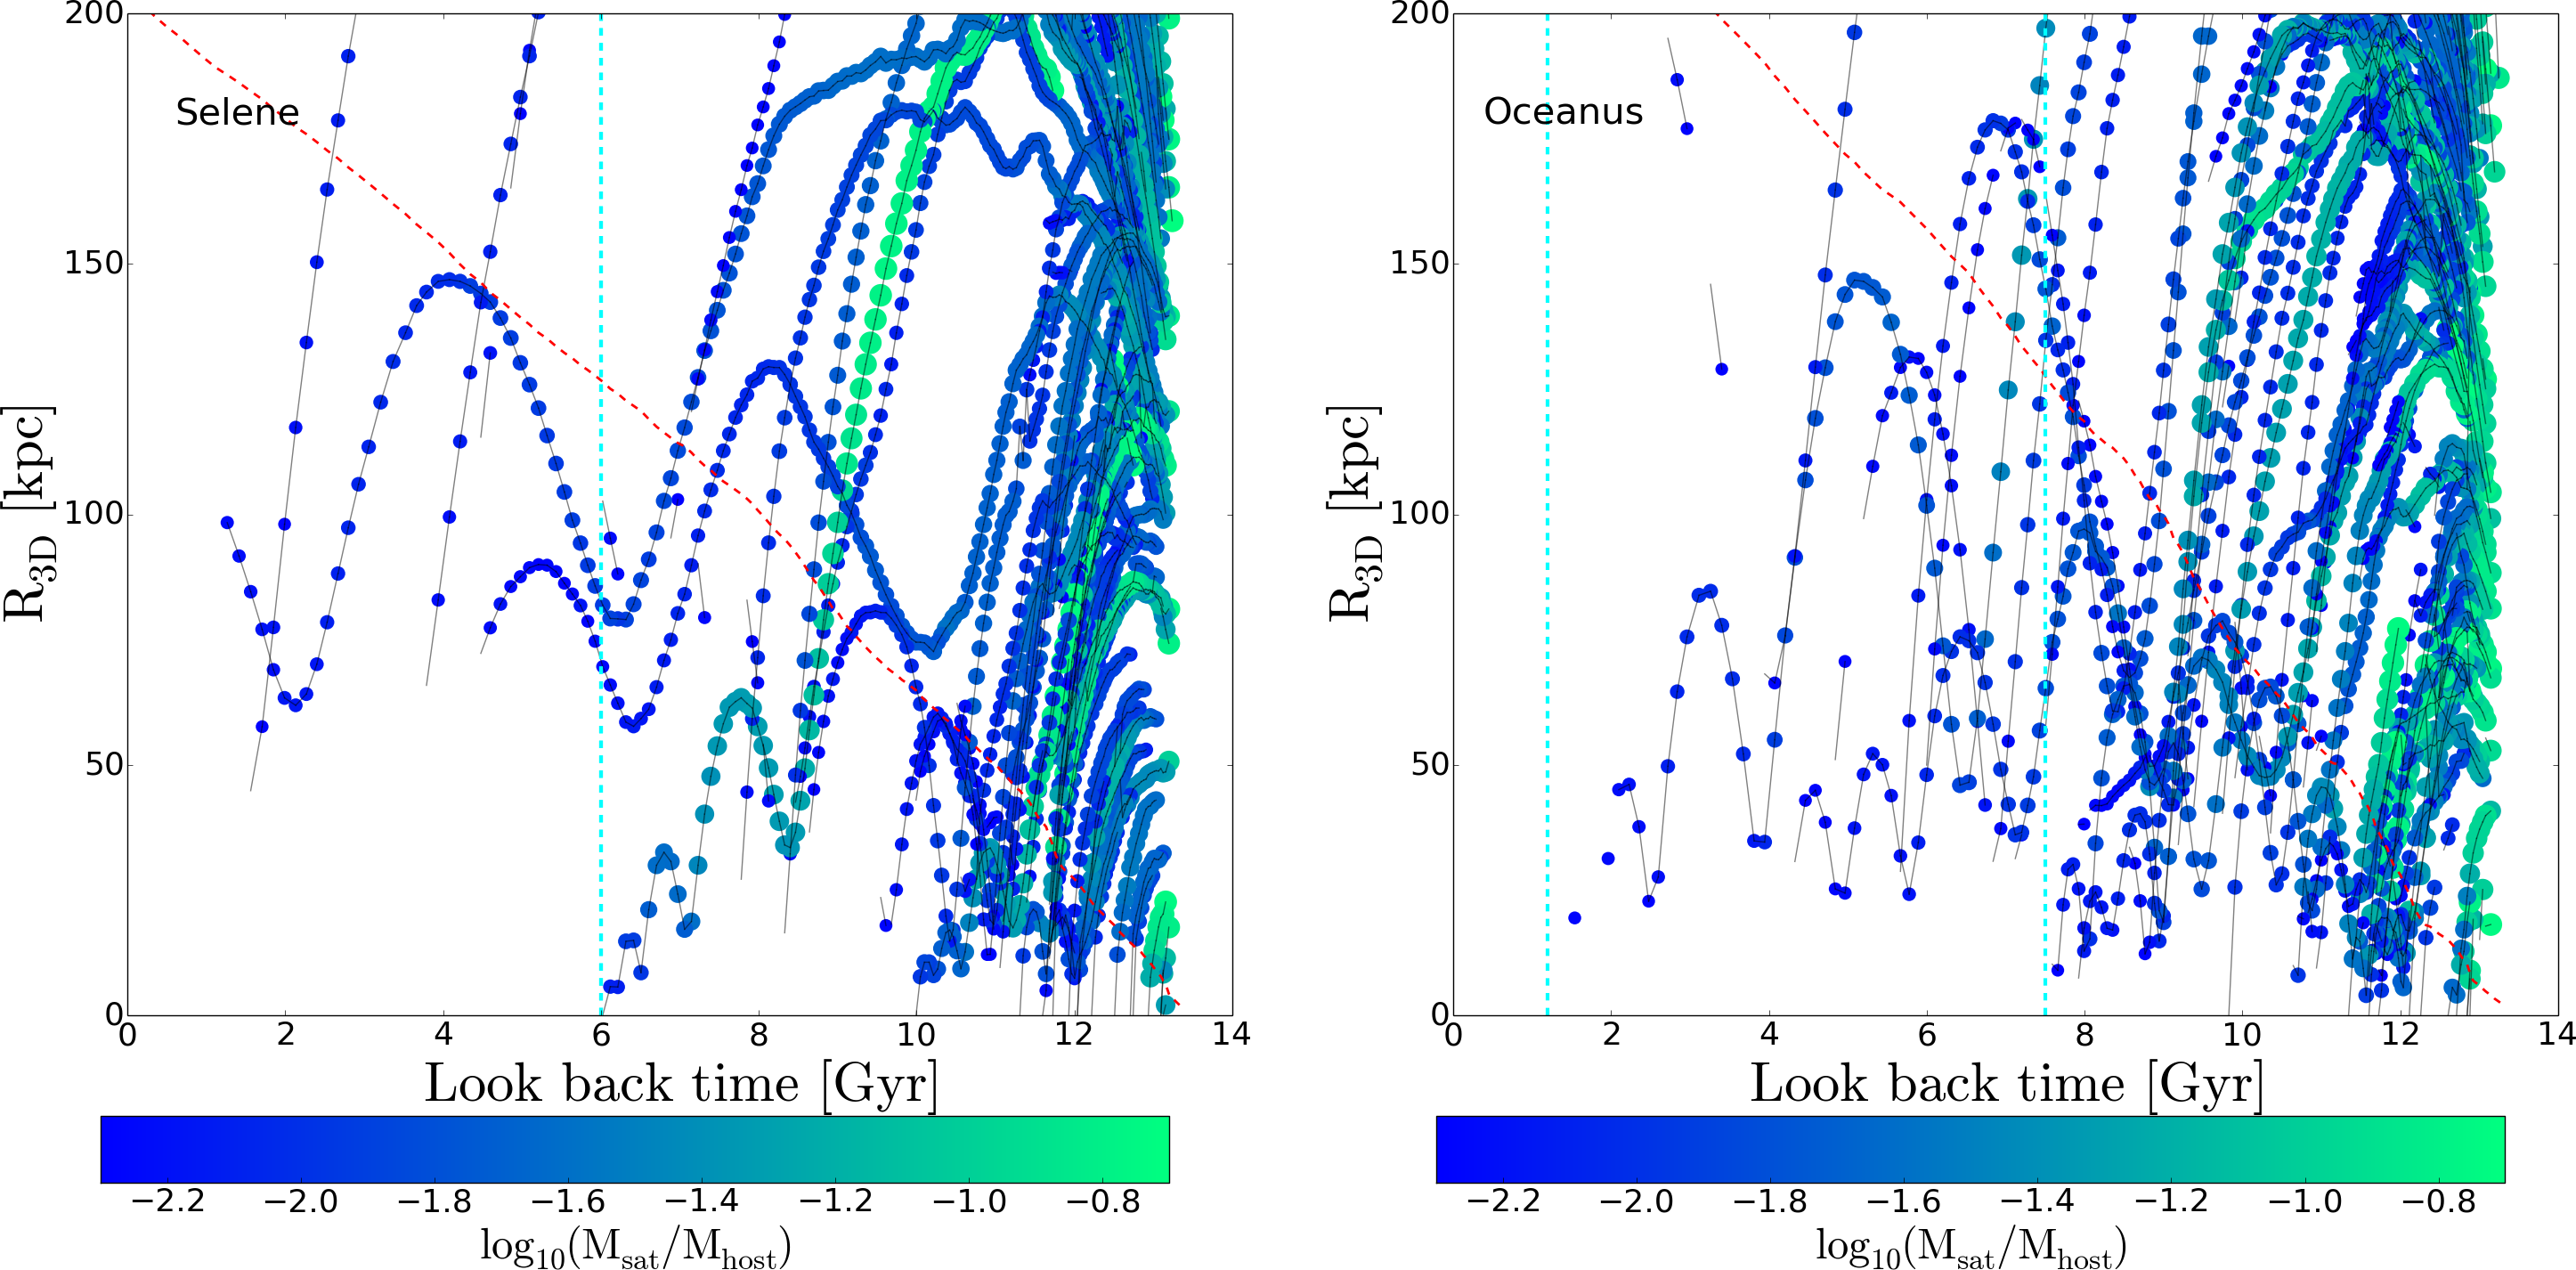
In Fig. 1, we plot the distance between the centre of the host galaxy and its satellites for two RaDES galaxies as a function of lookback time (Selene, left panel; Oceanus, right panel). Each point in Fig. 1 represents one satellite at a given timestep with the points colour-coded in logarithmic scale according to the virial mass of the satellite divided by the virial mass of the host halo (). All RaDES galaxies underwent three well-defined assembly ‘phases’: i) an initial phase of merger-dominated evolution lasting 3.20.4 Gyr on average, while mergers of systems with similar masses occur, (when the distance to the host galaxy is lower than 5 kpc) ranging from 0.1 (the majority) to 3 (several of them). This first period is followed by ii) a quieter phase where the number of mergers is minimised by a factor of two with respect to the previous stage. During this phase (lasting 4.42.0 Gyr) several major satellites with = 0.01–0.3, merge with the host galaxy. This epoch ends with a last merging event, occurring at different times depending on the galaxy in question. We refer to this stage in the galaxy’s evolution as (see Table 1), defined as the time at which this last merger dissolves in the host galaxy. Finally, iii) the disc settles and evolves “secularly”, with just minor satellite mergers ( ¡ 0.01) disturbing the host disc (lasting 5.52.0 Gyr).
This last accreted satellite is characterised by a value of 0.12 0.09 at the time it enters the virial radius () and 0.013 0.006 (averaged values) when it merges at (). All the characteristics of these latest mergers are shown in Table 1.
While most of the galaxies exhibit just one merger epoch (phases i and ii) followed by a quiescent phase (phase iii), some others show two different merging events (two phases ii) with the above outlined characteristics. After the first merger event (), phase ii does not end, but continues until a second event takes place (). Artemis and Oceanus are examples of such behaviour (see right panel of Fig. 1).
Fig. 1 shows the satellites affecting the discs of Selene and Oceanus as two examples of the above outlined behaviour (one-merging-epoch and two-merging-epochs galaxies, respectively). For resolution/aesthetic purposes, we have applied a cut in Fig. 1 to remove the more insignificant satellites, i.e. below 0.005. We have checked that those satellites not fulfilling our criterion have low masses, and thus, little influence in the disc evolution. For Selene, during the first 3.5 Gyr the evolution is characterised by an unsettled phase dominated by satellite accretion (phases i and ii). The lack of important mergers is the main characteristic during the rest of the simulation, although some low mass satellites do orbit the host. The last important merger that Selene underwent took place 6.0 Gyr ago () with 0.089 and 0.0126. In the case of Oceanus (two-merging-epochs), the unsettled phase lasts for almost 6 Gyr, finishing with a satellite with 0.056 and 0.006 (at 7.5 Gyr). After that, a 6 Gyr quiescent-phase follows with several low-mass satellites remaining isolated from the host disc, followed by another merging episode 1.2 Gyr ago with 0.05 and 0.005 ( 1.2 Gyr).
In the next Sects. 3 and 4, we will concentrate on the effect that such assembly histories produce on the RaDES galaxies.
| (Gyr) | |||
|---|---|---|---|
| Apollo | 3.5 | 0.112 | 0.0125 |
| Artemis (a) | 7.5 | 0.063 | 0.01 |
| (b) | 1.75 | 0.126 | 0.01 |
| Atlas | 5.0 | 0.05 | 0.0126 |
| Ben | 6.0 | 0.223 | 0.031 |
| Castor | 8.0 | 0.004 | 0.0015 |
| Daphne | 2.0 | 0.1 | 0.0126 |
| Eos | 7.5 | 0.063 | 0.011 |
| Helios | 8.5 | 0.1 | 0.01 |
| Hyperion | 7.5 | 0.050 | 0.01 |
| Krios | 4.5 | 0.063 | 0.0126 |
| Leia | 7.5 | 0.125 | 0.019 |
| Leto | 1.2 | 0.316 | 0.0178 |
| Luke | 2.0 | 0.125 | 0.01 |
| Oceanus (a) | 7.5 | 0.056 | 0.006 |
| (b) | 1.2 | 0.05 | 0.005 |
| Pollux | 5.5 | 0.281 | 0.019 |
| Selene | 6.0 | 0.089 | 0.0126 |
| Tethys | 6.5 | 0.25 | 0.0251 |
| Tyndareus | 4.0 | 0.316 | 0.012 |
| Zeus | 4.0 | 0.039 | 0.011 |
3 Discs characteristics
3.1 Disc decomposition
One of the classic problems plaguing the simulation of disc galaxies in a cosmological context is the overproduction of stars associated with the spheroid (bulge and/or halo). Significant advances have been made over the past decade in ameliorating this problem, although this manifestation of the classical over-cooling and angular momentum catastrophe problems has not yet been fully eliminated. Instead, as is standard practice in the field, we post-process the simulations to mitigate the contamination of the disc by spheroid stars.
To separate the disc from the spheroid component, we apply a kinematic selection criterion based upon the circularity (/) distribution (e.g. Scannapieco et al., 2009; Stinson et al., 2010). We have labelled disc stars as those with circularities ranging from to ; in this way, we ensure we are considering particles on circular orbits in the plane of the disc. Although different selection criteria can be found in the literature (e.g. Sánchez-Blázquez et al., 2009; Few et al., 2012; Pilkington et al., 2012a) ending with subtly different sub-sets of ‘disc’ particles, we have checked that our results are robust to the specific selection criteria. While our chosen circularity criterion might appear restrictive, the characteristics of the discs so defined (mass, age, and metallicity profiles, etc.) are consistent with those of observed galaxy discs.
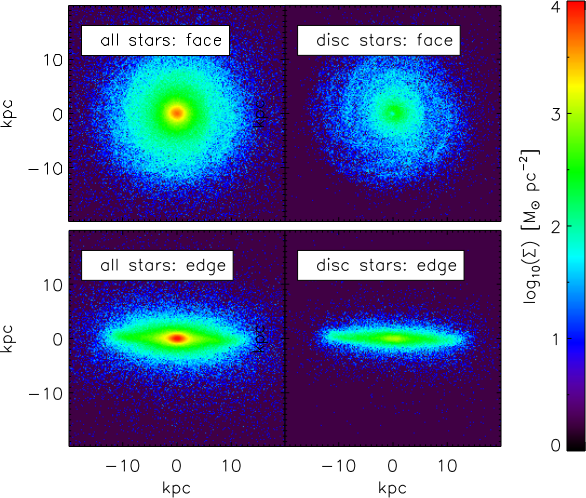
Figure 2 shows the spatial distribution of the stellar particles for Selene when our kinematic criterion is applied (right) compared to the distribution when all the particles are represented (left). A careful inspection of the edge-on views allows us to conclude that our criterion properly clean our discs from the spheroid component. The thick disc is not strictly spatially resolved in these simulations and our disc selection is an aggregate thick and thin disc. The face-on view of this particular galaxy highlights some disc characteristics such as the spiral structure and we conclude that our strict selection of disc particles allows us to perform our analysis without contamination by halo stars.
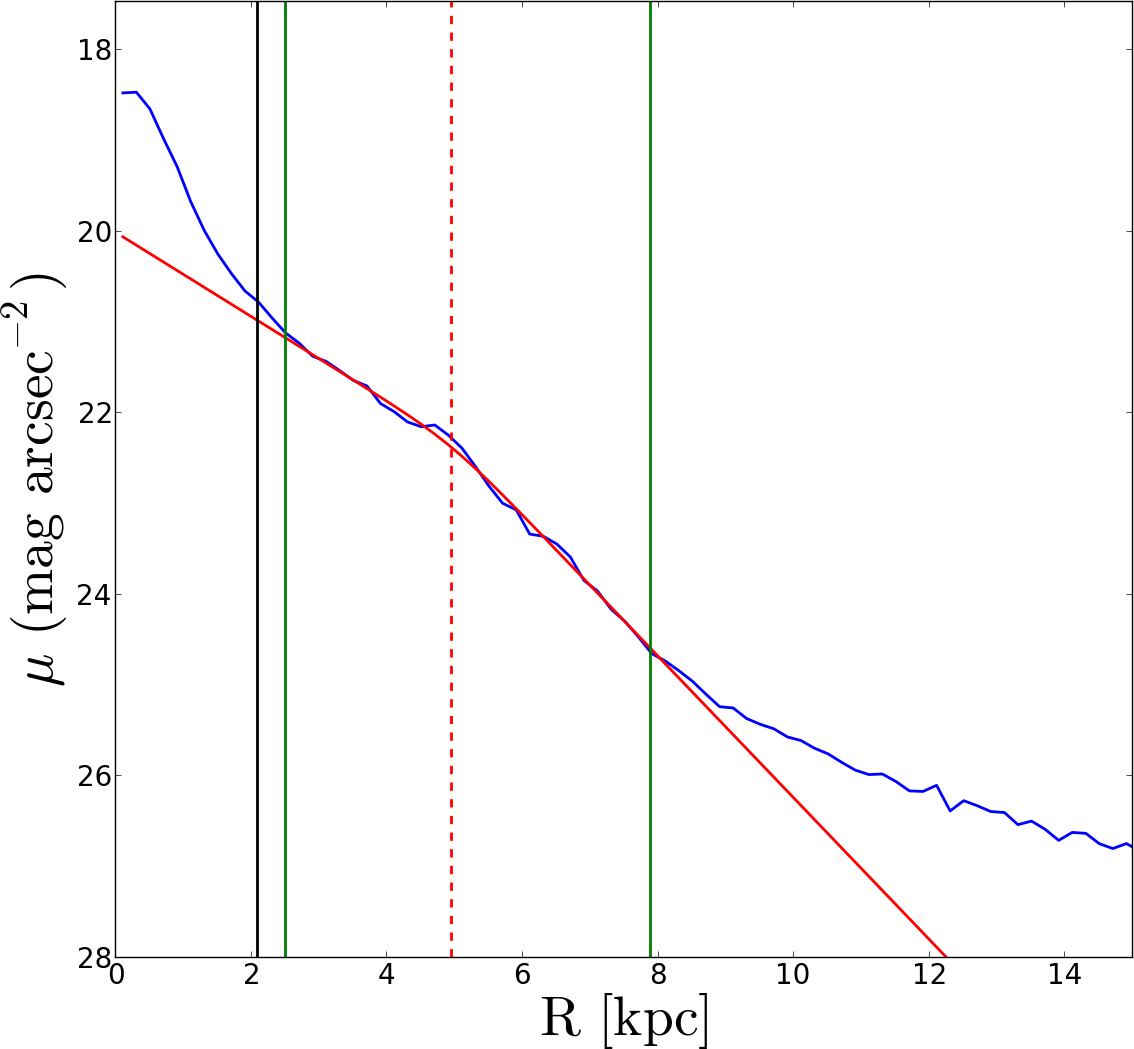
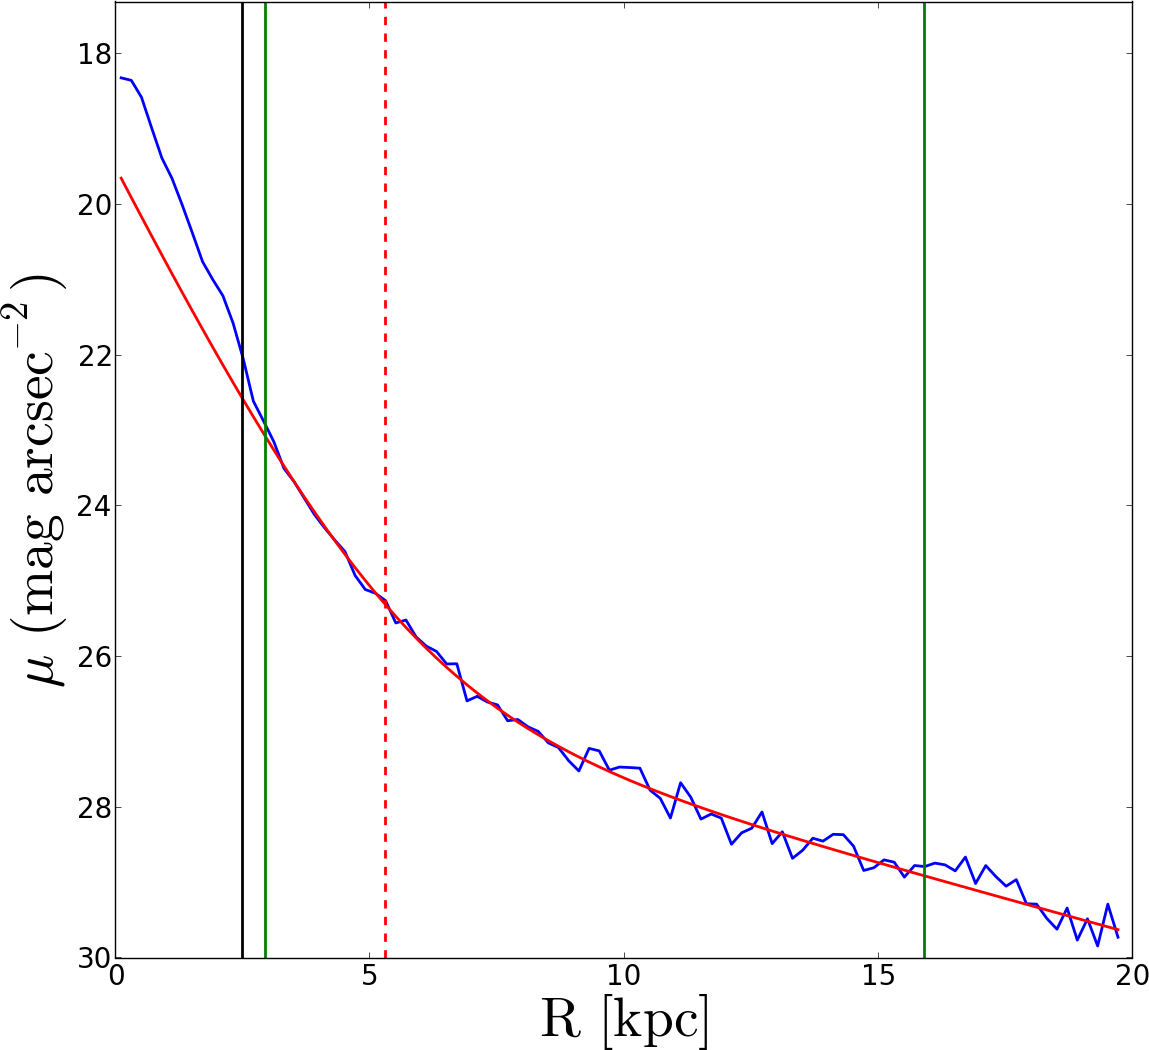
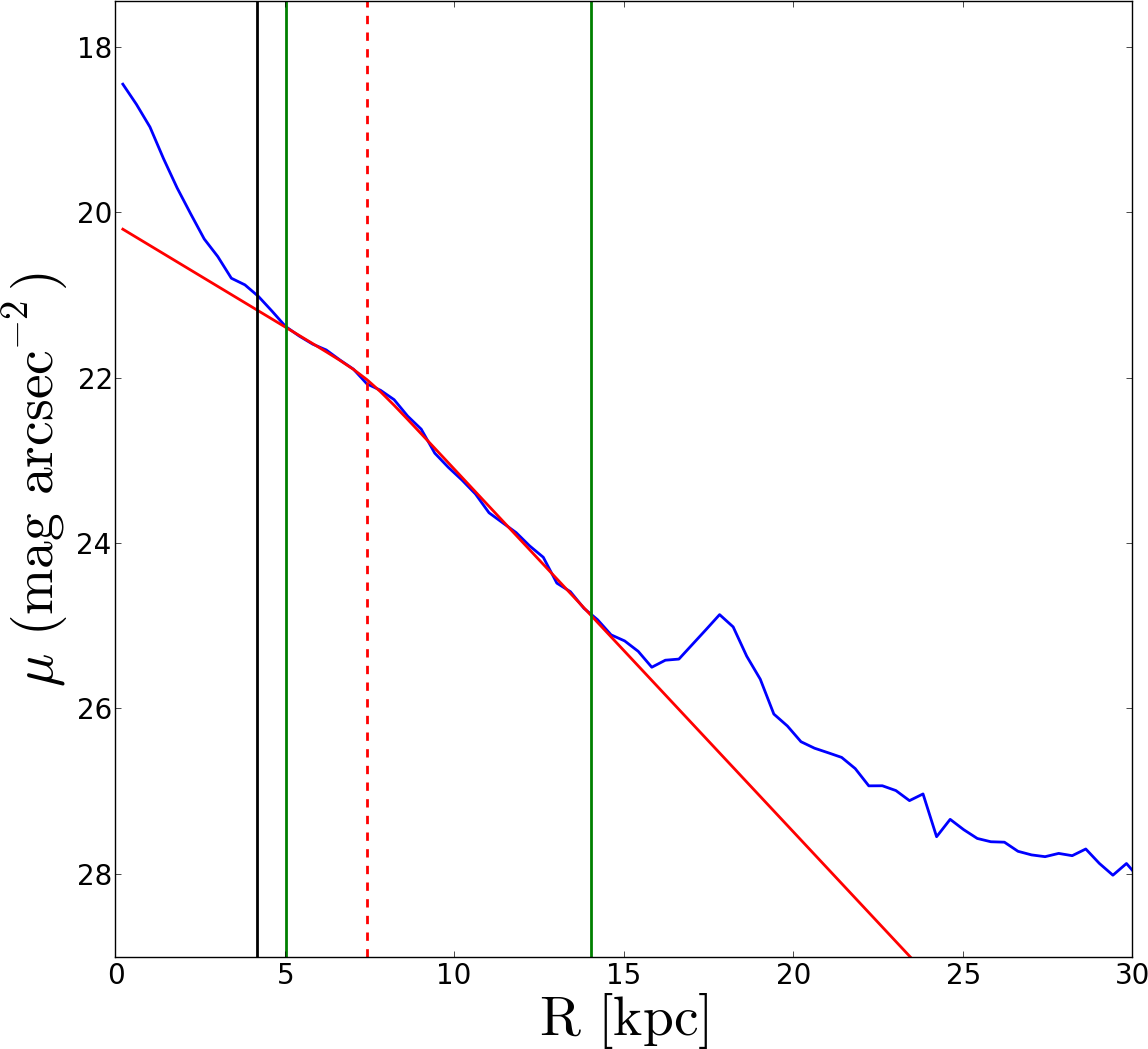
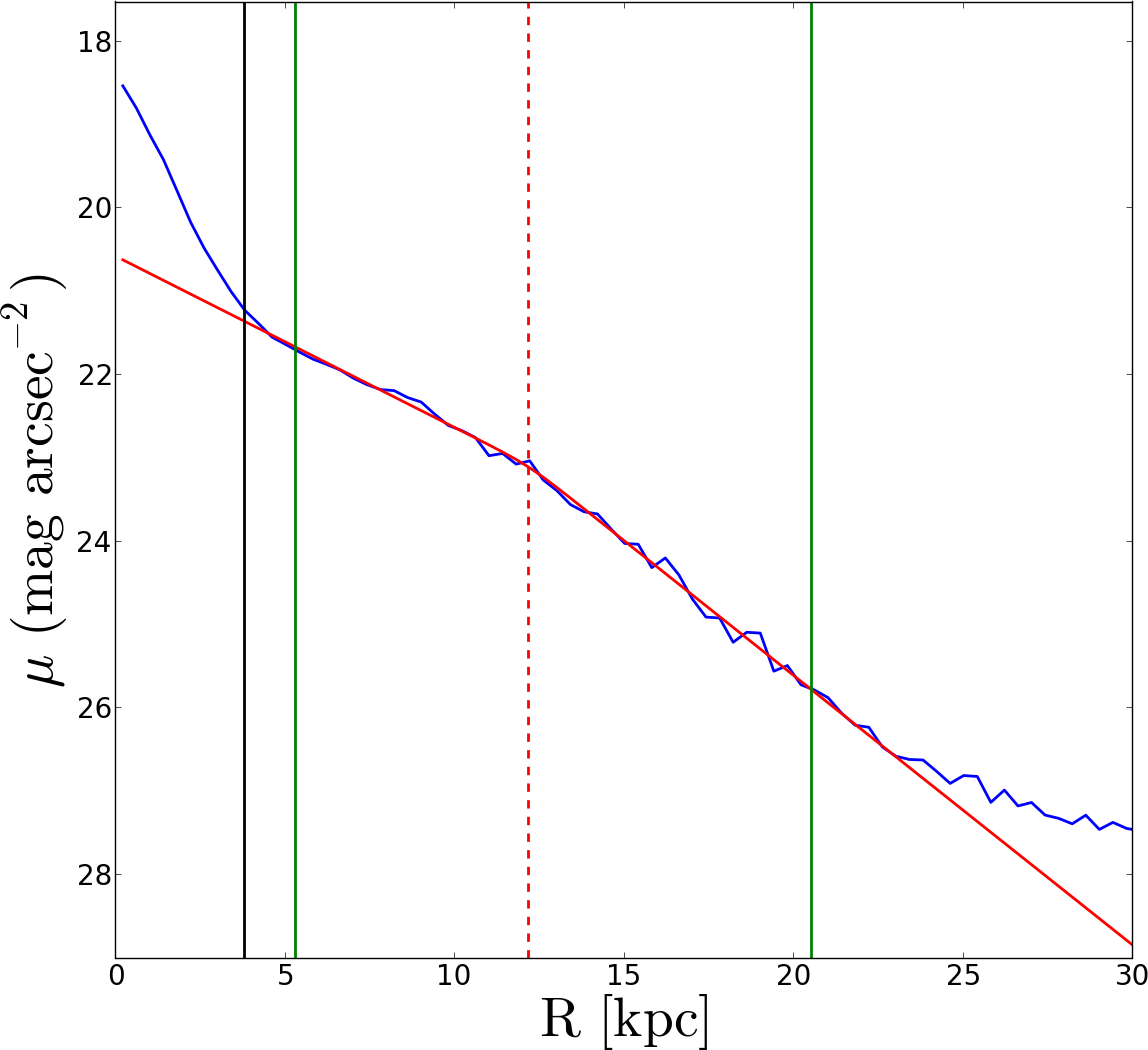
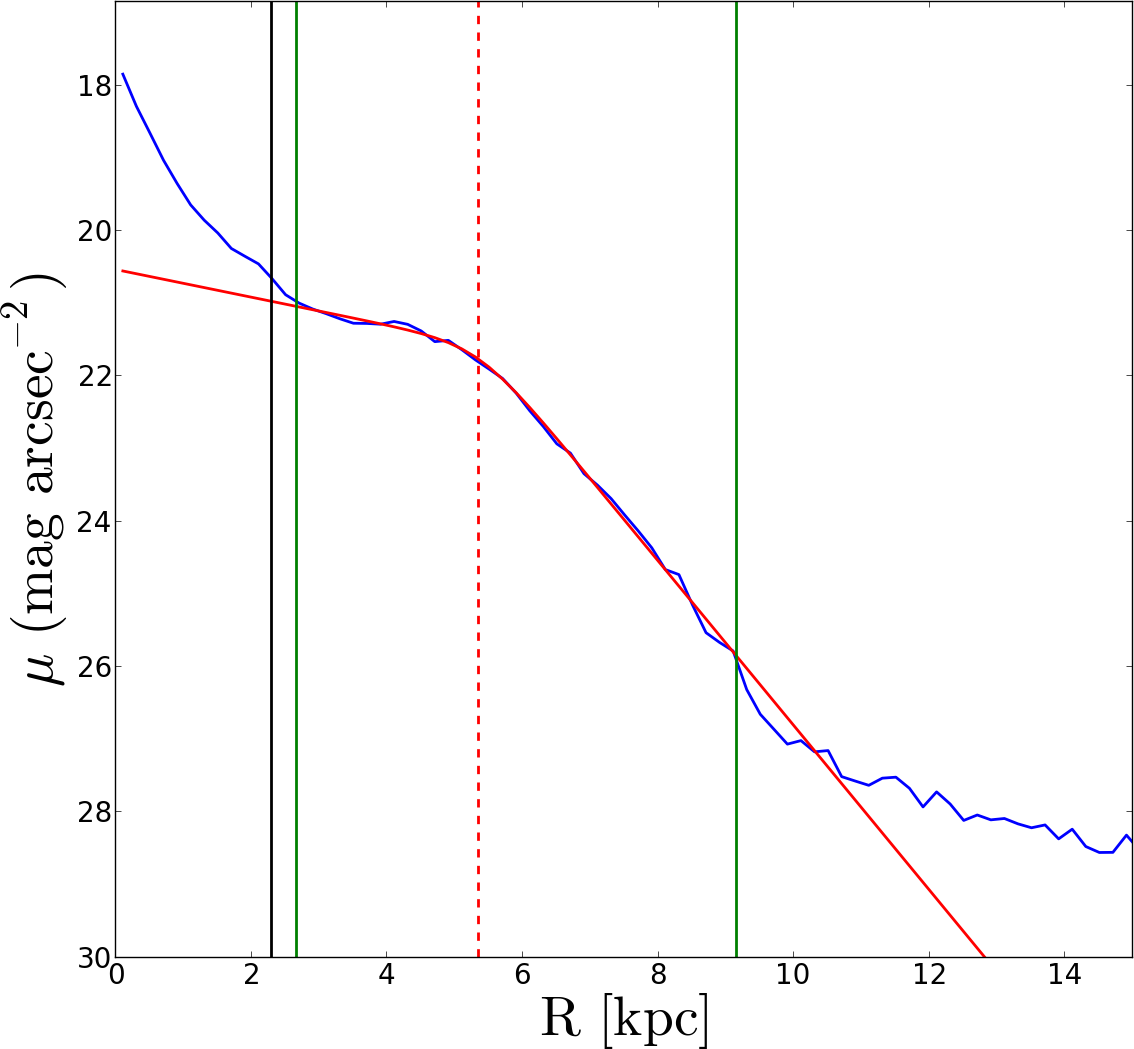
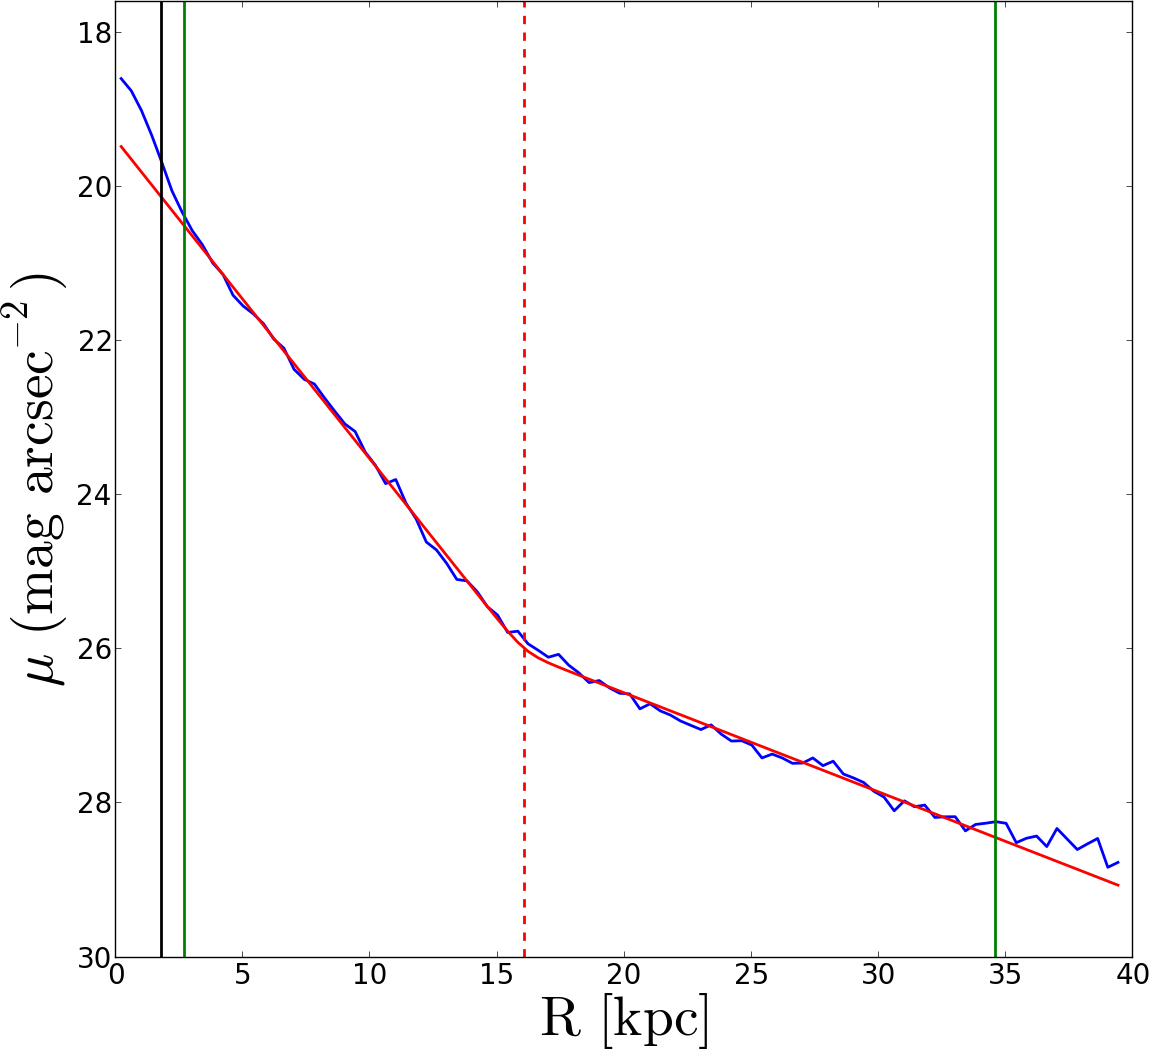
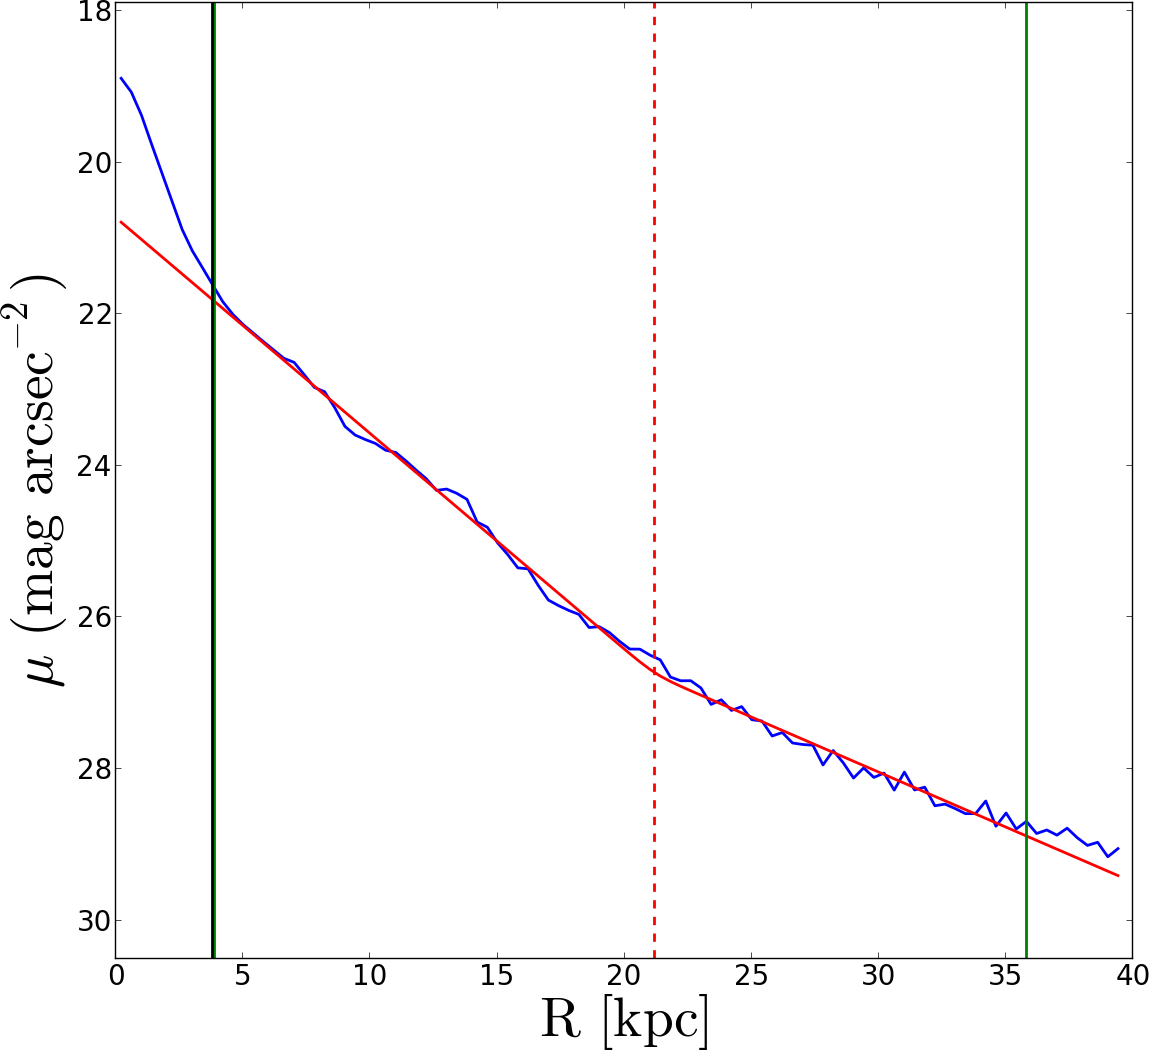
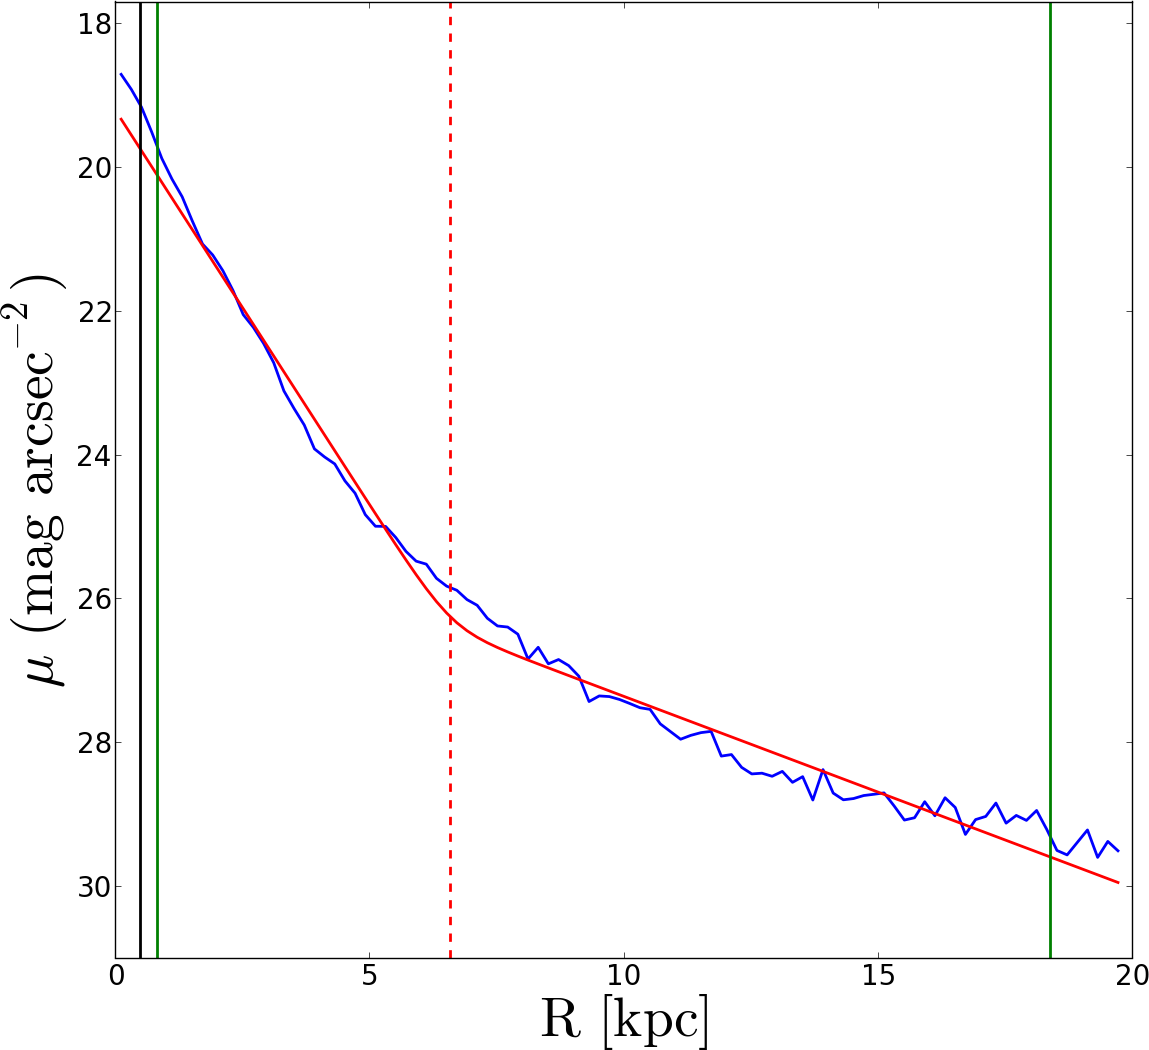
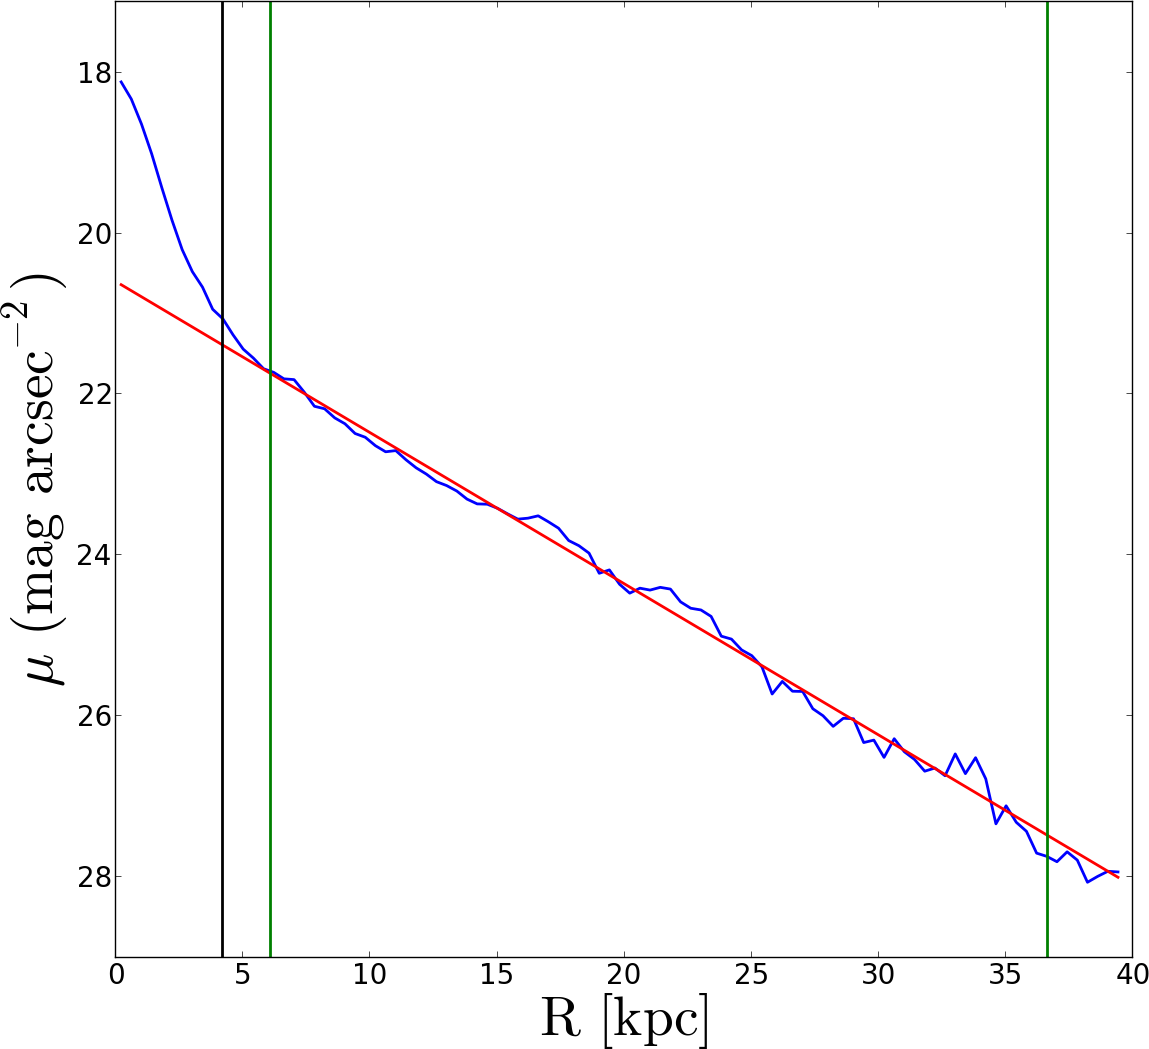
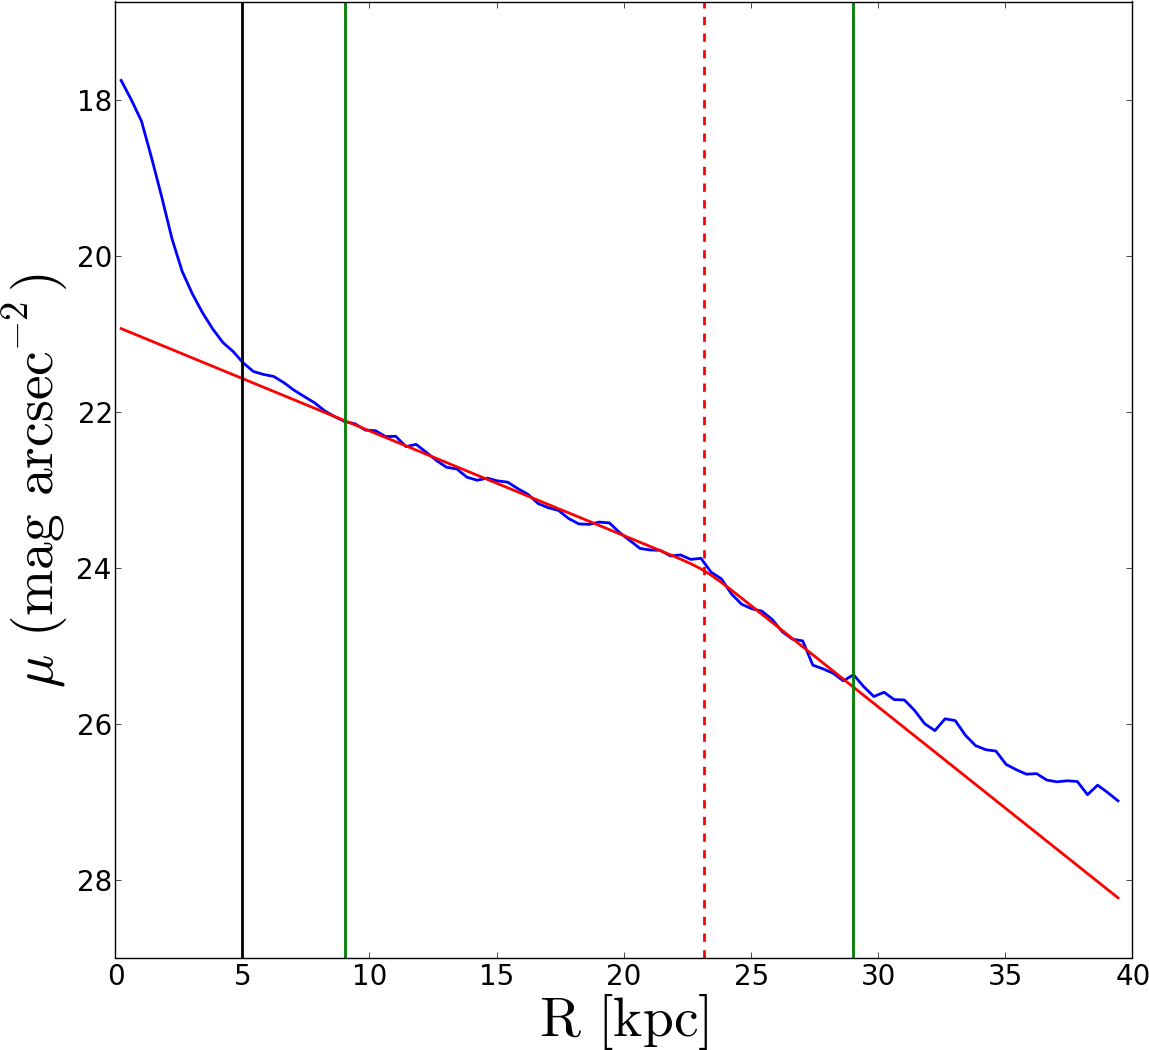
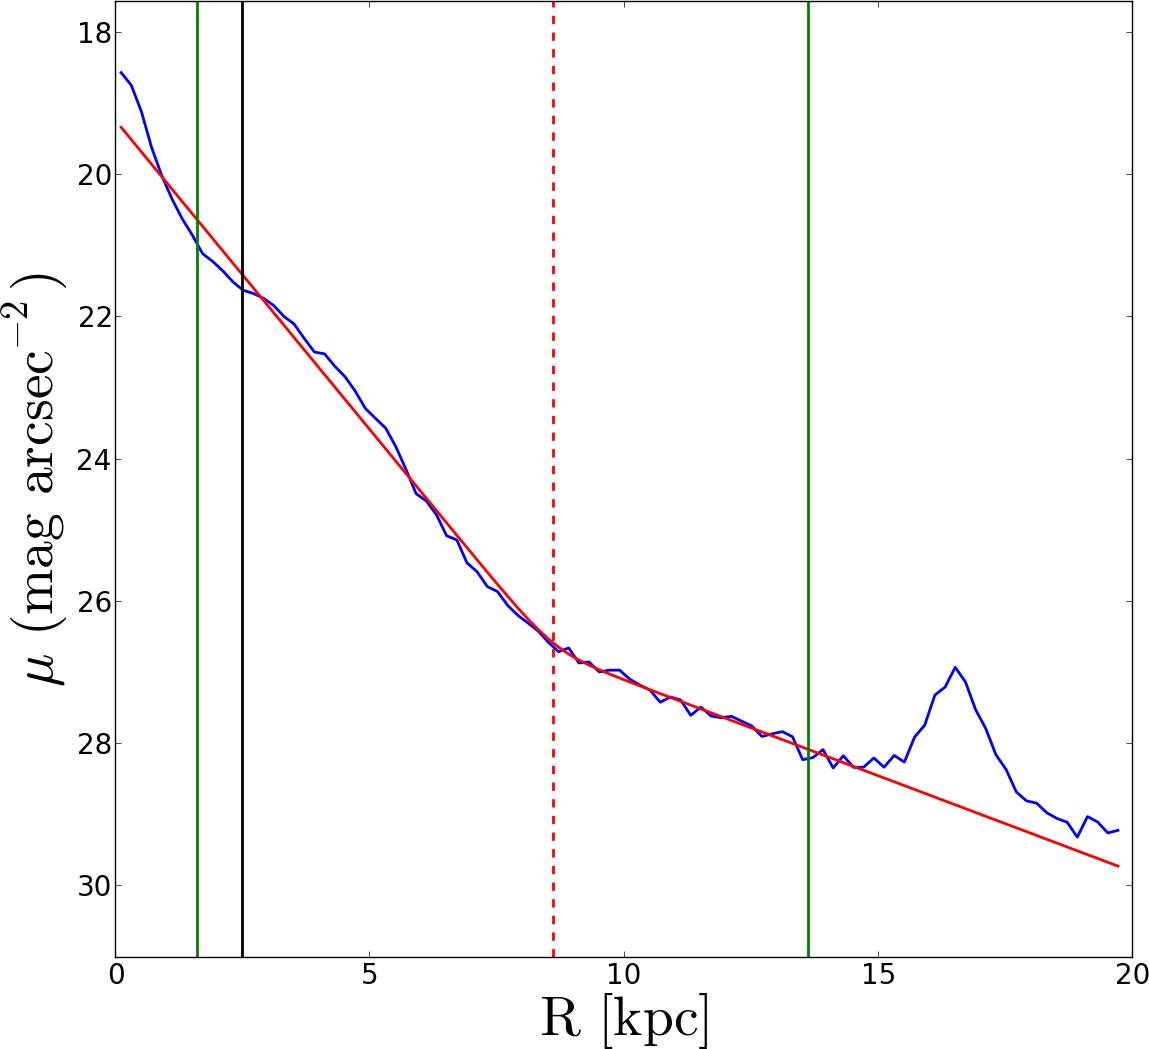
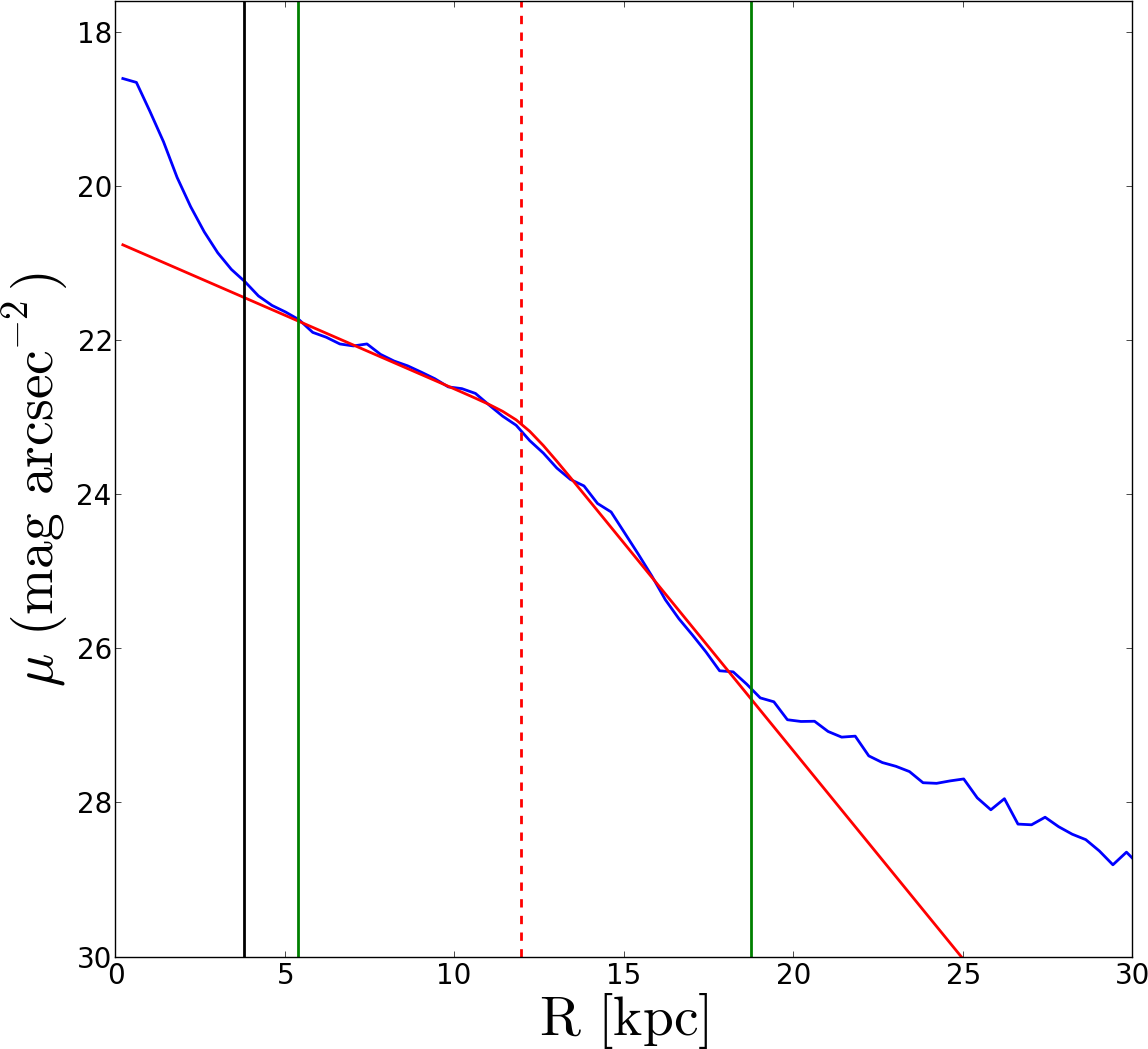
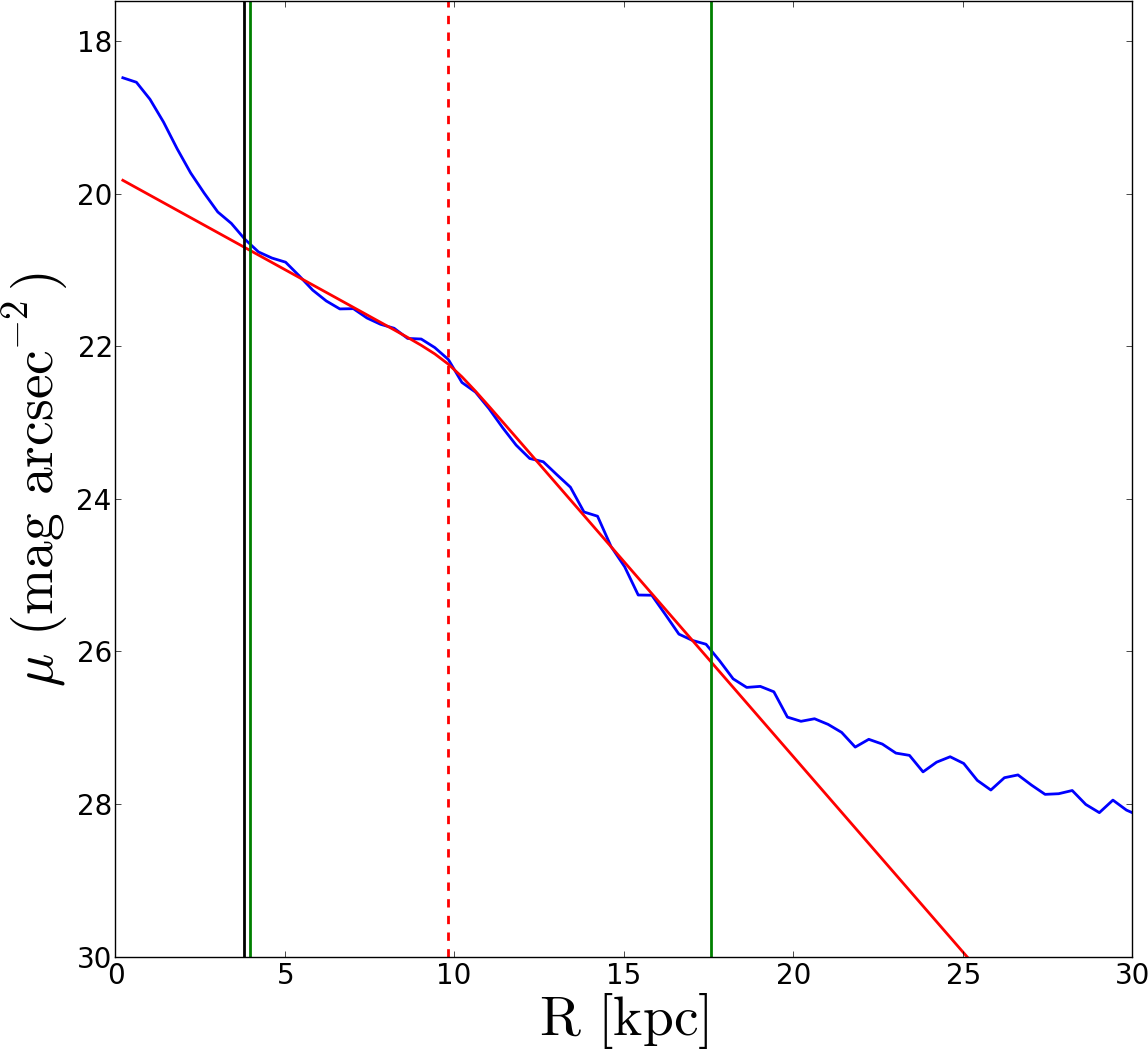
To spatially sample each disc’s characteristics from the inner to the outer disc, we have scaled each one to the radius corresponding to a stellar mass surface density of (hereafter ); this ‘normalisation’ corresponds to the typical ‘break radius’ in the surface density profile of disc galaxies (e.g. Roškar et al., 2008b; Sánchez-Blázquez et al., 2009), and has been chosen as useful scaling, but does not impact on the conclusions whatsoever. We study four radial regions (see Table 2 and Sects. 3.3, 3.4, and 4), defined as i) inner, this region accounts for the particles in the inner disc scale length () obtained analysing the SDSS r-band mock images from SUNRISE (Jonsson, 2006); the images generated by SUNRISE can be seen in Few et al. (2012) (see Appendix A for further information); ii) middle disc, this is a -width region around ; iii) outer disc, -width region around ; and iv) outskirts, 3-width region around + 2 . We apply these spatial cuts for every galaxy, avoiding overlap between regions. We have followed the same approach for every RaDES galaxy, with no assumptions regarding the surface brightness profile of the discs. Again, we tested various ways of radially scaling our discs and the results are not contingent upon this convenient normalisation.
| Regions | General | Selene | Oceanus | |||
|---|---|---|---|---|---|---|
| Lower limit | Upper limit | Lower limit | Upper limit | Lower limit | Upper limit | |
| [kpc] | [kpc] | |||||
| (1) | (2) | (3) | (4) | (5) | (6) | (7) |
| 1 | 0.0 | 0.00 | 5.67 | 0.0 | 8.07 | |
| 2 | /2 - /2 | /2 + /2 | 5.67 | 8.59 | 8.07 | 11.09 |
| 3 | - /2 | + /2 | 8.67 | 14.34 | 11.09 | 18.14 |
| 4 | + 0.75 | + 3.5 | 15.75 | 31.35 | 20.15 | 42.35 |
3.2 Stellar age and metallicity distribution of disc stars
Different groups have tried to study, both observationally and theoretically, the properties of the stellar populations as a function of radius in spiral galaxies. In Roškar et al. (2008a), using N-body + SPH simulations of an isolated and idealised disc, the authors generated age profiles with a characteristic “U-shape” attributed to radial migration induced by transient spiral arms. On the other hand, Sánchez-Blázquez et al. (2009), using fully-cosmological hydrodynamical simulations, also found such an age profile in their simulations, but proposed the combination of two different processes to explain it: i) a radial change in the star formation history linked to a drop in the gas density (itself, due to a warp) as the main cause and ii) radial migration of stars towards larger radii; it is important to note though that said U-shaped age gradient was found even in the absence of radial migration. Observationally, Bakos et al. (2008) stacked the SDSS data from Pohlen & Trujillo (2006), obtaining a clear U-shaped colour profile for type II galaxies (those showing a down-bending surface brightness profile). However, this work has two main disadvantages: i) it is based on stacked profiles and a careful study of individual galaxies show that not all of them display this inversion in the age profile, nor the minimum in age (colour) located at the break radius (Roediger et al., 2012); and ii) as they use colour profiles, it is highly affected by the age-metallicity degeneracy, so the colour cannot be interpreted either as the age or the metallicity of the stellar populations. The difficulty of obtaining good spectroscopic data in the outer parts of the spiral galaxies to minimise the age-metallicity degeneracy (e.g. Ganda et al., 2009) has hampered the study of reliable stellar age profiles reaching beyond the break radius. Yoachim et al. (2012) studied the stellar content of 12 spiral galaxies using Mitchell Spectrograph IFS data (Hill et al., 2008). They obtained U-shaped age profiles in three out of the six galaxies they were able to study beyond their break radius. Currently, we are analysing the stellar content focused on the outer parts of the CALIFA galaxies (Sánchez et al., 2012) obtaining no clear relation between the occurrence of U-shape age profiles and their surface brightness profiles (Ruiz-Lara et al., 2016).
A recent study has carefully analysed the stellar content in the outer parts of M31 by means of 14 resolved fields (Bernard et al., 2015). They find that the outermost fields show that a significant fraction of their mass had already formed by z 1, while fields a bit closer to the centre are on average younger. They suggest this is the consequence of a complicated galaxy evolution due to mergers. The study of age and metallicity profiles in simulated galaxies as well as more observational effort will help us to better understand the behaviour of the stellar age in the outer parts of spiral galaxies.
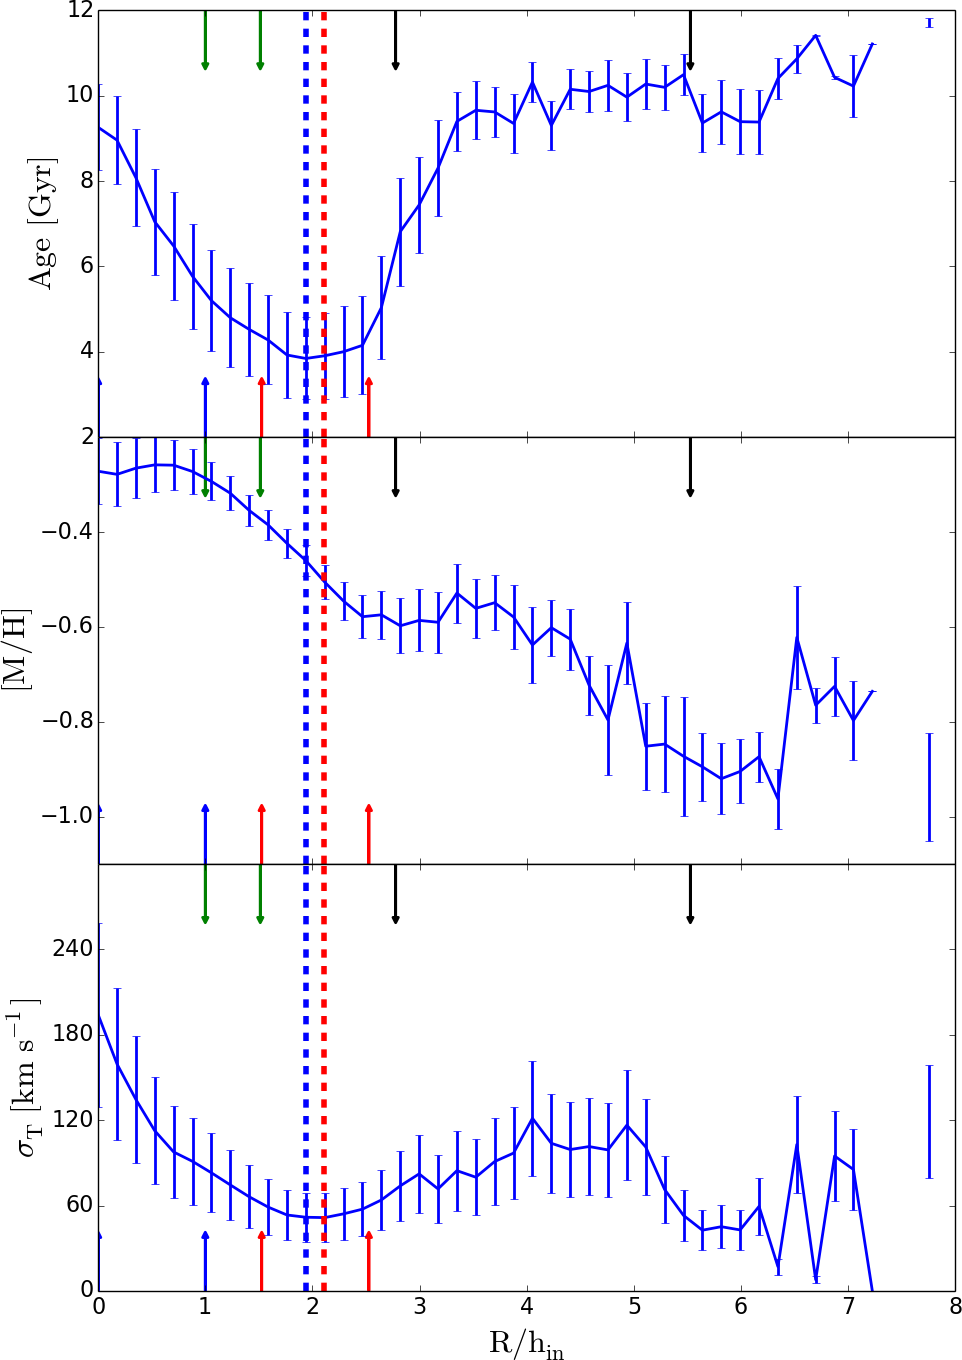
With such purpose, we have studied the age and metallicity distribution of the RaDES galaxies’ discs by means of one-dimensional profiles. We obtain those profiles by applying a mass-weighted average to all disc particles within 0.5 kpc-wide radial bins. Fig. 3 shows the age, metallicity, and velocity dispersion profiles characterising the disc of one such galaxy, Selene. Each of the 19 analysed galaxies show similar profiles regardless their morphology and characteristics: i.e. negative mass-weighted metallicity gradients, and U-shaped mass-weighted age profiles. For all of them, the radius where the minimum in age is reached is roughly located in region 3. The outermost parts of every galaxy show an extended, old plateau (older than 10 Gyr, beyond 6.4 hr). The metallicity profiles show a flattening in the centre, mainly caused by the low metallicity of the older stars populating the inner region of our discs (see Figs. 5 and 7). These profiles will be extensively analysed in Sect. 5.1.
In addition to the age and metallicity profiles, we have obtained the velocity dispersion profiles (bottom panel of Fig. 3) for each of the above defined RaDES discs. They also show a U-shaped form. In fact, there is a correlation in the shapes of the age and velocity dispersion profiles, with the minimum of both distributions located roughly at the same radial position. This is related to the age-velocity dispersion relation expected for galactic discs (discussed in the following section) where, in general, younger stars have lower velocity dispersions. As stars age they are heated by the effect of the galaxy dynamics and/or satellites (see Fig. 4). This aspect might deepen the U-shape age profile as the stars that are being born at the minimum age radius have less time to move away and make other regions younger, on average. Similar U-shapes in the velocity dispersion profiles have been found in the Villalobos & Helmi (2008) simulations, as the consequence of the accretion of a discy satellite with an initial orbital inclination for the satellite with respect to the mid-plane of the host disc of 30∘ (they obtain similar results using spherical satellites and an orbital inclination of 60∘).
3.3 Age-velocity dispersion relation

In the solar neighbourhood of the Milky Way, the stellar velocity dispersion increases with the stellar age, however the exact shape/behaviour of the relationship remains a matter of debate (e.g. Wielen, 1977; Binney et al., 2000; Seabroke & Gilmore, 2007). Nordström et al. (2004) made use of the Geneva–Copenhagen Survey to study the Age-Velocity dispersion Relation (AVR) in the solar neighbourhood. They studied each velocity component separately, finding that power laws can fit the relation found in every direction. They interpreted those results as evidence for a continuous heating of the disc. Conversely, several works have found some saturation in the V and W velocity dispersion components (Soubiran et al., 2008). Aumer & Binney (2009), using Hipparcos and Geneva–Copenhagen data, were not able to rule out such saturation for stars older than 4 Gyr, combined with an abrupt increase in velocity dispersion for the oldest stars. Martig et al. (2014), based on seven simulated galaxies, proposed continuous heating takes place to explain the slope of the AVR for stars younger than 8-9 Gyr, but also found a step in the AVR for the oldest stellar population, related to an early merger phase. The authors showed that the maximum in is strongly decreased when age errors of 30% are implemented, suggesting that observations can easily miss such a jump with the current accuracy of age measurements. Although hard to distinguish among the different heating agents (e.g., bars, spirals, mergers, and stars born hot at high redshift), Martig et al. showed that radial migration does not heat the disc, in agreement with Minchev et al. (2012b) and Vera-Ciro et al. (2014).
To confront our simulations with both the existing empirical and model AVRs, in order to identify the heating mechanisms underpinning RaDES, in Fig. 4 we show how the stellar radial velocity dispersion varies as a function of stellar age for three of the RaDES galaxies (Apollo, Selene, and Oceanus). We study this relation in the four different regions outlined earlier (Sect. 3.1). The behaviour for the individual velocity components (R, , and ) parallels that of Figure 9 of Few et al. (2012). The shape of the AVR is quite similar across the four regions suggesting that heating is consistent over the entire disc, albeit, there are qualitative differences in the strength of this heating as a function of radius.
The most remarkable feature we can find in these age-velocity diagrams is the presence of an increase in the velocity dispersion values around a given age ( ), a feature that is apparent throughout the entire disc (in the four radial regions). Although for some galaxies this jump in the AVR is smooth (as is the case for Apollo), other galaxies show a clear sudden jump (e.g. Selene and Oceanus, see Fig. 4). Stars older than have larger velocity dispersion than the stars with ages younger than for all RaDES galaxies: this jump is clearly linked to their last important merger (happening at with 0.0126, see Sect. 2.2). This jump is more evident for the outer parts and fades towards the centre; mergers affect the outer disc more strongly because of its lower surface density.
Dashed lines in Fig. 4 represents the AVR at different evolutionary stages in order to appreciate how our galaxies have evolved since the last merger. For Apollo and Selene we show the AVR from 1.49 and 4.34 Gyr ago, respectively. We observe that the AVR taken in the present day and just after the mergers have similar shapes across the 4 regions, i.e. the disc kinematics respond qualitatively the same at all radii. Some differences do exist in how the 4 regions evolve however: in the case of Apollo (the galaxy with the smoothest jump of the three) the AVR was also smooth 1.49 Gyr ago, yet since that time, regions 2–4 have relaxed more than region 1. For Selene, the AVR 4.34 Gyr ago and nowadays are similar in that the step in velocity dispersion exists immediately after the merger and persists to the present day. The differences between the AVR at intermediate evolutionary epochs and the one displayed at present time suggest that, apart from the effect caused by the mergers, secular evolution following the merger clearly affects the final AVR shape (a similar behaviour is displayed by Oceanus).
In the case of Oceanus (see Fig. 4), one of the galaxies where two merger episodes can be identified by its assembly history (see Fig. 1), we can also distinguish two jumps in the AVR. The more recent event presents a more prominent jump, while the earlier one is more subtle because it is ‘swamped’ by the combination effect of the latest merger and secular heating. This swamping of the earlier jump might be caused by a differential heating between cold and hot stars minimising the extant jump, affecting cold stars more than hot ones. To check our hypothesis, in Fig. 4 we show the AVR displayed by Oceanus disc stars 5.75 Gyr ago, i.e. after the first merger event and prior to the second one; while at the end of the simulation, the “jump” at 7.5 Gyr is almost negligible, the AVR 5.75 Gyr ago shows a more prominent “jump” for stars older than 7.5 Gyr being more evident for the inner region. This result favours our idea that the jump experienced by stars older than 7.5 Gyr was caused by a merger event 7.5 Gyr ago but has been partially swamped by the last merger and the subsequent secular heating (especially true for region 1).
We note that major mergers are not the only source of kinematic heating affecting our discs: internal secular evolution processes and other minor mergers can also shape the AVR. These plots do, however, prove that satellite merging is an important heating mechanism affecting the kinematic state of the stars experiencing such events and therefore the AVR.
Another striking point displayed by the AVRs that is worth discussing is the values found for the velocity dispersion. Our velocity dispersions are higher than those observed in the solar vicinity (e.g. Holmberg et al., 2009). Old stars display values as high as twice the value for Milky Way old stars and young stars show those values presented by solar-neighbourhood old stars. It is expected that higher velocity dispersions are found within our simulated discs than for the Milky Way as high velocity dispersions are endemic to almost all of the cosmological simulations of disc galaxies (see House et al., 2011). High velocity dispersions may also be due to contamination of the disc by spheroid stars, however we have minimised that effect by applying our disc particle criterion. Furthermore, none of our galaxies are a perfect match to the Milky Way, so we do not expect the same behaviour as displayed by the Milky Way which has a different assembly histories than the simulated discs underwent.
3.4 Age-metallicity relation
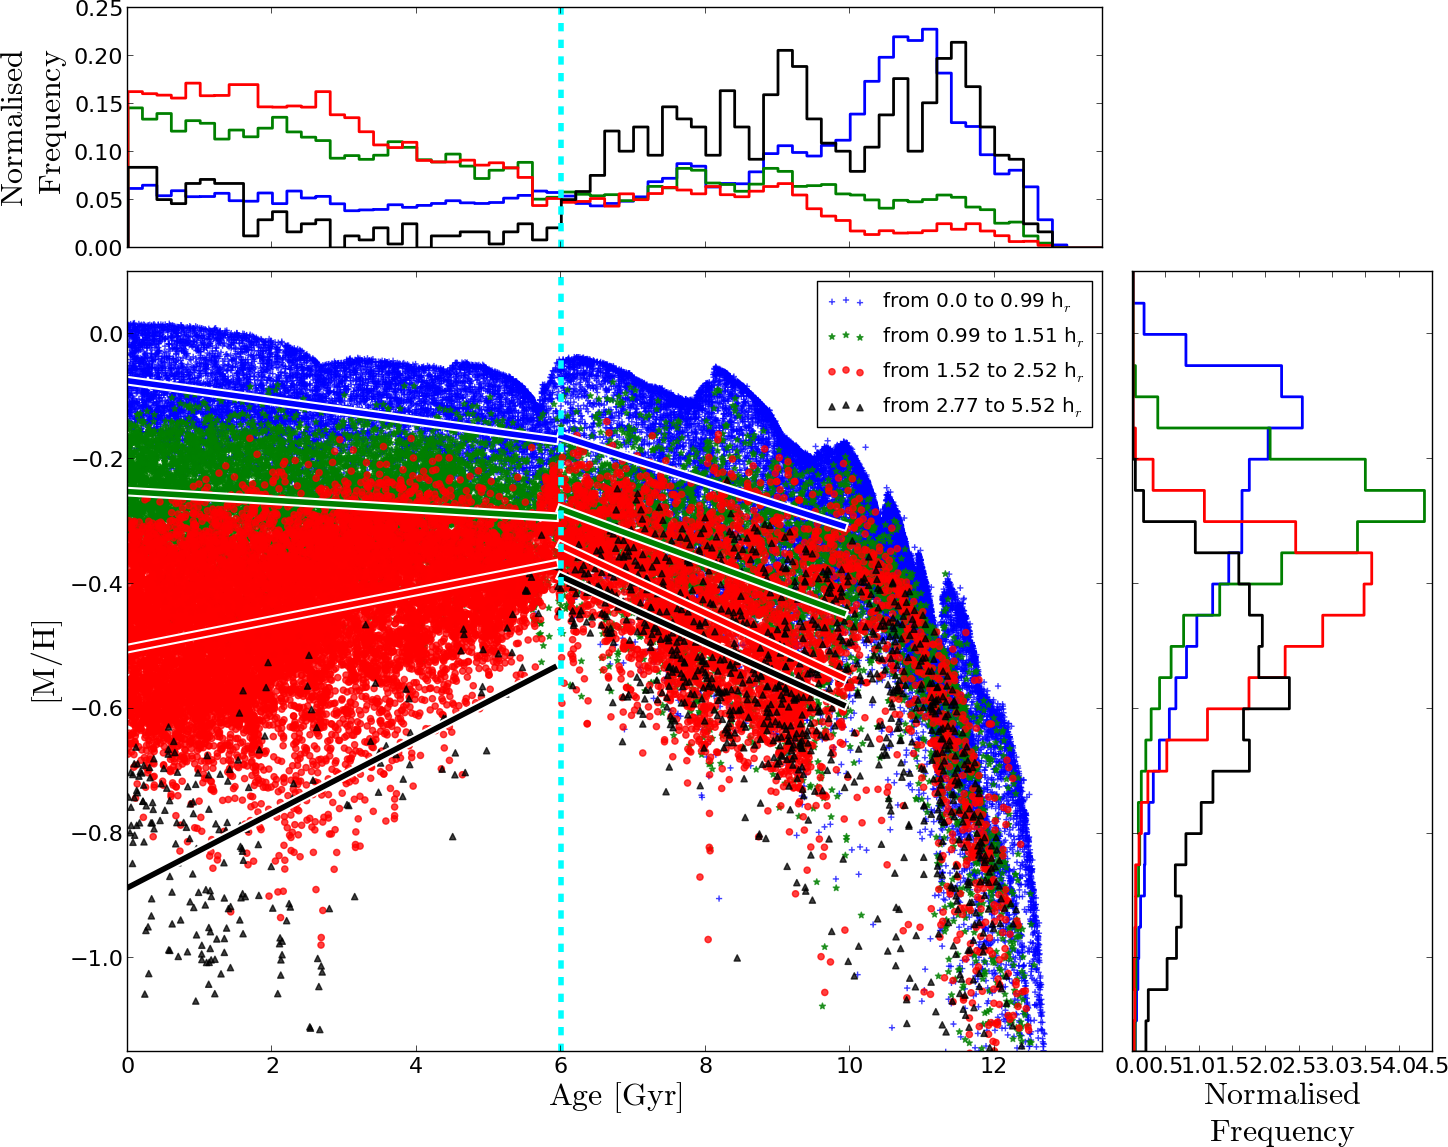

We have analysed the Age-Metallicity Relation (AMR) for the discs of the RaDES galaxies. In Figs. 5 and 7 we show, as two representative examples, the AMR for the Selene and Oceanus disc stars, colour-coded according to their radial location (see Table 2 for the definition of the extent of each region). In these figures we also show the age and metallicity distribution functions for each region (top and right-hand panels respectively). To properly appreciate the details of Fig. 5 we have split such figure in 4 different panels corresponding to the 4 radial regions under study (see Fig. 6).
Common to all the analysed galaxies, the chemical properties of the stars show a different behaviour depending on the assembly history stage they were born in. Figure 6 clearly shows well-differentiated epochs according to the dispersion of the AMR displayed by the stars corresponding to the three-phase assembly history described in Sect. 2.2: stars formed during epoch i (older than 10 Gyr) show very small dispersion while stars born at epochs ii and iii display a larger dispersion at all ages. This tight AMR for old stars is a direct consequence of the origin of old stars, accreted from satellites or formed in the early host galaxy: these environments are spatially small and have comparatively homogeneous metal abundances and enrichment histories. Afterwards, when quiescent phases dominate the mass assembly, the diversity of satellite metallicity increases and the galaxy develops a metallicity gradient that enhances the dispersion of the AMR. The metallicity distribution is also broadened as late-forming satellites with lower metallicities are accreted by the enriched host galaxy. Radial stellar motions also increase the dispersion of each region as stars move from the metal enhanced center of the galaxy and the relatively metal-poor outskirts to other regions. These radial motions tend to affect older populations more strongly (as we will show in Sect. 4.1), yet will only broaden the dispersion of the AMR if stars exist with distinct metallicities in other regions of the galaxy. It is for this reason that radial motions broaden the AMR dispersion for a given region for the epoch ii stars (because a metallicity gradient exists at this time) but does not for epoch i (when the metallicity is quite homogeneous) or epoch iii stars (when less radial migration has taken place, see Sect. 4.1).
In addition, we have carefully analysed other aspects of the AMR such as: i) the metallicity distribution, suggesting different degrees of chemical mixing according to the Age-Metallicity plots; and ii) the slopes in the AMR, we should note that we compute these slopes in the AMR for epochs ii and iii, avoiding the more turbulent epoch i.
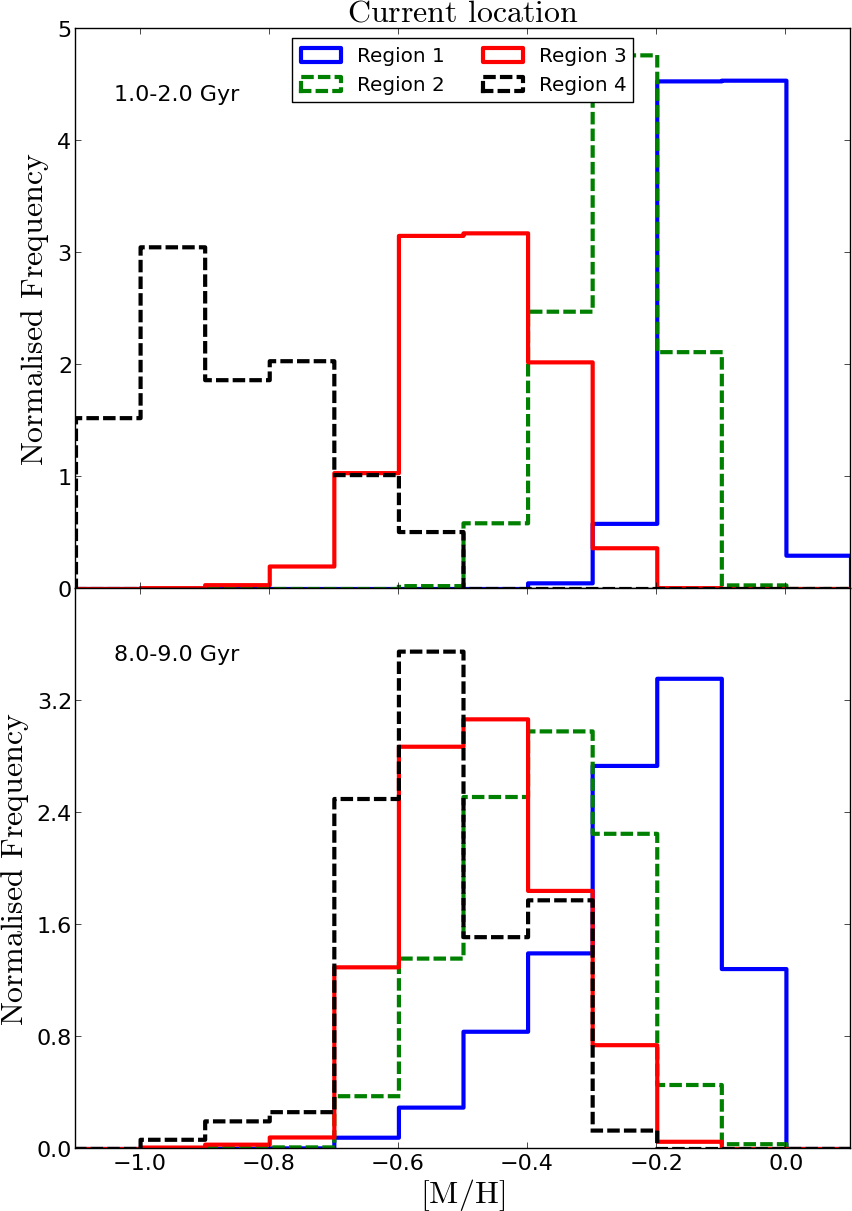
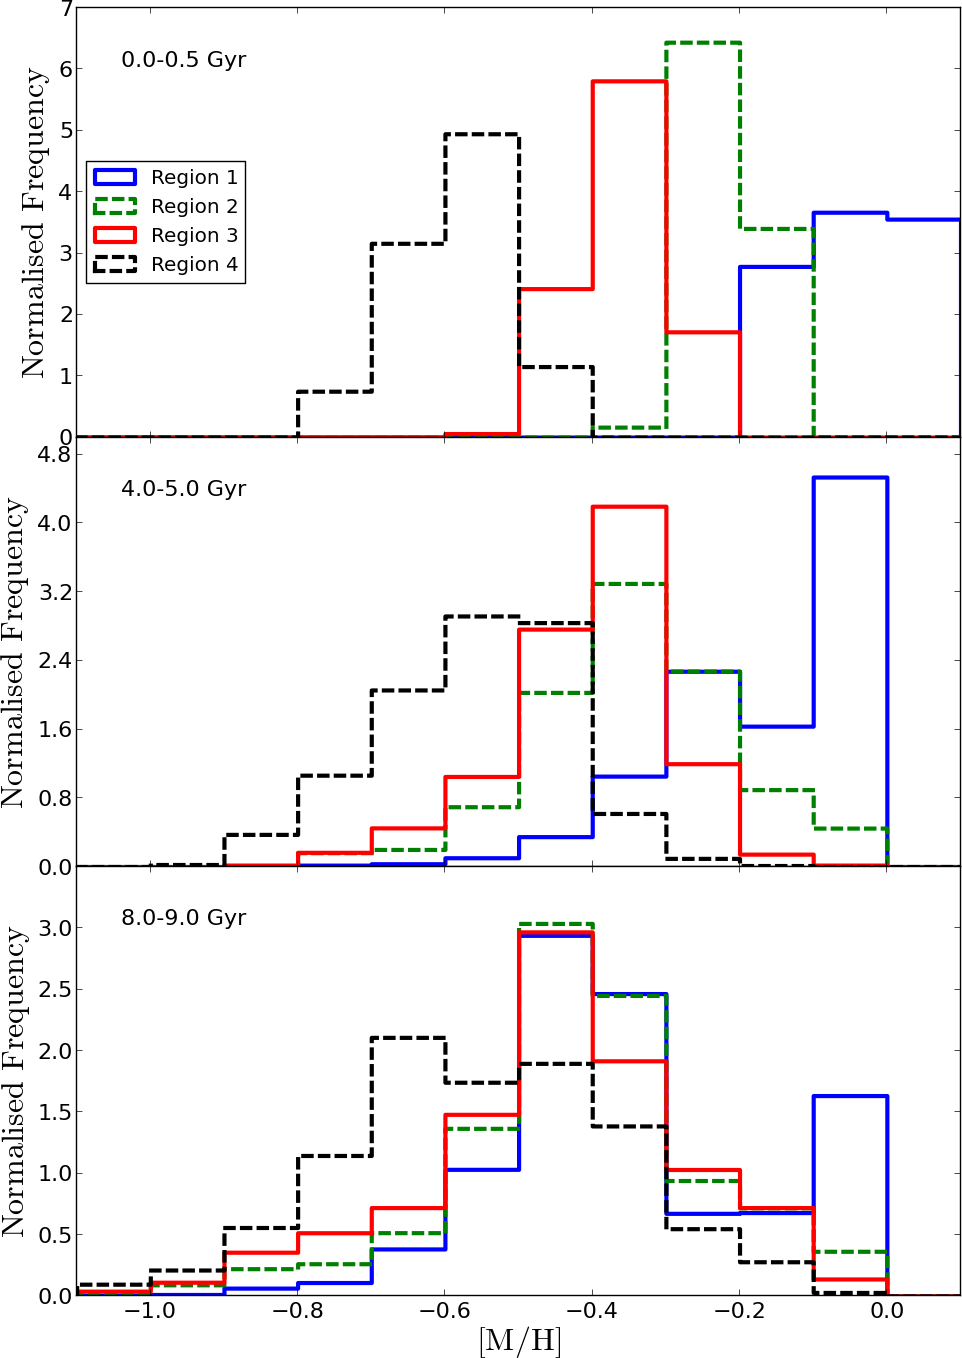
i) We have analysed the MDF (see Fig. 8) for stars in regions 1 to 4, distinguishing between young (younger than , 1 to 2 Gyr) and old (older than , 8 to 9 Gyr) stars (see left panel of Fig. 8 for Selene). For every galaxy, the metallicity dispersion is larger in the outer parts than in the inner parts (irrespective of age) ranging from 0.04 vs. 0.10 dex in region 1 to 0.07 vs. 0.13 dex in region 4 for the young vs. old components respectively (averaged values for all 19 RaDES galaxies). This is consistent with Minchev et al. (2014), where the increase in the AMR scatter with radius was related to the expected increase in contamination from migration and heating with radius. The metallicity dispersion for old stars is also larger than for young stars. If we define the change in the metallicity dispersion between old and young component as , its radial evolution is 58.7% in region 1, 37.9% in region 2, 26.4% in region 3, and 21.6% in region 4, i.e. the differences are minimised at greater radii.
If we do not focus on the radial evolution of the MDF for old or young stars, but in the discrepancies between old and young populations we can find interesting differences. Young stars show very different MDFs for the different radial bins while more similar distributions are displayed by old stars in regions 1 to 4. To quantify such a statement we have analysed, using Kolmogorov-Smirnov (KS) statistical tests, the differences between the metallicity distributions of different radial regions for young and old stars (at their current positions). The KS test effectively determines whether two sets of data are drawn from the same statistical distribution and how different those distributions are. For our purposes, larger KS values when comparing different radial regions would imply a greater degree of chemical mixing. According to these tests, young stars show distinct metallicity distributions between the different radial regions, while old stars in each region show similar metallicity distributions to one another. The average of the KS statistic values for all the galaxies comparing all the possibilities of pair or regions (i.e. 1-2, 1-3, 1-4, 2-3, 2-4, and 3-4) is 0.85 for young stars and 0.45 for old stars. These KS tests allow us to conclude that the degree of chemical mixing is greater for old stars than for young stars.
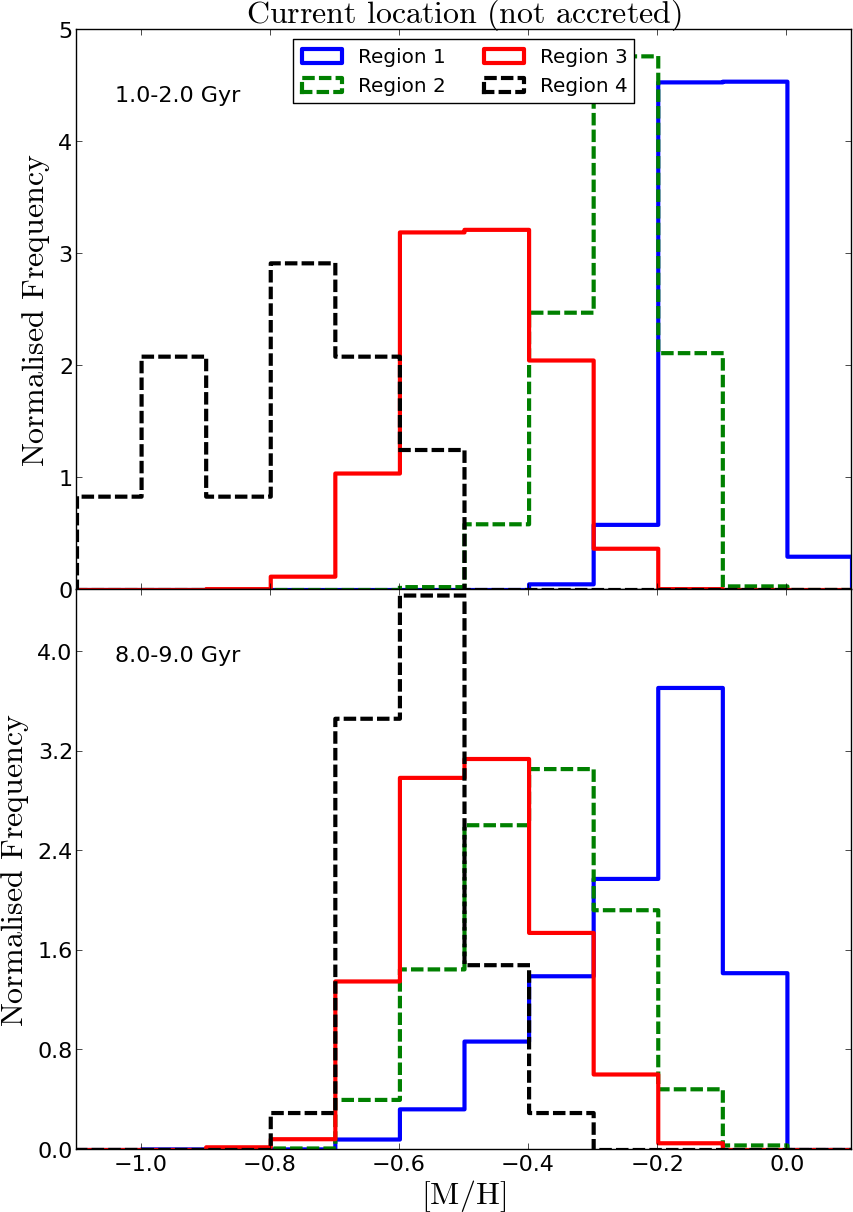
To properly assess the cause of the different mixing degrees for old and young stars, Fig. 8 not only shows the MDF for young and old stars at the current position (left panel) but also at their birth location (middle panel) for Selene. If the well-mixed MDFs displayed by old stars were due to the merger event, we should observe that old stars, taken at their birth location, exhibit distinct MDFs. However, Fig. 8 (left and middle panels for old stars) reveals that while there is some degree of mixing of the MDFs after the formation of the stars, there is no clear separation as found in the younger populations, and the majority of the similarity in the MDFs of old stars in different regions is imprinted at birth. This statement is backed by the mean and dispersion values displayed by these distributions. Although slightly lower dispersion values and larger mean metallicity ranges are found for stars at their birth position than at the current position, this is not enough as to suggest that the mixing was imprinted by merger events444The mean metallicities ([M/H]) for old stars at their current position are -0.23, -0.38, -0.48, and -0.56 from region 1 to 4, with metallicity dispersion of 0.13, 0.12, 0.12, and 0.11 respectively. However, at their birth location those values change to -0.20, -0.44, -0.58, and -0.31 (mean metallicities) and 0.09, 0.07, 0.07, and 0.16 (metallicity dispersions) for the particular case of Selene..
To further quantify the importance of mixing induced by accretion (in contrast to mixing imprinted at birth, the right panel of Fig. 8 shows the MDF of the Selene stars of star particles at regions 1 to 4 (current position) excluding accreted stars (i.e. kpc and kpc). The mean metallicity values of those MDFs are -0.23, -0.39, -0.48, and -0.56 while their dispersions are 0.13, 0.12, 0.11, and 0.07 for old stars from region 1 to 4. If we compare these values with those computed for the MDFs for old stars at their current positions (mean metallicities of -0.23, -0.38, -0.48, and -0.56 and dispersions of 0.13, 0.12, 0.12, and 0.11 for regions 1–4 respectively) and comparing the MDF shapes, we can conclude that the mixing is particularly important for region 4.
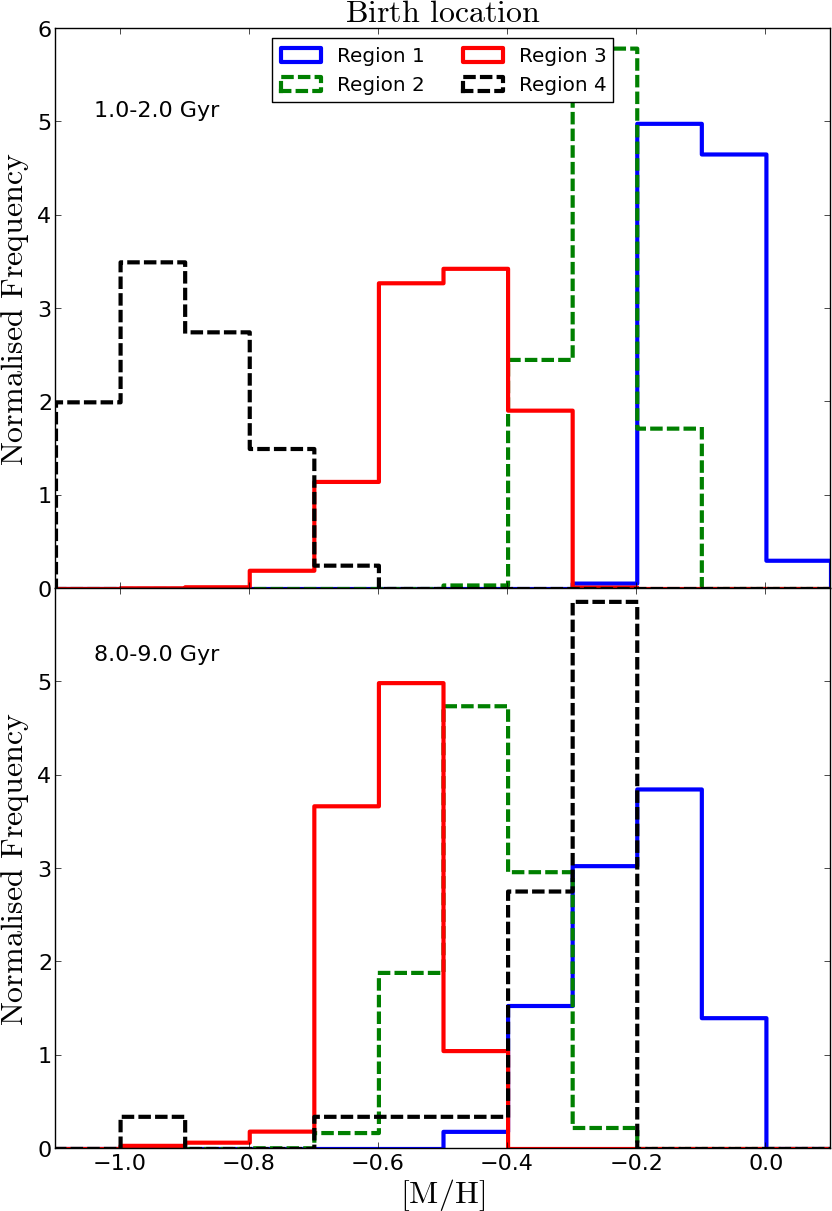
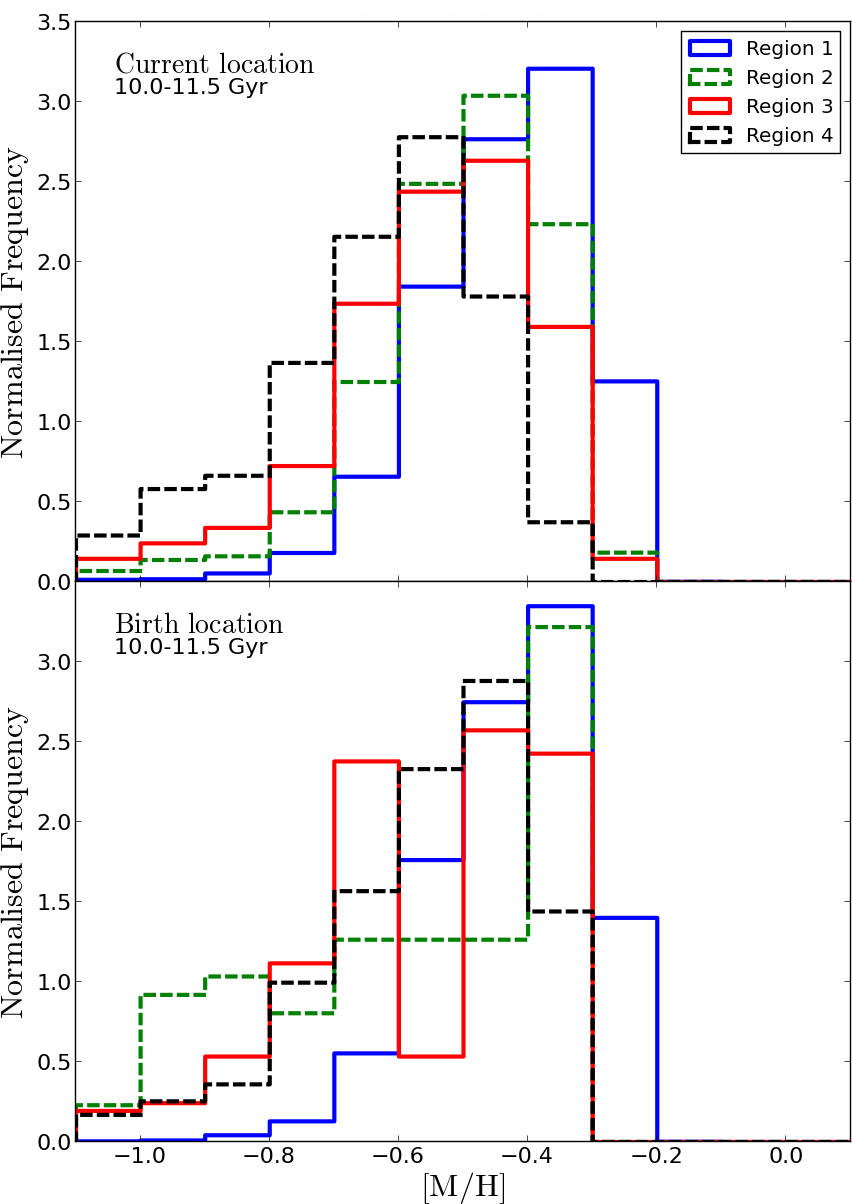
To determine if the MDFs of epoch i stars (10 to 11.5 Gyr old) have changed during the evolution of the galaxy we show, in Fig. 9, the MDFs of these stars at their current location (top panel) and at their birth location (bottom panel). The time evolution of these old stars is much weaker than for other age ranges because the MDFs of our four regions are so well mixed when the stars are born555The displayed metallicity dispersions are 0.13, 0.15, 0.16, and 0.18 (0.12, 0.24, 0.20, and 0.18) from regions 1 to 4 at their current (birth) locations and their mean values are -0.44, -0.51, -0.55, and -0.65 (-0.42, -0.61, -0.58, and -0.57).. The MDFs of regions do change over time but there is no clear trend present in the MDFs taken at birth locations. Taken together with Fig. 8 this further demonstrates that the clearly separated MDFs seen in the youngest stars was never present in older populations which form with more homogeneous MDFs.
In summary, the well-mixed MDFs displayed by stars born during phases i and ii is not directly due to a single satellite accretion event (although it also has an effect) but because of the collective activity in phases i and ii that homogenise the chemical characteristics of the gas from which stars are born.
ii) The slopes of the AMR for the four regions are always negative for the old stars (for every galaxy with just one ). These slopes are computed by means of a linear fit to the points in the AMR in the plane -Age (thus in units of dexGyr). These old-star AMR slopes are roughly similar, as expected from stars born at a more chemically homogeneous time in the assembly history. The relative slope differences (100, with and ranging from 1 to 4 accounting for all the possibilities) are under 40% for the entire sample of the RaDES galaxies (40% is reached just for the most extreme cases, the median is around 20%). When considering the younger part of the AMR (stars younger than ), the slopes range from negative (regions 1 and 2) to positive (region 4) in most of the galaxies. Region 3 is the region with the shallowest AMR slope. The average values considering the 19 RaDES galaxies are -0.031, -0.027, -0.004, and 0.008 dexGyr for regions 1 to 4 respectively. In the particular case of Selene the values are -0.016, -0.007, 0.002, and 0.06 dexGyr from region 1 to 4.
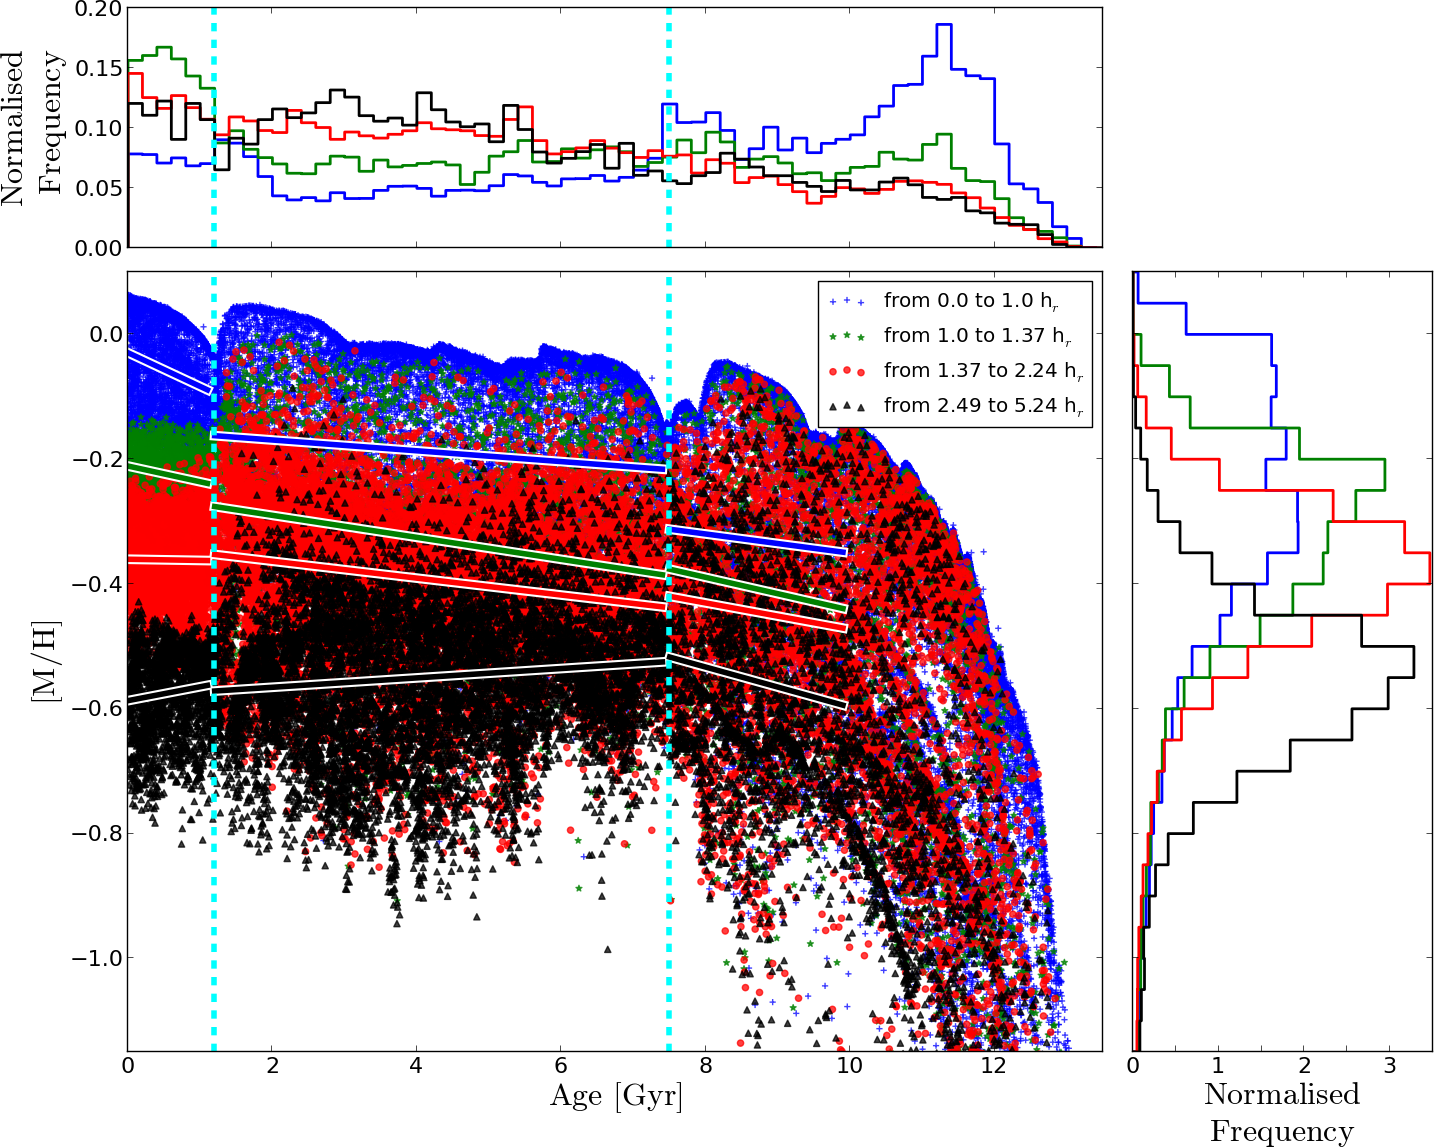
The case of Oceanus (as well as Artemis, not shown here) is a special one that deserves to be analysed in further detail. As we have already commented, Oceanus shows two merger episodes during the simulation with similar characteristics to the ones described in Sect. 2.2. Both episodes imprint a jump in the AVR (see Sect. 3.3, with the jump at 7.5 Gyr being later erased by the effect of the last merger event) and leave a signature in the AMR. In Fig. 7 we can clearly distinguish three main age regions, delimited by 7.5 and 1.2 Gyr. Fig. 10 shows the metallicity distributions for three different age bins (young, intermediate, and old) for Oceanus. In this case the radial evolution of the MDF is weaker for the older age bins. The young component shows metallicity dispersions of 0.071, 0.036, 0.056, and 0.071 dex (regions 1 to 4). For the intermediate (old) component, we find a radial evolution of 0.132, 0.133, 0.111, and 0.125 dex (0.176, 0.170, 0.182, and 0.188 dex). However, it is still true (even for this two-event galaxy) that the metallicity dispersion is higher for older stars (those with ages in the range 7.5–10 Gyr), the metallicity dispersion has intermediate values for intermediate-age stars, and lower values for young stars. As already outlined in the case of Selene, these well-mixed MDFs displayed by stars born during epochs i and ii are mainly a consequence of gas mixing that is imprinted on the stars at birth. The radial evolution of the slope in the AMR from negative to positive is also found for the youngest stars (, , , and dexGyr), while negative AMR slopes are obtained for the intermediate and old components (except for the slope of intermediate aged stars in region 4 which is consistent with the increasingly positive slope as a function of radius). To assess the degree of chemical mixing we decided, as described above, to make use of KS tests. We can draw similar conclusions as before, i.e. the youngest component of the AMR has 4 different metallicity distributions (KS statistic of 0.96), the intermediate component show a higher degree of mixing (KS statistic of 0.60), and the old component show the most similar metallicity distributions (KS statistic of 0.24).
The negative-to-positive change (with decreasing age) in the slopes of the AMRs deserves a further explanation. Negative slopes in the AMR are a direct consequence of chemical enrichment due to stellar evolution. Positive slopes are difficult to produce (and indeed are not frequently found in nature) due to chemical evolution alone, requiring efficient inflows of un-enriched gas into the galaxy. Inversion of the AMR is more easily achieved through the dynamical effects of satellite accretion (metal-rich stars being formed in the core of the satellites while passing through region 4), accretion of metal-poor gas (to form young, metal-poor stars), and radial migration. Further details can be found in Sect. 5.
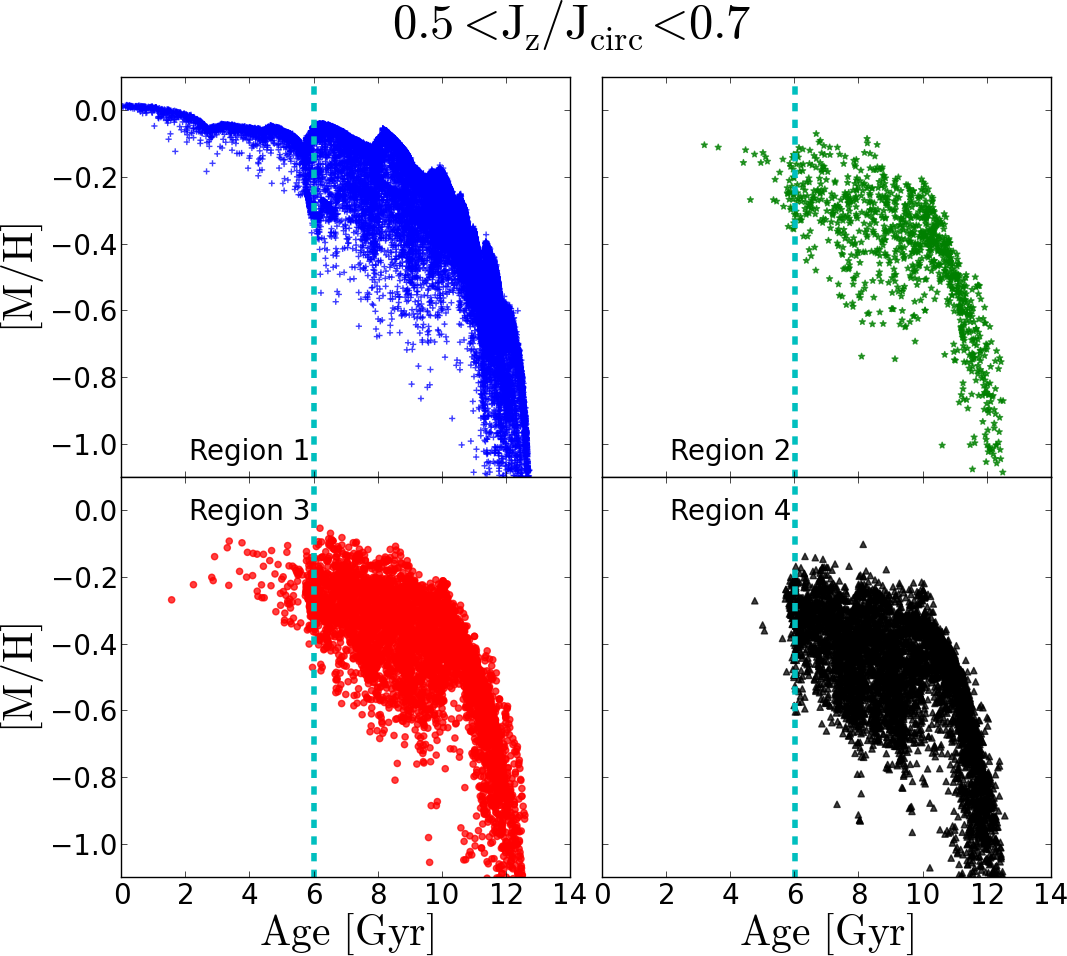
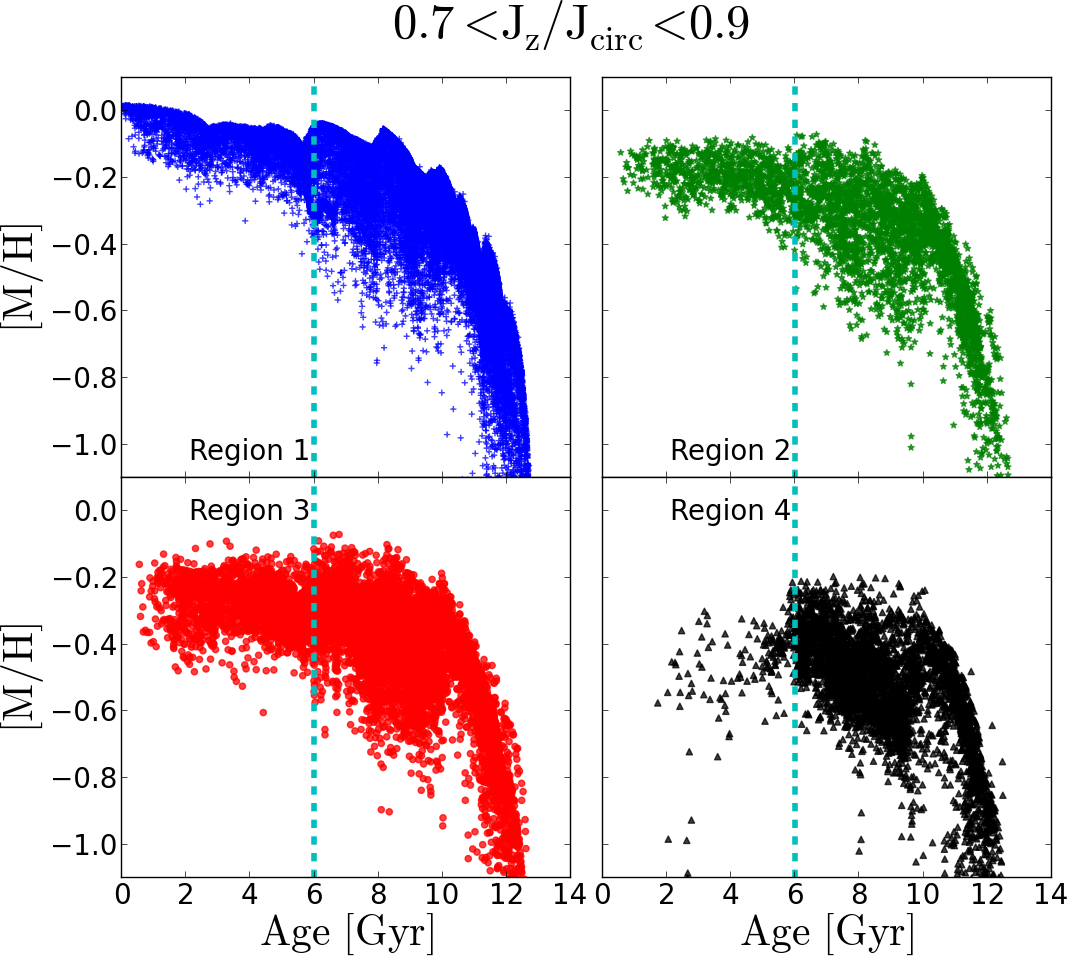
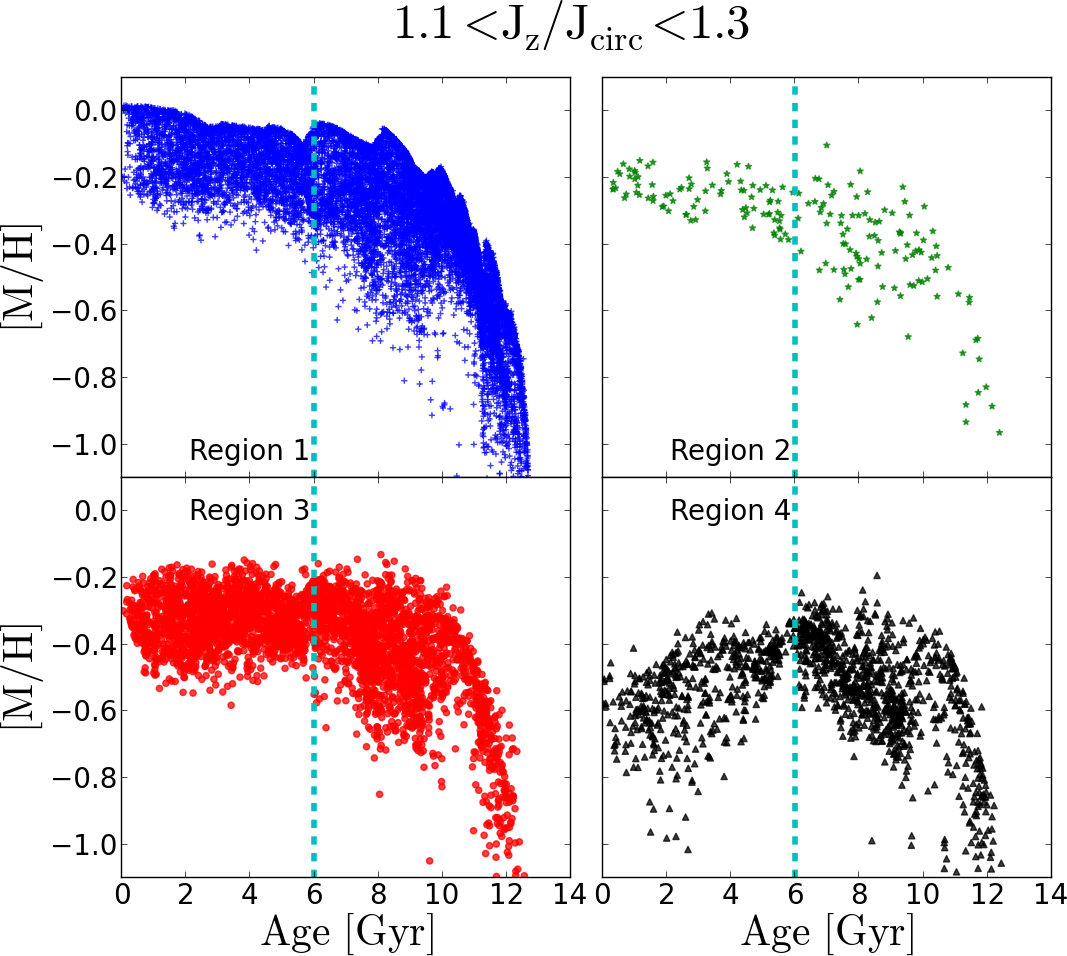
In order to check the influence of our kinematic selection criterion for disc/non-disc particles on the AMR we have repeated our analysis of the AMR for Selene considering four different ranges (0.5–0.7, 0.7–0.9, 0.9–1.1, and 1.1–1.3, see Fig. 11). The main results outlined in this section remain true for each of the selections, albeit with slight differences: there tend to be fewer stars forming post- in the lower cuts (particularly at larger radii) making the inverted portion of the AMR non-existent. Our disc star criterion (0.91.1) strengthens our results as this choice is the most representative of a disc population, though it should be clear from Fig. 11 that the inversion will be present if stars with in the range 0.5–1.3 were all included.

4 Chemo-dynamical imprints of satellite accretion: radial stellar motions
Sections 3.3 and 3.4 clearly point towards the effect of satellite accretion on observables such as the AVR or the AMR. Considering the richness of cosmological simulations we can however study galaxy properties other than those apparent at the present day, such as time evolution, stellar motions, and angular momentum. A careful inspection of these simulations can help us to understand the mechanisms responsible for the present-day observed properties.
In this section, we further investigate the effect of satellite accretion in the stellar age distribution at different radii (see Sect. 4.1) and the signatures that these events leave in the AMR (see Sect. 4.2).
4.1 Hints from the stellar age distribution

The study of stellar properties such as age or metallicity of the stars currently located at specific regions, as well as their original positions, can provide us with keys to understanding galaxy evolution. Fig. 12 shows the current Stellar Age Distribution (SAD, normalised to the mass of the whole galaxy) for Selene’s disc stars, in the four scaled regions (solid black line). At this stage we add two more regions from the outermost parts corresponding to the old plateau: region 5 at 4.4–6.2 and region 6 at 6.2–7.9. We separate the components of this current SAD according to i) particles born in each region that have stayed there (in-situ stars, solid red line); ii) born outwards then moved in (solid green line less than 5.0 kpc, solid cyan line more than 5.0 kpc); and iii) stars born inwards and moved out (solid blue line). In this third case, we divide them as well depending on the birth region: iiia) born in region 1 (dotted blue line); iiib) born in region 2 (dotted-dashed blue line); and iiic) born in region 3 (dashed blue line). Our birth radius is very close to the instantaneous radius at the time of the birth of the stars. It is defined as the location of the star in the first snapshot.
As a general trend, radial region 1 is mainly populated by old stars (older than 10 Gyr whose distribution shows a peak at 12 Gyr) that were born and stayed in that region (red line, accounting for 23% of the mass in region 1), with a non-negligible fraction of stars coming from the outer parts (20% of the mass in region 1). The oldest stars (older than 10 Gyr) in radial region 2 were formed inside (5% of the mass in region 2) or far outside (7% of the mass in region 2), while the majority of the young stars (younger than 4 Gyr) formed in-situ (33% of the mass in region 2) with also an important contribution of stars born inside and outside that region (6% of the mass in region 2). The same dichotomy is found in regions 3 and 4, older stars were born inside or much further out while young stars mainly formed there or moved outward from the inner regions with fewer in-situ stars, especially for region 4, which is mainly dominated by migrated stars with a small percentage of in-situ stars (16% of the mass in region 4). Studying outward travellers in region 4, we can see that the older the star is the more it has travelled outwards (from regions 1, 2, or 3). The radial evolution of the red lines reflects a clear inside-out growth of the disc, and we can analyse when star formation starts in each radial region: Stars were formed in region 1 since the beginning of the simulation; region 2 started forming stars 10 Gyr ago; region 3, 6 Gyr ago; and region 4, 2 Gyr ago. We note that the vast majority (92%) of stars migrating more than 5 kpc (solid cyan lines in Fig. 12) are accreted from outside the galaxy, i.e. 20 kpc and 3 kpc. The age distribution of these accreted stars is shown in Fig. 12 as a dashed cyan line.
Regions 5 and 6 are mainly populated by old stars on circular orbits coming from well outside the host galaxy (cyan lines in Fig. 12). Some stars from the inner parts are also found, however, the main cause of the old plateau observed in all the RaDES galaxy discs is the accretion of old stars from early satellites. This is in contrast to the interpretation by Roškar et al. (2008a), who suggested that the oldest stars in the outskirts have migrated from the inner disc. We find no stars that were born in the outer parts, that are still in that region, and that meet our criterion for disc stars.
4.2 Hints from the age-metallicity relation
In Sect. 3.4 we showed the radial evolution of the AMR in our disc galaxies and outlined the first signatures left by satellite accretion in such relation. Here, we study in more detail the AMR and expand the imprints of satellite accretion on the chemistry and the dynamics of our galaxies.
Fig. 13 shows the same AMR displayed in Fig. 5 but this time split into four different sub-panels (one for each radial region) and colour-coded according to the - for each particle. We can draw similar conclusions to those outlined in the previous section: region 1 is mainly populated by in-situ stars at all ages with a significant number of stars that have moved inwards, particularly from the last satellite (cyan line, stars born before , see Fig. 12). As we compare the inner with the outer regions, more and more stars moving outwards appear (especially amongst older populations) and fewer stars move inwards, except for those stars moving inwards that were born at the furthest distances in satellites (dark blue points in Fig. 13). The extreme case is found in region 4 where the majority of particles have been formed at smaller radii, some old stars come from satellites, and just a few have been born in-situ (stars younger than 2 Gyr, when the inside-out growth of the disc reached region 4). Every old particle now located in regions 3 or 4 is either coming from the inner parts or from satellites (consistent with Fig. 12).
The AMR of the last accreted satellite can be discerned from the older and dark-blue points in regions 1 and 2 in Fig. 13 (due to aesthetic purposes we restrict the colour bar range from -4 to 4 kpc, i.e. dark-blue points mean ). The shape of this AMR mimics that of the host galaxy. We note a correlation between “dips” in the AMR envelope of the host disc stars and of the satellite. We can explain such correlation as the consequence of repeated flybys that the satellite has experienced during its approach.
In Pilkington et al. (2012a), we studied the time evolution of one of the RaDES galaxy’s (Apollo) ‘instantaneous’ or gas-phase metallicity gradient, finding a shallower profile nowadays than at early simulation stages, i.e. the metallicity gradient of the galaxy is flattening with time. According to that work, we would expect the mean metallicity of each region to be similar for young stars and more different for older stars. However, Fig. 5 shows the opposite behaviour, i.e. the difference in the mean metallicity at a given age between two adjacent regions is increasing as we are moving towards younger ages. However, this neglects the effect of stellar migration which may flatten the metallicity profile. Radial motion causes this effect as stars from the metal-rich center of the galaxy move to the outskirts. This pushes up the mean metallicity for intermediate-aged stars found at larger radii and inverts the expected trend of the AMR because the youngest stars are born from gas with a metallicity that is lower than the center had in the past.
A striking segregation can be seen in the metallicity of stars depending upon how they have migrated. Stars that have moved outwards are systematically more metal-rich than particles that have stayed in a region or moved inwards (see Fig. 13). This is a direct consequence of the negative metallicity gradients and stellar radial motions and consistent with Minchev et al. (2013). In fact, if we infer the metallicity gradients from such plots (-0.071 dex/kpc) we obtain similar results to those presented in Few et al. (2012) (Table 2, -0.061 dex/kpc).
Satellite accretion not only produces a mixture in the spatial distribution of stars and an exchange of stars moving inwards/outwards, it also leaves a signature in the dynamics of the stars. In Fig. 14 we show the AMR split in four sub-panels, as in Fig. 13, but now colour-coding each stellar particle according to its circularity (/). Despite the narrow range of / we are considering in our discs (see Sect. 3.1) we find another interesting trend. Specifically, in every analysed region there is little or no correlation between the stellar metallicity and prior to . This might suggest that during the epoch of satellite accretion (phases i and ii in Sect. 2.2), the disc was hot and well mixed, and those stars still preserve that state (as already shown and quantified in Sect. 3.4). If we consider the subsequent quiescent phase after satellite accretion, the stars born after display a new segregation with the more metal-rich (which tend to be migrating outwards) stars having the least circular orbits and vice versa.
We should emphasise that Fig. 1 shows (by means of , dashed cyan vertical lines) the moment when the last satellite merges with the disc of the host galaxy. After this time the satellites do not dynamically affect the host disc any longer. We can conclude from the above outlined analysis that satellites affect the disc properties in a continuous way until the last one totally merges with the host galaxy (not when it enters the virial radius), after that, our discs evolve mostly quiescently.
5 Discussion and conclusions
We have analysed the stellar content of the RaDES galaxies (Few et al., 2012) in order to study the effect of satellite accretion in shaping the chemo-dynamical properties of their discs. In this work, we concentrate on the characterisation of the assembly history of these galaxies and the influence of such assembly on stellar disc properties such as the age and metallicity profiles (Sect. 3.2); the Age-Velocity dispersion Relation (AVR, see Sect. 3.3); the Age-Metallicity Relation (AMR, see Sect. 3.4); and other dynamic and kinematic properties (see Sect. 4). We study the radial evolution of several of those properties by dividing our discs into 4 radial regions (see Table 2).
The assembly histories of the RaDES galaxies are characterised by three main epochs: i) A first merger-dominated epoch, when most of the mass of the galaxy is formed via accretion of massive satellites ( ranging from 0.1 to 3). ii) During the second phase the host galaxy still suffers several mergers but decreasing in number and mass ratio ( ranging from 0.01 to 0.3, at a distance smaller than 5 kpc). iii) This second phase is followed by a quiescent period (with some sporadic satellite accretion with 0.001) in which the disc has settled. We define as the time boundary between phases ii and iii, at which time the last satellite merges with the host galaxy. This latest accretion event is characterised by its satellite having similar characteristics for all the RaDES galaxies ( 0.12 0.09 when it enters the virial radius and 0.013 0.006 when the merger happens, averaged values, see Table 1). This event marks the end of the active merging period and the beginning of quiescent evolution.
This assembly history leaves an imprint on the chemical and dynamical properties of the stellar discs of our galaxies. The AVR shows a clear jump (sudden for some galaxies, smooth for others) at around (see Fig. 4). This feature is a direct consequence of the heating produced by the satellite accretion. Those stars that underwent phases i and ii (older than ) are in a hotter state now (high velocity dispersion) than young stars that were born in the quiescent phase iii. The smoothness of the jump depends on the “merging time scale” of the latest accretion event and subsequent internal evolution.
These differences in the velocity dispersion between old and young stars lead to differential chemical mixing in our discs. While different radial regions show different AMRs (with very different metallicity distributions) for young stars, Kolmogorov-Smirnov statistical tests show that the metallicity distributions of old stars display similar characteristics at different radii (see Figs. 5, 7, 8, and 10). Although the radial redistribution of stars due to satellite accretion and secular activity does take place, we find that the radial distribution of metals in the gas from which old stars were formed was homogeneous during phases i and ii compared with the phase iii and this is the main cause of the similar MDFs displayed by old stars. Thus, radial redistribution of stars does little to change the MDFs of these older stars that are born with a flat metallicity gradient.
Most of the analysed galaxies show the above outlined assembly scenario leaving the same imprints in the AMR and the MDFs. However, two of them show two different accretion events after the disc is settled (Artemis and Oceanus, see Figs. 4 and 7). Similar results and conclusions as the ones outlined before for the rest of galaxies apply to these two cases. The bottom panel of Fig. 4 shows how this second event is able to heat the stars of the entire disc, regardless of their ages. The fact that the jump in the AVR at 7.5 Gyr is smoother than the one at 1.2 Gyr might be a consequence of such heating produced by this latest accretion event (at 1.2 Gyr). To test this hypothesis, we have analysed the AVR 5.75 Gyr ago (dashed lines in the bottom panel of Fig. 4). We can observe that the “jump” in velocity dispersion at 7.5 Gyr was more important in the past than it is nowadays. This confirms the suggestion that the merger event is able to heat the entire disc of the host galaxy, swamping previous jumps in the AVR, especially in the inner regions. Thus, old steps in the AVR can be erased by later mergers as heating produced by mergers is more efficient on kinematically cold stars than on hot stars. In the particular case of Oceanus, the latest merger event blurs the “jump” observed at 7.5 Gyr. KS tests comparing the radial metallicity distribution of three age bins according to these two merger events also show that old stars display the higher mixing degree while intermediate-age and young stars show a lower one (with the youngest stars displaying the lowest mixing, see Fig. 10). Although part of the observed mixing might be induced by the merging of structures, the greater mixing degree displayed by old stars was imprinted at birth (as for the case of galaxies with just one merger event). The activity in phases i and ii homogenises the chemical characteristics of the gas along the entire galaxy and, as a consequence, stars formed from such homogenised gas display similar MDFs regardless their location.
Figures 5, 7, and 15 show “dips” in the maximum [M/H] of the central region (region 1) located at as well as at other time steps (to a lesser degree). Those shallower dips are related to the galaxy accretion history as they correspond to close encounters between the host galaxy and minor satellites. The dips are caused by temporary dilution of the gas in the central region by the merger either bringing metal-poor gas from the halo of the galaxy or simply adding the metal-poor gas from the surroundings of the satellite. In both cases this gas has a lower metallicity than the gas in the centre of the galaxy.
We observe two interesting segregations in our AMR plots (see Figs. 13 and 14). The innermost regions (regions 1 and 2) of our galaxies show that metal-rich stars have moved outwards, while metal-poorer stars have moved inwards. This behaviour can be easily explained by the observed negative metallicity profile (in fact, their gradients can be inferred from such plots, see Sect. 4.2). The outermost parts of the galaxies (regions 3 and 4) show such behaviour for the young stars (younger than ), while the old stars populating those regions have migrated from the inner parts or come from satellites, i.e. formed outside of the galaxy itself.
The segregation in circularity () deserves a further explanation. Fig. 14 shows that old stars display well mixed values of their circularity regardless of their metallicity (a consequence of the heating mechanisms that they have undergone). However, in the case of the young stars (younger than ), the more metal-rich the star is, the lower the circularity is. We can explain this by the expectation that stars with higher and lower metallicities are born outside the studied annulus (as shown by Fig. 13). There are two ways in which these stars can appear in an annulus inward of their birth places: i) Their angular momenta decreased (i.e., inwards migration) to the value of the stars born locally, in which case will be close to 1, or ii) they have reached the final annulus on their pericenters, but with angular momenta still larger than the one appropriate for the annulus under consideration. It is the second case that causes the green outline at the lower metallicity range. Those stars have guiding radii outside the studied region. Similarly, lower angular momentum disc stars (dark-blue points) are accumulated at the upper metallicity edge.
In Sect. 3.4, we describe and quantify the main characteristics of the AMR in different radial bins for Selene. Apart from the differences in the chemical mixing between old and young stars, one of the most interesting aspects outlined is the progressive change in slope from regions 1 to 4. A negative slope in the AMR is easily explained by the fact that young stars (in a simple scenario) are born from enriched gas, and thus, are expected to be more metal-rich than old stars populating the same region. The presence of radial motions (as those described in Fig. 13) combined with a negative metallicity profile can produce a higher dispersion in the AMR and a change in the AMR slope (Roškar et al., 2008a; Sánchez-Blázquez et al., 2009). Extreme radial motions can even cause the inversion that we observe: old stars migrate from the metal-rich centre of the galaxy to the outer parts as well as stars from intermediate radii (less metal-rich) also move inwards. However, if we now recreate Fig. 5, this time colour-coding the point according to the region in which the stars were born instead of their present-day position, we still have some inversion (see Fig. 15). A careful analysis of the time evolution of the AMR at birth location for region 4 can give us the explanation. Satellites orbiting around the host galaxy are forming stars in their inner parts with metallicities similar to those displayed by the centre of the host galaxy. Before merging with the host galaxy, the satellites pass through region 4 several times (the clusters of black triangles at 6.5 and 8.0 Gyr in the case of the satellite responsible for the ) forming stars within region 4, particles that after the merger took place acquire a circular orbit (fulfilling our disc criterion). These particles are metal-rich stars. In addition, we find a low number of particles that are born in region 4 from metal-poor gas accreted from the halo or other satellite haloes with ages between 3.0 and 6.0 Gyr. As a consequence of the metal-poor gas accretion and the low star formation activity, gas in region 4 becomes progressively more metal-poor. Finally, we find a group of newly-born stars (younger than 2.0 Gyr) due to inside-out growth of the disc reaching region 4 (see red line in region 4, Fig. 12). Once true disc star formation is established the normal negative gradient to the AMR reappears (the last 2.0 Gyr). This scenario naturally leads to an inverted AMR in region 4 even when radial motions are not considered. The same reasoning can be applied to region 3 (outer parts in general), with the difference that inside-out growth reaches this region much sooner (6 Gyr ago, see Fig. 12).
Positive slopes in the AMR of the outer parts of nearby galaxies have already been observed. Bernard et al. (2012) studied the SFH and the AMR of two outer fields in M31 and another field in M33 using the data from Barker et al. (2011), both based on HST/ACS Colour-Magnitude Diagrams (CMDs). The SFH and AMR found in both galaxies show enhanced SF at 2 Gyr and an inverted AMR for stars younger than 3 Gyr, similar to the one in the outer parts of Oceanus in this work. They suggest that this SF enhancement and the inverted AMR is caused by a close encounter between M31 and M33 2-3 Gyr ago according to the N-body simulations by McConnachie et al. (2009). In addition, Bernard et al. (2012) find that the analysed outer fields in M31 and M33 are older than the inner parts, suggesting an U-shaped age profile, in contrast to the purely negative profile found by Williams et al. (2009) in M33. To compare with our results we must keep in mind that, while they are observing the consequences of a close encounter between two massive spiral galaxies, we are considering the entire assembly history of the RaDES galaxies. Our work, along with these observational and theoretical works confirm that satellite merging or galaxy encounters leave a signature in observable quantities such as the AMR or the age profile, especially in the outer parts.
In Bernard et al. (2015), the team have expanded upon their previous analysis in M31 by analysing 14 outer fields located along the disc, the Giant Stellar Stream (GSS, caused by satellite accretion), and in regions in-between. They are able to confirm the inverted AMR already outlined in Barker et al. (2011) and Bernard et al. (2012) for all the analysed fields. In addition, they deduce that most of the mass in the disc regions was already formed by z 1, while stream-like regions are on average older, as expected since the GSS origin is linked to satellite accretion. Joining the above result with our findings we confirm that satellite merging or galaxy encounters leave a signature in observable quantities such as the AMR or the age profile, especially in the entire outer disc.
In Villalobos & Helmi (2008) and Villalobos & Helmi (2009), the authors study the effect that 1:5 mass-ratio (at virial radius) satellite mergers have upon the thick disc properties using N-body simulations of a satellite being accreted by a pre-existing disc galaxy. They find that 2 Gyr after the merger event occurs the properties of the heated discs have settled and stop evolving further (roughly consistent with our findings). They claim that the kinematic impact on their host (thin) discs is almost negligible in the case of the vertical and azimuthal components while in the case of the radial velocity dispersions they usually increase their value by 5-10 km s-1 at all radii. We find increases from 50% in the inner parts to 100% in the velocity dispersion of the outer parts for Selene (latest satellite with a mass ratio of 1:10). This suggests strong disc flaring, an important aspect of the formation of thick discs in a cosmological context (Minchev et al., 2015). However, although the effect we see in our simulations in the heating of the discs from satellite accretion is greater than in the case of Villalobos & Helmi (2008) and Villalobos & Helmi (2009), we must take into account that the jump in the AVR is a consequence of phases i and ii. While in the Villalobos & Helmi (2008) and Villalobos & Helmi (2009) works they analyse controlled experiments in which one unique satellite merges with a host galaxy, our simulations are embedded in a cosmological context and thus, this greater heating is not only caused by the latest merging event, but it is a consequence of all the previous mergers.
5.1 Revisiting the “U-shape” age profile
Every age profile for the RaDES galaxies exhibits the same behaviour (see Sect. 3.2 and Fig. 3): A negative profile, followed by an upturn that end up in an old plateau at large galactocentric radius. Recent simulations find such U-shape profiles in the stellar age distribution of their simulated discs (e.g. Roškar et al., 2008b, a; Sánchez-Blázquez et al., 2009; Martínez-Serrano et al., 2009). Different mechanisms have been proposed to explain such profiles, but there is still a lack of consensus (see Sect. 3.2).
The findings presented in this paper point to three main aspects responsible for shaping the disc age profiles:
a) An inside-out growth of the disc: As discussed in Sect. 4.1 and shown by Fig. 12 (red lines), our discs display a clear inside-out growth of the disc. This mechanism can account for the inner part (negative gradient) of the age profile.
b) Radial motions (inwards and outwards) of stars belonging to the disc: Fig. 12 (blue lines) also show that the regions where the upturn in age appears are dominated by old stars that have move outwards (especially region 4) with the contribution of some young, in-situ stars.
c) Accreted, old stars from satellites: Phases i and ii populate our discs with old stars coming from the accretion of satellites. Such accretion is also responsible for the U-shape in the age profile as part of the old stars in regions 3 and 4 come from satellites (cyan lines in Fig. 12). However, these old accreted stars are especially responsible for the old plateau observed at large galactocentric distances (see Fig. 3). Regions 5 and 6 are mainly populated by these old accreted stars.
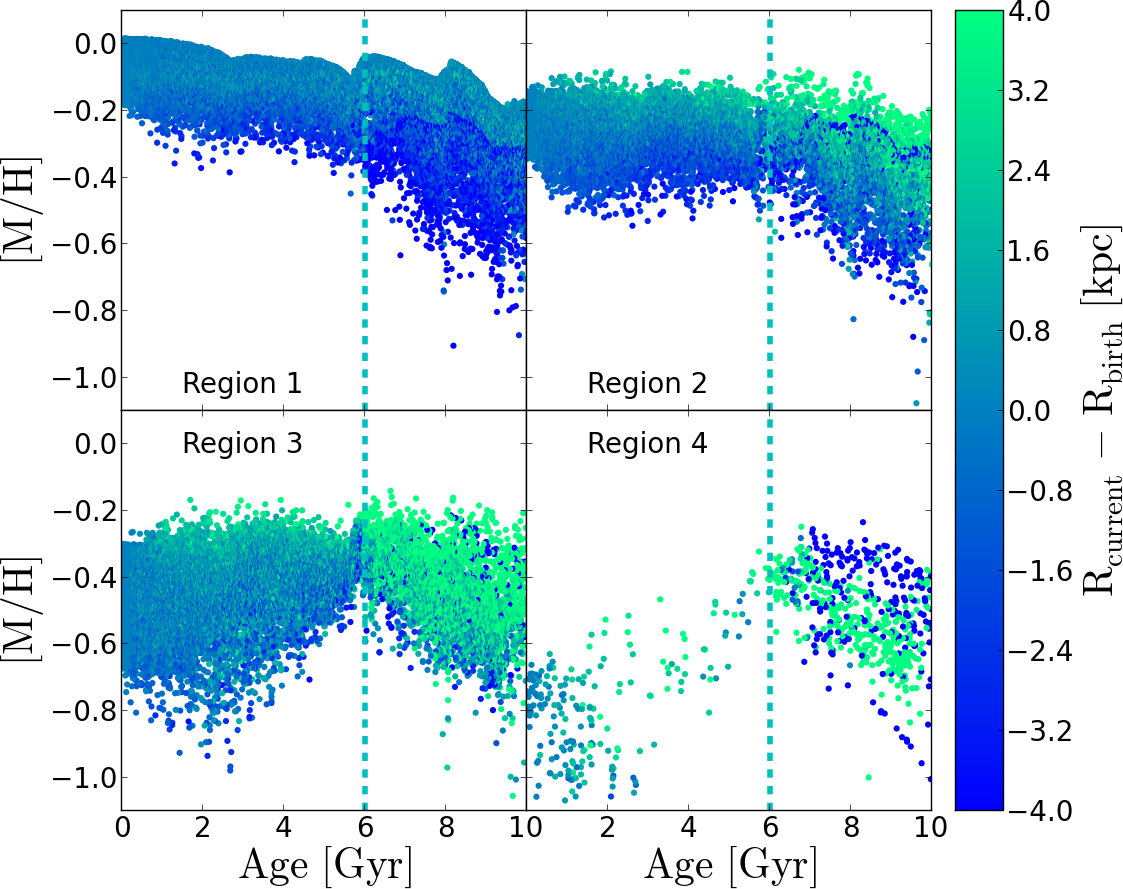
However, although radial motions might play an important role in creating the U-shaped age profile (Roškar et al., 2008b, a), they are not necessarily needed to build up such a profile (Sánchez-Blázquez et al., 2009; Halle et al., 2015). In Fig. 16 we analyse the effect that radial motions and our disc-particle criterion (based on ) imprint in the shape of the age and metallicity profiles.
Radial motions have their greatest effect on the age minimum, i.e. a younger minimum in the age profile is found when suppressing radial motions. This is because the minimum age is in a prime location to be migrated to (it can receive stars from larger and smaller radii easily) and because migrating stars tend to be older. However, U-shaped age profiles are found whether we allow stars to migrate or not, i.e. radial motions affect the shape of the age profile but are not in fact the origin of the U-shape.
To explain why the U-shaped age profile is still recovered after suppressing radial motions we need to analyse the stellar content in the outer parts of our simulated galaxies (regions 4, 5, and 6, see Fig. 12). Region 4 shows some in-situ star formation around 6, 7, and 11 Gyr ago, this star formation can easily explain the upturn in the age profile. However, the old plateau disappears if we suppress radial motions for the disc stars (while still visible if we analyse all the particles, see Fig. 16). This old plateau disappears for disc particles because of the lack of in-situ disc stars at large radii. However, if we study the entire sample of stellar particles (spheroid and disc component), we can find that an old, non-disc population exists in this outermost regions of the RaDES galaxies, suggesting early star formation in these outer parts (see Fig. 17).
In recent years, there is a growing body of works claiming that the formation of the outer disc of the Milky Way may have begun as early as 10 Gyr ago (e.g. see discussions in Haywood et al., 2013; Snaith et al., 2014; Halle et al., 2015). This suggests that, apart from radial migration, other mechanisms might be in place while shaping these outer regions. In particular, Nidever et al. (2014), analysing APOGEE data (Majewski et al., 2010), find a complex Milky Way formation from a well-mixed and turbulent interstellar medium with different SFHs for inner and outer disc. In addition, more studies are finding upturns in the age profiles in the outer parts of, not only spiral galaxies, but also dwarfs (Hidalgo et al., 2013).
Both radial motions and the application of less restrictive disc-particle criteria, have a flattening effect on the metallicity profiles. The reason for this is straightforward; particles that move radially inwards the greatest distances are old, metal-poor stars that strongly affect the regions where the average metallicity is higher (lowering the average metallicity). In addition, particles moving outwards were formed in high-metallicity gas and move towards regions dominated by low-metallicity stars, thus, this outwards motion increases the mean stellar metallicity in the outer parts. The impact of relaxing our disc-particle criterion has the same effect. Relaxing the criteria allows more spheroid particles to be considered in the analysis, particles that are characterised as being old and metal-poor and thus reducing the mean metallicity in the metal-rich regions more strongly while making little difference to the metal-poor regions. In the case of Selene the metallicity gradient evolves from -0.20, -0.19, -0.13, and -0.12 dex/ from locally-born disc stars, all locally-born stars, disc stars with radial motions, and all stars with radial motions, respectively.
The assembly history of disc galaxies leaves important fingerprints in their chemical and dynamical properties. Based on this assembly history, we have been able to explain previously observed features such as the dispersion in the AMR, inverted AMR gradients, and U-shaped age profiles. Satellites mainly affect the host disc when they completely merge with it, although some star formation and gas dilution can be observed during the different satellite flybys. These fingerprints should be easily observed in present and upcoming spectroscopic surveys such as Gaia (Perryman et al., 2001), RAVE (Steinmetz et al., 2006; Zwitter et al., 2008; Siebert et al., 2011; Kordopatis et al., 2013), SEGUE (Yanny et al., 2009), APOGEE (Majewski et al., 2010), or 4MOST (de Jong et al., 2012) helping us to understand the physics shaping the present-day observable properties of the Milky Way.
Acknowledgements.
We thank the anonymous referee for very useful comments. This research has been partly supported by the Spanish Ministry of Science and Innovation (MICINN) under grants AYA2011-24728 and AYA2014-53506-P, by the Junta de Andalucía (FQM-108), and the UK’s Science & Technology Facilities Council (ST/J001341/1: BKG, ST/F007701/1: CGF). The generous allocation of resources from STFC’s DiRAC Facility (COSMOS: Galactic Archaeology), the DEISA consortium, co-funded through EU FP6 project RI-031513 and the FP7 project RI-222919 (through the DEISA Extreme Computing Initiative), and the PRACE-2IP Project (FP7 RI-283493), are gratefully acknowledged. TRL thanks the support of the Spanish Ministerio de Educación, Cultura y Deporte by means of the FPU fellowship. CGF acknowledges the support of the European Research Council for the FP7 ERC starting grant project LOCALSTAR. P.S-B acknowledges support from the Ramón y Cajal program and to the grant ATA2010-21322-C03-02 from the Spanish Ministry of Economy and Competitiveness (MINECO). This research made use of python (http://www.python.org), of Matplotlib (Hunter, 2007), a suite of open-source python modules that provides a framework for creating scientific plots, and Astropy, a community-developed core Python package for Astronomy (Astropy Collaboration et al., 2013).References
- Abadi et al. (2003) Abadi, M. G., Navarro, J. F., Steinmetz, M., & Eke, V. R. 2003, ApJ, 597, 21
- Ahn et al. (2014) Ahn, C. P., Alexandroff, R., Allende Prieto, C., et al. 2014, ApJS, 211, 17
- Astropy Collaboration et al. (2013) Astropy Collaboration, Robitaille, T. P., Tollerud, E. J., et al. 2013, A&A, 558, A33
- Athanassoula (2005) Athanassoula, E. 2005, MNRAS, 358, 1477
- Athanassoula et al. (2009a) Athanassoula, E., Romero-Gómez, M., Bosma, A., & Masdemont, J. J. 2009a, MNRAS, 400, 1706
- Athanassoula et al. (2010) Athanassoula, E., Romero-Gómez, M., Bosma, A., & Masdemont, J. J. 2010, MNRAS, 407, 1433
- Athanassoula et al. (2009b) Athanassoula, E., Romero-Gómez, M., & Masdemont, J. J. 2009b, MNRAS, 394, 67
- Aubert et al. (2004) Aubert, D., Pichon, C., & Colombi, S. 2004, MNRAS, 352, 376
- Aumer & Binney (2009) Aumer, M. & Binney, J. J. 2009, MNRAS, 397, 1286
- Bakos et al. (2008) Bakos, J., Trujillo, I., & Pohlen, M. 2008, ApJ, 683, L103
- Barker et al. (2011) Barker, M. K., Ferguson, A. M. N., Cole, A. A., et al. 2011, MNRAS, 410, 504
- Bergemann et al. (2014) Bergemann, M., Ruchti, G. R., Serenelli, A., et al. 2014, A&A, 565, A89
- Bernard et al. (2012) Bernard, E. J., Ferguson, A. M. N., Barker, M. K., et al. 2012, MNRAS, 420, 2625
- Bernard et al. (2015) Bernard, E. J., Ferguson, A. M. N., Richardson, J. C., et al. 2015, MNRAS, 446, 2789
- Binney et al. (2000) Binney, J., Dehnen, W., & Bertelli, G. 2000, MNRAS, 318, 658
- Bird et al. (2012) Bird, J. C., Kazantzidis, S., & Weinberg, D. H. 2012, MNRAS, 420, 913
- Brook et al. (2004) Brook, C. B., Kawata, D., Gibson, B. K., & Freeman, K. C. 2004, ApJ, 612, 894
- Brook et al. (2012) Brook, C. B., Stinson, G., Gibson, B. K., Wadsley, J., & Quinn, T. 2012, MNRAS, 424, 1275
- Brooks et al. (2011) Brooks, A. M., Solomon, A. R., Governato, F., et al. 2011, ApJ, 728, 51
- Calura et al. (2012) Calura, F., Gibson, B. K., Michel-Dansac, L., et al. 2012, MNRAS, 427, 1401
- Carlberg et al. (1985) Carlberg, R. G., Dawson, P. C., Hsu, T., & Vandenberg, D. A. 1985, ApJ, 294, 674
- Catinella et al. (2013) Catinella, B., Schiminovich, D., Cortese, L., et al. 2013, MNRAS, 436, 34
- de Jong et al. (2012) de Jong, R. S., Bellido-Tirado, O., Chiappini, C., et al. 2012, in Society of Photo-Optical Instrumentation Engineers (SPIE) Conference Series, Vol. 8446, Society of Photo-Optical Instrumentation Engineers (SPIE) Conference Series
- Debattista et al. (2006) Debattista, V. P., Mayer, L., Carollo, C. M., et al. 2006, ApJ, 645, 209
- Dekel & Birnboim (2006) Dekel, A. & Birnboim, Y. 2006, MNRAS, 368, 2
- Donzelli & Pastoriza (2000) Donzelli, C. J. & Pastoriza, M. G. 2000, AJ, 120, 189
- Dressler (1980) Dressler, A. 1980, ApJ, 236, 351
- Edvardsson et al. (1993) Edvardsson, B., Andersen, J., Gustafsson, B., et al. 1993, A&A, 275, 101
- Erwin et al. (2008) Erwin, P., Pohlen, M., & Beckman, J. E. 2008, AJ, 135, 20
- Feltzing et al. (2001) Feltzing, S., Holmberg, J., & Hurley, J. R. 2001, A&A, 377, 911
- Fenner & Gibson (2003) Fenner, Y. & Gibson, B. K. 2003, PASA, 20, 189
- Few et al. (2014) Few, C. G., Courty, S., Gibson, B. K., Michel-Dansac, L., & Calura, F. 2014, MNRAS, 444, 3845
- Few et al. (2012) Few, C. G., Gibson, B. K., Courty, S., et al. 2012, A&A, 547, A63
- Freeman (1970) Freeman, K. C. 1970, ApJ, 160, 811
- Ganda et al. (2009) Ganda, K., Peletier, R. F., Balcells, M., & Falcón-Barroso, J. 2009, MNRAS, 395, 1669
- Gibson et al. (1999) Gibson, B. K., Madgwick, D. S., Jones, L. A., Da Costa, G. S., & Norris, J. E. 1999, AJ, 118, 1268
- Gibson et al. (2013) Gibson, B. K., Pilkington, K., Brook, C. B., Stinson, G. S., & Bailin, J. 2013, A&A, 554, A47
- Governato et al. (2004) Governato, F., Mayer, L., Wadsley, J., et al. 2004, ApJ, 607, 688
- Governato et al. (2007) Governato, F., Willman, B., Mayer, L., et al. 2007, MNRAS, 374, 1479
- Gutiérrez et al. (2011) Gutiérrez, L., Erwin, P., Aladro, R., & Beckman, J. E. 2011, AJ, 142, 145
- Halle et al. (2015) Halle, A., Di Matteo, P., Haywood, M., & Combes, F. 2015, A&A, 578, A58
- Haywood et al. (2013) Haywood, M., Di Matteo, P., Lehnert, M. D., Katz, D., & Gómez, A. 2013, A&A, 560, A109
- Hearnshaw (1972) Hearnshaw, J. B. 1972, MmRAS, 77, 55
- Hidalgo et al. (2013) Hidalgo, S. L., Monelli, M., Aparicio, A., et al. 2013, ApJ, 778, 103
- Hill et al. (2008) Hill, G. J., MacQueen, P. J., Smith, M. P., et al. 2008, in Society of Photo-Optical Instrumentation Engineers (SPIE) Conference Series, Vol. 7014, Society of Photo-Optical Instrumentation Engineers (SPIE) Conference Series
- Holmberg et al. (2009) Holmberg, J., Nordström, B., & Andersen, J. 2009, A&A, 501, 941
- House et al. (2011) House, E. L., Brook, C. B., Gibson, B. K., et al. 2011, MNRAS, 415, 2652
- Hummels & Bryan (2012) Hummels, C. B. & Bryan, G. L. 2012, ApJ, 749, 140
- Hunter (2007) Hunter, J. D. 2007, Computing In Science & Engineering, 9, 90
- Jonsson (2006) Jonsson, P. 2006, MNRAS, 372, 2
- Katz & Gunn (1991) Katz, N. & Gunn, J. E. 1991, ApJ, 377, 365
- Katz et al. (1992) Katz, N., Hernquist, L., & Weinberg, D. H. 1992, ApJ, 399, L109
- Kazantzidis et al. (2008) Kazantzidis, S., Bullock, J. S., Zentner, A. R., Kravtsov, A. V., & Moustakas, L. A. 2008, ApJ, 688, 254
- Kereš et al. (2005) Kereš, D., Katz, N., Weinberg, D. H., & Davé, R. 2005, MNRAS, 363, 2
- Kewley et al. (2006) Kewley, L. J., Geller, M. J., & Barton, E. J. 2006, AJ, 131, 2004
- Kordopatis et al. (2013) Kordopatis, G., Gilmore, G., Steinmetz, M., et al. 2013, AJ, 146, 134
- Lacey & Cole (1993) Lacey, C. & Cole, S. 1993, MNRAS, 262, 627
- Lambas et al. (2003) Lambas, D. G., Tissera, P. B., Alonso, M. S., & Coldwell, G. 2003, MNRAS, 346, 1189
- Leitherer et al. (1999) Leitherer, C., Schaerer, D., Goldader, J. D., et al. 1999, ApJS, 123, 3
- MacArthur et al. (2009) MacArthur, L. A., González, J. J., & Courteau, S. 2009, MNRAS, 395, 28
- Macciò et al. (2012) Macciò, A. V., Stinson, G., Brook, C. B., et al. 2012, ApJ, 744, L9
- Majewski et al. (2010) Majewski, S. R., Wilson, J. C., Hearty, F., Schiavon, R. R., & Skrutskie, M. F. 2010, in IAU Symposium, Vol. 265, IAU Symposium, ed. K. Cunha, M. Spite, & B. Barbuy, 480–481
- Marinacci et al. (2014) Marinacci, F., Pakmor, R., & Springel, V. 2014, MNRAS, 437, 1750
- Márquez et al. (2002) Márquez, I., Masegosa, J., Moles, M., et al. 2002, A&A, 393, 389
- Martig et al. (2014) Martig, M., Minchev, I., & Flynn, C. 2014, MNRAS, 443, 2452
- Martínez-Serrano et al. (2009) Martínez-Serrano, F. J., Serna, A., Doménech-Moral, M., & Domínguez-Tenreiro, R. 2009, ApJ, 705, L133
- Matteucci & Gibson (1995) Matteucci, F. & Gibson, B. K. 1995, A&A, 304, 11
- McConnachie et al. (2009) McConnachie, A. W., Irwin, M. J., Ibata, R. A., et al. 2009, Nature, 461, 66
- Michel-Dansac et al. (2008) Michel-Dansac, L., Lambas, D. G., Alonso, M. S., & Tissera, P. 2008, MNRAS, 386, L82
- Minchev et al. (2013) Minchev, I., Chiappini, C., & Martig, M. 2013, A&A, 558, A9
- Minchev et al. (2014) Minchev, I., Chiappini, C., & Martig, M. 2014, A&A, 572, A92
- Minchev & Famaey (2010) Minchev, I. & Famaey, B. 2010, ApJ, 722, 112
- Minchev et al. (2012a) Minchev, I., Famaey, B., Quillen, A. C., et al. 2012a, A&A, 548, A127
- Minchev et al. (2012b) Minchev, I., Famaey, B., Quillen, A. C., et al. 2012b, A&A, 548, A126
- Minchev et al. (2015) Minchev, I., Martig, M., Streich, D., et al. 2015, ApJ, 804, L9
- Navarro & Benz (1991) Navarro, J. F. & Benz, W. 1991, ApJ, 380, 320
- Navarro & White (1994) Navarro, J. F. & White, S. D. M. 1994, MNRAS, 267, 401
- Nidever et al. (2014) Nidever, D. L., Bovy, J., Bird, J. C., et al. 2014, ApJ, 796, 38
- Nordström et al. (2004) Nordström, B., Mayor, M., Andersen, J., et al. 2004, A&A, 418, 989
- Obreja et al. (2014) Obreja, A., Brook, C. B., Stinson, G., et al. 2014, MNRAS, 442, 1794
- Peletier et al. (2012) Peletier, R. F., Kutdemir, E., van der Wolk, G., et al. 2012, MNRAS, 419, 2031
- Pérez & Sánchez-Blázquez (2011) Pérez, I. & Sánchez-Blázquez, P. 2011, A&A, 529, A64
- Perryman et al. (2001) Perryman, M. A. C., de Boer, K. S., Gilmore, G., et al. 2001, A&A, 369, 339
- Pilkington et al. (2012a) Pilkington, K., Few, C. G., Gibson, B. K., et al. 2012a, A&A, 540, A56
- Pilkington et al. (2012b) Pilkington, K., Gibson, B. K., Brook, C. B., et al. 2012b, MNRAS, 425, 969
- Pohlen & Trujillo (2006) Pohlen, M. & Trujillo, I. 2006, A&A, 454, 759
- Powell (1972) Powell, A. L. T. 1972, MNRAS, 155, 483
- Prantzos & Aubert (1995) Prantzos, N. & Aubert, O. 1995, A&A, 302, 69
- Quillen et al. (2009) Quillen, A. C., Minchev, I., Bland-Hawthorn, J., & Haywood, M. 2009, MNRAS, 397, 1599
- Quinn et al. (1993) Quinn, P. J., Hernquist, L., & Fullagar, D. P. 1993, ApJ, 403, 74
- Rahimi et al. (2010) Rahimi, A., Kawata, D., Brook, C. B., & Gibson, B. K. 2010, MNRAS, 401, 1826
- Robertson et al. (2004) Robertson, B., Yoshida, N., Springel, V., & Hernquist, L. 2004, ApJ, 606, 32
- Roediger et al. (2012) Roediger, J. C., Courteau, S., Sánchez-Blázquez, P., & McDonald, M. 2012, ApJ, 758, 41
- Romano et al. (2005) Romano, D., Chiappini, C., Matteucci, F., & Tosi, M. 2005, A&A, 430, 491
- Roškar et al. (2008a) Roškar, R., Debattista, V. P., Quinn, T. R., Stinson, G. S., & Wadsley, J. 2008a, ApJ, 684, L79
- Roškar et al. (2012) Roškar, R., Debattista, V. P., Quinn, T. R., & Wadsley, J. 2012, MNRAS, 426, 2089
- Roškar et al. (2008b) Roškar, R., Debattista, V. P., Stinson, G. S., et al. 2008b, ApJ, 675, L65
- Ruiz-Lara et al. (2016) Ruiz-Lara, T., Pérez, I., Florido, E., et al. 2016, MNRAS, 456, L35
- Ruiz-Lara et al. (2015) Ruiz-Lara, T., Pérez, I., Gallart, C., et al. 2015, A&A, 583, A60
- Sánchez et al. (2012) Sánchez, S. F., Kennicutt, R. C., Gil de Paz, A., et al. 2012, A&A, 538, A8
- Sánchez-Blázquez et al. (2009) Sánchez-Blázquez, P., Courty, S., Gibson, B. K., & Brook, C. B. 2009, MNRAS, 398, 591
- Sánchez-Blázquez et al. (2011) Sánchez-Blázquez, P., Ocvirk, P., Gibson, B. K., Pérez, I., & Peletier, R. F. 2011, MNRAS, 415, 709
- Sánchez-Blázquez et al. (2014) Sánchez-Blázquez, P., Rosales-Ortega, F. F., Méndez-Abreu, J., et al. 2014, A&A, 570, A6
- Scannapieco et al. (2009) Scannapieco, C., White, S. D. M., Springel, V., & Tissera, P. B. 2009, MNRAS, 396, 696
- Schönrich & Binney (2009) Schönrich, R. & Binney, J. 2009, MNRAS, 396, 203
- Seabroke & Gilmore (2007) Seabroke, G. M. & Gilmore, G. 2007, MNRAS, 380, 1348
- Sellwood & Binney (2002) Sellwood, J. A. & Binney, J. J. 2002, MNRAS, 336, 785
- Siebert et al. (2011) Siebert, A., Williams, M. E. K., Siviero, A., et al. 2011, AJ, 141, 187
- Snaith et al. (2014) Snaith, O. N., Haywood, M., Di Matteo, P., et al. 2014, ApJ, 781, L31
- Soubiran et al. (2008) Soubiran, C., Bienaymé, O., Mishenina, T. V., & Kovtyukh, V. V. 2008, A&A, 480, 91
- Steinmetz & Muller (1995) Steinmetz, M. & Muller, E. 1995, MNRAS, 276, 549
- Steinmetz & Navarro (2002) Steinmetz, M. & Navarro, J. F. 2002, New A, 7, 155
- Steinmetz et al. (2006) Steinmetz, M., Zwitter, T., Siebert, A., et al. 2006, AJ, 132, 1645
- Stinson et al. (2010) Stinson, G. S., Bailin, J., Couchman, H., et al. 2010, MNRAS, 408, 812
- Stinson et al. (2012) Stinson, G. S., Brook, C., Prochaska, J. X., et al. 2012, MNRAS, 425, 1270
- Teyssier (2002) Teyssier, R. 2002, A&A, 385, 337
- Twarog (1980) Twarog, B. A. 1980, ApJ, 242, 242
- Tweed et al. (2009) Tweed, D., Devriendt, J., Blaizot, J., Colombi, S., & Slyz, A. 2009, A&A, 506, 647
- Vera-Ciro et al. (2014) Vera-Ciro, C., D’Onghia, E., Navarro, J., & Abadi, M. 2014, ApJ, 794, 173
- Villalobos & Helmi (2008) Villalobos, Á. & Helmi, A. 2008, MNRAS, 391, 1806
- Villalobos & Helmi (2009) Villalobos, Á. & Helmi, A. 2009, MNRAS, 399, 166
- Walker et al. (2014) Walker, A. P., Gibson, B. K., Pilkington, K., et al. 2014, MNRAS, 441, 525
- White & Rees (1978) White, S. D. M. & Rees, M. J. 1978, MNRAS, 183, 341
- Wielen (1977) Wielen, R. 1977, A&A, 60, 263
- Williams et al. (2009) Williams, B. F., Dalcanton, J. J., Dolphin, A. E., Holtzman, J., & Sarajedini, A. 2009, ApJ, 695, L15
- Yanny et al. (2009) Yanny, B., Rockosi, C., Newberg, H. J., et al. 2009, AJ, 137, 4377
- Yoachim et al. (2012) Yoachim, P., Roškar, R., & Debattista, V. P. 2012, ApJ, 752, 97
- Younger et al. (2007) Younger, J. D., Cox, T. J., Seth, A. C., & Hernquist, L. 2007, ApJ, 670, 269
- Zwitter et al. (2008) Zwitter, T., Siebert, A., Munari, U., et al. 2008, AJ, 136, 421
Appendix A Surface Brightness profiles
The study of the light distribution in observed spiral galaxies has led recently to a rapid evolution in our thinking regarding its structural characteristics. The wide variety of surface brightness (SB) profiles reported (e.g. Pohlen & Trujillo 2006; Erwin et al. 2008; Gutiérrez et al. 2011, amongst others) intimates that such profiles may hold a key piece of the puzzle towards understanding galaxy formation and evolution; the plethora of profiles now found in the literature are a contrast to the canonical wisdom that discs were single exponentials (Freeman 1970). For completeness, we show here the light distribution of the RaDES sample, derived from one-dimensional SB profiles of the mock images presented in (Few et al. 2012); these images were produced using SUNRISE (Jonsson 2006). SUNRISE uses the stellar and gaseous distributions, as well as Spectral Energy Distributions (SEDs) for each composite stellar particle, drawn from the Starburst99 stellar population models (Leitherer et al. 1999), in order to generate the bandpass-dependent mock images. One-dimensional profiles were then fitted with the function presented in (Erwin et al. 2008, equations 5 and 6) with a broken exponential profile implemented. This way, we can distinguish between galaxies with exponential, up-bending, or down-bending profiles, as well as characterise the light distribution of the inner and outer discs. Fig. 18 shows those profiles. Table 3 summarises the light distribution information for the 19 simulated galaxies.
| Galaxy | SB type | (kpc) | (kpc) | (kpc) | ||||||
|---|---|---|---|---|---|---|---|---|---|---|
| g | r | i | g | r | i | g | r | i | ||
| Apollo | II | 2.68 | 2.34 | 2.19 | 1.24 | 1.39 | 1.44 | 5.14 | 4.96 | 4.94 |
| Artemis | III | 0.60 | 0.79 | 0.78 | 5.56 | 5.87 | 5.97 | 4.27 | 5.30 | 5.30 |
| Atlas | II | 5.08 | 4.39 | 3.43 | 2.31 | 2.47 | 2.53 | 7.63 | 7.43 | 7.91 |
| Ben | II | 5.88 | 5.28 | 5.03 | 3.15 | 3.36 | 3.36 | 12.33 | 12.18 | 12.42 |
| Castor | II | 10.06 | 5.70 | 5.32 | 0.95 | 0.96 | 0.96 | 5.37 | 5.35 | 5.32 |
| Daphne | III | 1.23 | 1.26 | 1.27 | 3.76 | 3.84 | 3.81 | 10.05 | 10.08 | 10.08 |
| Eos | III | 2.96 | 2.95 | 2.91 | 8.38 | 8.55 | 8.37 | 19.32 | 18.32 | 17.84 |
| Helios | III | 1.92 | 1.93 | 2.01 | 7.73 | 7.76 | 7.82 | 11.54 | 11.49 | 11.74 |
| Hyperion | II | 4.54 | 4.31 | 4.24 | 2.51 | 2.77 | 2.78 | 14.94 | 14.97 | 15.15 |
| Krios | III | 2.63 | 2.62 | 2.63 | 8.51 | 8.45 | 8.33 | 16.82 | 16.11 | 15.85 |
| Leia | III | 3.65 | 3.81 | 3.90 | 7.37 | 7.48 | 7.58 | 20.95 | 21.21 | 21.62 |
| Leto | III | 0.95 | 0.99 | 1.00 | 4.11 | 4.07 | 3.99 | 6.65 | 6.59 | 6.51 |
| Luke | I | 5.84 | 5.78 | 5.77 | - | - | - | - | - | - |
| Oceanus | II | 8.19 | 8.08 | 7.93 | 5.17 | 4.18 | 4.39 | 21.19 | 23.17 | 23.21 |
| Pollux | III | 1.20 | 1.25 | 1.22 | 4.33 | 4.03 | 3.93 | 8.80 | 8.61 | 8.41 |
| Selene | II | 5.74 | 5.68 | 5.36 | 1.73 | 2.01 | 1.98 | 12.75 | 11.98 | 12.13 |
| Tethys | II | 5.23 | 4.43 | 4.20 | 1.97 | 2.12 | 2.16 | 9.92 | 9.82 | 9.85 |
| Tyndareus | III | 1.34 | 1.33 | 1.33 | 3.67 | 3.39 | 3.22 | 7.69 | 7.12 | 6.89 |
| Zeus | I | 0.90 | 0.92 | 0.92 | - | - | - | - | - | - |