Far-UV spectroscopy of the planet-hosting star WASP-13: high-energy irradiance, distance, age, planetary mass-loss rate, and circumstellar environment
Abstract
Several transiting hot Jupiters orbit relatively inactive main-sequence stars. For some of those, the activity parameter lies below the basal level (5.1). Two explanations have been proposed so far: (i) the planet affects the stellar dynamo, (ii) the measurements are biased by extrinsic absorption, either by the interstellar medium (ISM) or by material local to the system. We present here Hubble Space Telescope/COS far-UV spectra of WASP-13, which hosts an inflated hot Jupiter and has a measured value (5.26), well below the basal level. From the star’s spectral energy distribution we obtain an extinction = 0.0450.025 mag and a distance = 2328 pc. We detect at 4 lines belonging to three different ionization states of carbon (C I, C II, and C IV) and the Si IV doublet at 3. Using far-UV spectra of nearby early G-type stars of known age, we derive a C IV/C I flux ratio–age relation, from which we estimate WASP-13’s age to be 5.12.0 Gyr. We rescale the solar irradiance reference spectrum to match the flux of the C IV 1548 doublet. By integrating the rescaled solar spectrum, we obtain an XUV flux at 1 AU of 5.4 erg s-1 cm-2. We use a detailed model of the planet’s upper atmosphere, deriving a mass-loss rate of 1.51011 g s-1. Despite the low value, the star shows a far-UV spectrum typical of middle-aged solar-type stars, pointing toward the presence of significant extrinsic absorption. The analysis of a high-resolution spectrum of the Ca II H&K lines indicates that the ISM absorption could be the origin of the low value. Nevertheless, the large uncertainty in the Ca II ISM abundance does not allow us to firmly exclude the presence of circumstellar gas.
1 Introduction
To date, over 200 close-in (0.1 AU) giant planets (hot Jupiters) have been discovered. These planets were not expected to survive for long owing to the rapid evaporation of their atmospheres under the effect of the strong stellar irradiation. Hubble Space Telescope (HST) ultraviolet (UV) observations confirmed that the atmospheres of hot Jupiters such as HD 209458 b, HD 189733 b, and WASP-12 b are evaporating (Vidal-Madjar et al. 2003; Linsky et al. 2010; Haswell et al. 2012; Bourrier et al. 2013; Fossati et al. 2015a). The stellar extreme-UV (EUV) flux heats the atmosphere of hot Jupiters to temperatures up to 104 K, leading to atmospheric mass loss on the order of 109 (Lecavelier Des Etangs 2007; Ehrenreich & Désert 2011; Koskinen et al. 2013a, b), which, however, does not seem to significantly reduce the planetary mass within the star’s main-sequence lifetime (Yelle 2004; García Muñoz 2007).
A number of hot Jupiters are found orbiting around low-activity stars ( -5.0), which is loosely correlated with the biases that stellar activity introduces in detecting planets around active stars. Stellar activity, directly related to the EUV flux (e.g., Piters et al. 1997), plays a crucial role in shaping planets’ structure and evolution (e.g., Hubeny et al. 2003; Fortney et al. 2008; Davis & Wheatley 2009; Zahnle et al. 2009; Howard et al. 2012; Hu et al. 2012; Mordasini et al. 2012; Beaugé & Nesvorný 2013). It is therefore crucial to carefully study the activity of fairly inactive stars to accurately infer their EUV fluxes.
Given their intrinsically low levels of chromospheric emission, all but the nearest relatively inactive solar-type stars have proved difficult to study at UV wavelengths. However, given the new interest in exoplanet host stars and technological advances in spectroscopic instrumentation on HST in the preceding decade (e.g., the installation of the Cosmic Origins Spectrograph; Green et al. 2012), there has been a renewed interest in the study of relatively inactive, late-type dwarf stars (e.g., France et al. 2013; Linsky et al. 2013; Stelzer et al. 2013). The lack of information about the high-energy radiation of inactive stars has limited reliable calculations of atmosphere and evolution models of planets orbiting close to such stars. Linsky et al. (2013, 2014) used nearby stars, for which optical, far-UV (FUV), and EUV spectra are available, to construct relations between EUV fluxes and various UV and optical chromospheric emission features. These relations have typical uncertainties of the order of 15–50%, depending on the considered wavelength region. Therefore, more detailed observations are needed to improve the EUV flux estimates for the most inactive stars. Some hot-Jupiter hosts, such as WASP-12, have an anomalously low activity level, well below the range covered by the reference stars adopted by Linsky et al. (2013, 2014).
The late F-type star WASP-12 hosts one of the hottest and most bloated known exoplanets (Hebb et al. 2009). Near-UV (NUV) HST COS data revealed that the upper atmosphere of WASP-12 b overfills its Roche lobe and is losing mass rapidly (Fossati et al. 2010a; Haswell et al. 2012). The HST data also revealed the presence of a broad depression in place of the normally bright emission cores in the Mg II h&k resonance lines (Haswell et al. 2012). Fossati et al. (2013) showed that the Ca II H&K line cores also present broad and deep depressions, similar to the Mg II h&k line profiles. The anomaly is always present, regardless of the planet’s orbital phase. The absence of Mg II core emission was unexpected given the star’s spectral type and age (F9V, effective temperature of 6250 K, age 2.65 Gyr; Fossati et al. 2010b). This peculiarity is reflected in an anomalously low value111The value is a measure of the chromospheric emission in the core of the Ca II H&K resonance lines (Duncan et al. 1991). For reference, the average solar value is 4.9020.063 (95% confidence level; Mamajek & Hillenbrand 2008). At maximum of activity (e.g., on cycle 22) the solar value is typically about 4.780, while at minimum the solar value is typically about 4.966. The Sun during the Maunder minimum was believed to have a value of 5.102 (Baliunas & Jastrow 1990; Donahue 1998; Keil et al. 1998; Radick et al. 1998; Livingston et al. 2007). of -5.500 (Knutson et al. 2010), far below the basal flux level of main-sequence late-type stars of = -5.1 (Wright et al. 2004).
Fossati et al. (2013) analyzed the origin of the anomalous line cores, concluding that extrinsic absorption by material local to the WASP-12 system is the most likely cause: gas escaping from the heavily irradiated planet could form a stable and translucent circumstellar cloud (Haswell et al. 2012). Theoretical support to this idea has been given by Cohen et al. (2011), Lanza (2014), Matsakos et al. (2015), and Fossati et al. (2015b). The H2 fluorescence observed around planet-hosting M-type stars could also be a similar manifestation (France et al. 2013). Nevertheless, detailed hydrodynamic simulations and radiative transfer calculations should be carried out to explore the spreading of the specific ions escaping from the planet and whether their column density would be large enough to affect the stellar core emission in the Mg II h&k and Ca II H&K resonance lines.
The anomalously low stellar activity index of WASP-12 may therefore be a direct consequence of the extra line core absorption. For stars hosting close-in evaporating planets, it may not be therefore possible to evaluate the actual stellar activity from the value. Pillitteri et al. (2014) explained the low activity level and X-ray flux of WASP-18, an F9V star hosting a massive hot Jupiter, by involving an anomalous decrease of the stellar activity caused by the planet affecting the stellar dynamo. Because of the high formation temperature, several lines in the FUV would not be absorbed by the interstellar medium (ISM) and circumstellar cloud, allowing one to retrieve the actual stellar activity, which can then be compared to that obtained from other indicators. The FUV flux level discriminates therefore between the two explanations for the depressed values observed for several hot-Jupiter host stars.
We present here COS FUV observations of the G1V star WASP-13 ( = 1.187 and = 1.574 ; Gómez Maqueo Chew et al. 2013), which hosts an extremely inflated hot Jupiter ( = 0.5000.037 and = 1.4070.052 ; Skillen et al. 2009; Gómez Maqueo Chew et al. 2013) and displays an activity well below the basal level with = -5.2630.09 (Knutson et al. 2010; Fossati et al. 2013), where the uncertainty is the typical standard deviation in the value caused by variability within the activity cycle of an inactive star (Lanza 2014). There is a rather large spread of ages for WASP-13 present in the literature: 8.55.0 Gyr (Skillen et al. 2009), 7.40.4 Gyr (Barros et al. 2012), 4–5.5 Gyr (Gómez Maqueo Chew et al. 2013), and 12.590.01 Gyr (Bonfanti et al. 2015).
Figures 3 and 4 of Wright et al. (2004) indicate that there are stars with a value below the basal level, but these stars are subgiants and hence evolved off the main sequence. Even without recognizing the distinction between main-sequence and evolved stars in terms of activity, the index of WASP-13 is among the lowest in the literature for solar-type stars. It is therefore worth examining whether the index is a good measure of the “true” activity of the star; this is our primary aim. We use higher-ionization FUV emission lines, not affected by extrinsic absorption (e.g., C IV and Si IV), to estimate the true stellar activity, derive the EUV flux, and attempt to identify the origin of the low value.
Section 2 describes the HST observations and the applied data reduction. In Section 3 we gather the results: analysis of the FUV planet transit (Section 3.1), estimate of the distance to the star and interstellar extinction (Section 3.2), and measurements of the FUV stellar emission lines (Section 3.3). In Section 4 we estimate the stellar chromospheric activity (Section 4.1), age (Section 4.1), and high-energy flux (Section 4.2), and perform an analysis aiming at the detection of the circumstellar material (Section 4.3). We draw the conclusions in Section 5.
2 Observations and data reduction
We observed the planet-hosting star WASP-13 using the FUV channel of HST/COS. The observations were conducted on 2015 April 24 along four consecutive HST orbits, timed with the planet’s primary transit. The observing log is given in Table 1. Each spectrum was taken using the FUV G140L grating at the 1105 Å setting, which provides a continuous spectrum over the 1128–2236 Å wavelength range at a spectral resolution of 3000, in TIME-TAG mode. To achieve the maximum possible stability to attempt the detection of the planet transit, we adopted one single FP position (i.e., FP-POS = 3; see the COS user manual222http://www.stsci.edu/hst/cos/documents/handbooks/current/cos_cover.html for details).
| JD | Exp. Time | Pl. Orbital | |
|---|---|---|---|
| 2,450,000 | (s) | Phase Range | |
| Orbit 1 | 7133.788574 | 2522.176 | 0.973 0.980 |
| Orbit 2 | 7133.851562 | 2971.168 | 0.987 0.995 |
| Orbit 3 | 7133.917969 | 2971.200 | 1.002 1.010 |
| Orbit 4 | 7133.983887 | 2971.200 | 1.017 1.025 |
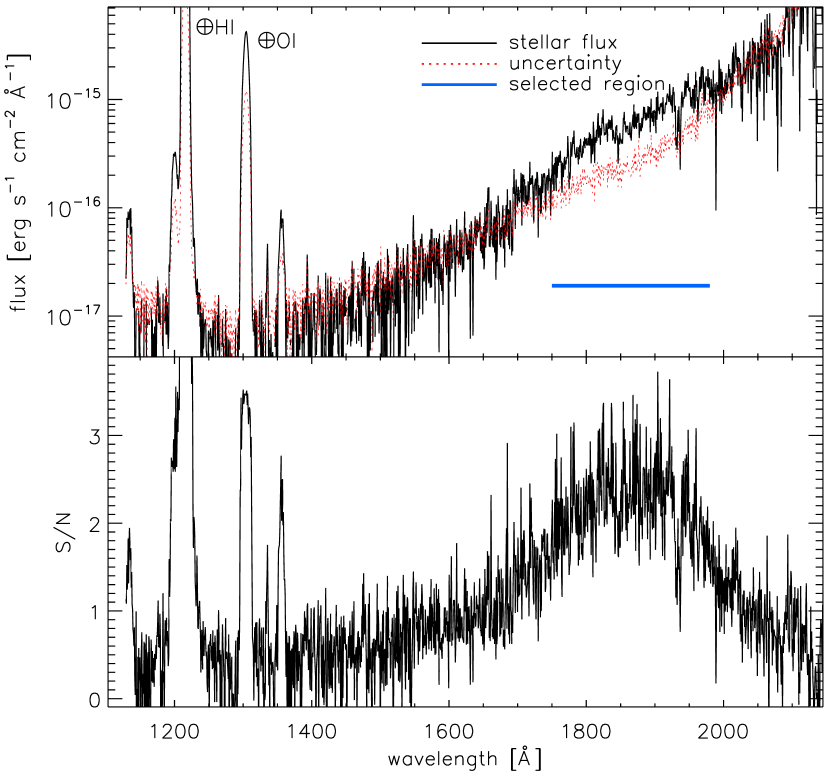
We retrieved the data, reduced with CALCOS V.3.0, from the MAST333http://archive.stsci.edu/ archive and co-added the four flux-calibrated spectra, using the routine described by Danforth et al. (2010), in order to obtain one spectrum with the highest possible signal-to-noise ratio (S/N). The final co-added FUV spectrum of WASP-13 is shown in Figure 1. The strong emission lines at short wavelengths are caused by geocoronal emission from atomic hydrogen and oxygen, while the rise in flux at longer wavelengths is due to the emission from the stellar photosphere, indicating that the star was indeed detected in the FUV.
3 Results
3.1 Planet transit
To investigate the FUV transit properties of WASP-13 b, we adopted the ephemeris given by Barros et al. (2012), which results in having the second and third exposures being obtained during the transit, while the first/fourth exposures are obtained before/after the ingress/egress. Given the low stellar flux present in the emission lines (see Sect 3.3), we attempted the detection of the planet transit in the 1750–1980 Å wavelength range, dominated by photospheric flux; this is the wavelength range that minimizes the uncertainties on the integrated fluxes (see Figure 1).
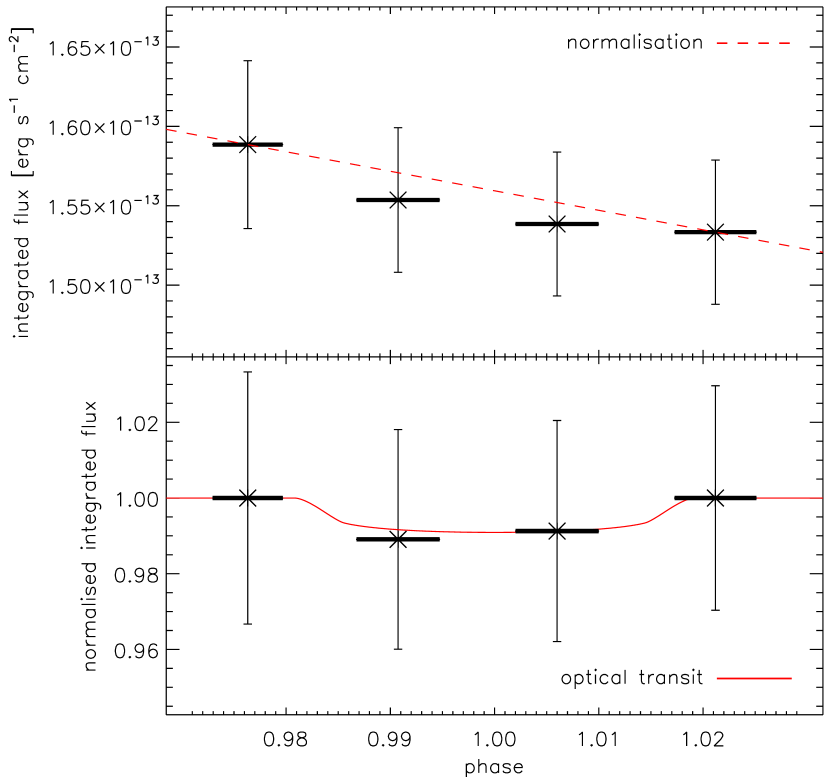
Figure 2 shows the results of the integration in wavelength for each of the four spectra. The uncertainties are consistent with the scatter obtained by splitting each point into three observations of equal exposure time using the TIME-TAG. To compare the observations with the optical transit, calculated in the band using the ephemeris and planet parameters given by Barros et al. (2012), we divided each point by the line connecting the out-of-transit integrated fluxes. Despite the large considered wavelength region, the photometric uncertainties, of the order of 3.5%, are too large to detect the planet transit, which has a depth of about 1% (in flux). The planet radius observed in the 1750–1980 Å wavelength range is therefore likely to be smaller than 2.9 .
We then calculated the Rayleigh scattering transit depth (e.g., Hubbard et al. 2001) to check whether the nondetection of the transit in the FUV would give any constraints on the presence, or not, of Rayleigh scattering in the planet’s atmosphere. We adopted the system parameters given by Barros et al. (2012) and assumed a temperature of 1500 K at pressures higher than 10-6 bar. We calculated the equilibrium mixing ratios of H2 and H as a function of altitude based on the temperature and pressure and used Rayleigh scattering cross sections from Dalgarno & Williams (1965) for H2. We found that Rayleigh scattering by H (Lee & Kim 2004), which is also included in our calculation, is negligible for WASP-13 b. Our results indicate that the transit depth due to Rayleigh scattering by H2 at 1750–1980 Å is only about 9% deeper than in the optical. The photometric uncertainties are therefore too large to provide significant (2) constraints on the presence of Rayleigh scattering in the planet’s atmosphere.
3.2 Distance to the star and interstellar extinction
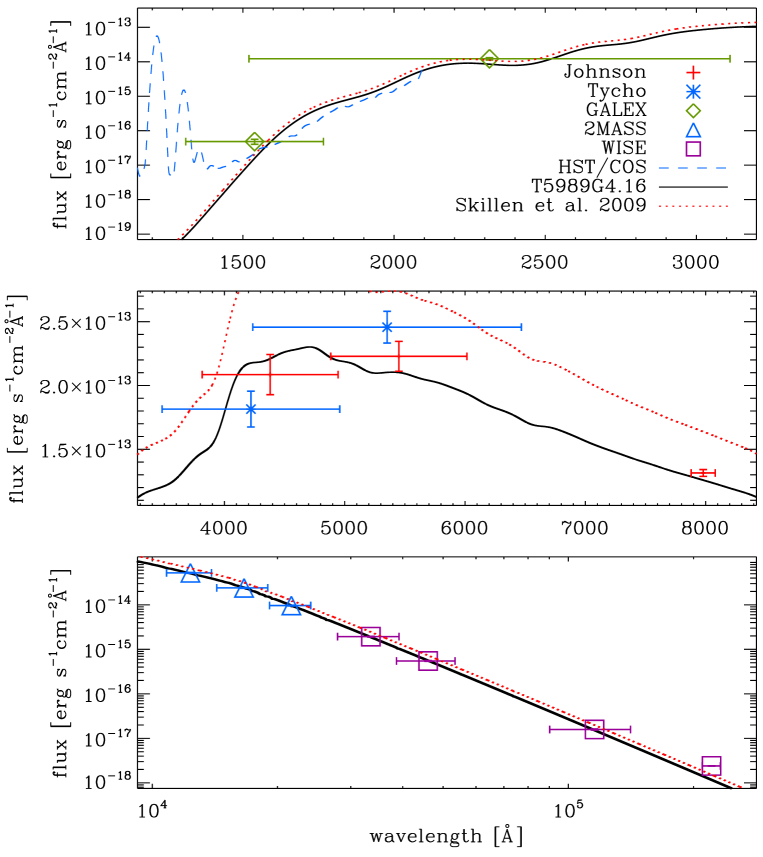
To estimate the interstellar extinction along the WASP-13’s line of sight, we used the available infrared, optical, and UV photometry, together with synthetic stellar fluxes, to fit the star’s spectral energy distribution (SED). To construct the observed SED, we considered Two Micron All Sky Survey (2MASS) and WISE infrared photometry from Cutri et al. (2013) with calibrations from van der Bliek et al. (1996) and Wright et al. (2010), respectively, TYCHO photometry from Høg et al. (2000) with calibrations from Mann & von Braun (2015), Johnson photometry from Kharchenko (2001, -band) and Droege et al. (2006, - and -band) with calibrations from Bessell et al. (1998), and GALEX UV fluxes from Shkolnik (2013).
We calculated the stellar synthetic fluxes with the model atmosphere code LLmodels (Shulyak et al. 2004), using the atmospheric parameters given by Gómez Maqueo Chew et al. (2013): effective temperature () of 5989 K, surface gravity () of 4.16, and solar metallicity (Asplund et al. 2009). Despite the noninclusion of molecular opacities in LLmodels, a comparison with marcs models (Gustafsson et al. 2008) shows that LLmodels can be safely used for stars at least as cool as the Sun, hence WASP-13 as well. When fitting synthetic fluxes to observed fluxes, the distance to the star and the stellar radius are degenerate. We adopted the stellar radius of = 1.5740.048 (Gómez Maqueo Chew et al. 2013) to derive the distance to the star and the interstellar extinction, the latter modeled using the Fitzpatrick (1999) extinction model and assuming a total-to-selective extinction coefficient of = 3.1.
Since LLmodels calculates solely the photospheric fluxes and does not account for chromospheric/coronal emission, we only considered the NUV band of the GALEX fluxes in the fit. Here the major chromospheric contribution would come from the Mg II h&k chromospheric line core emission, which for WASP-13 is negligible compared to the total NUV photospheric emission (see Section 4.2). During the SED analysis, we noticed that the TYCHO - and Johnson -band fluxes were always far higher than the synthetic fluxes best fitting all other constraints; hence, we decided to exclude them from the fit. We have not been able to find the origin of these discrepancies. We also did not consider the reddest WISE flux in the fit, because it is an upper limit (Cutri et al. 2013). The fit was done taking into account the transmission curves specific for each filter, downloaded from the Virtual Observatory444http://svo2.cab.inta-csic.es/svo/theory/fps3/.
The best fit to the observed SED is shown in Figure 3 and is obtained with a distance to the star of = 2328 pc and an interstellar extinction of = 0.0450.025 mag, with a of 13.5 and 8 degrees of freedom. These uncertainties incorporate the error bar on the stellar radius. In Figure 3 we plot also the observed COS fluxes, but do not consider them for the fit, though the photospheric-dominated part agrees well with the best-fitting synthetic fluxes.
The derived distance is in clear disagreement with that given in the WASP-13 b discovery paper = 15518 pc (Skillen et al. 2009) and currently listed in the available exoplanet databases (e.g., http://exoplanets.org/ and http://exoplanet.eu/). We have confidence that our result is correct, as we explain now. Ignoring extinction, it is possible to analytically estimate the distance based on the stellar apparent magnitude and luminosity:
| (1) |
where is the apparent stellar Johnson -band magnitude, is the apparent Johnson -band magnitude of the Sun (we adopted = 26.73 mag), is the stellar luminosity (calculated from and radius), is the solar luminosity, is the distance to the Sun (1 AU), and is the distance to the star. In this way we obtained a distance = 233 pc, which is in excellent agreement with that obtained from our SED fitting. We further compared the derived extinction with the value given by the Galactic extinction maps of Amôres & Lépine (2005), assuming a distance of 232 pc, obtaining = 0.050 mag, which is in good agreement with our result. Figure 3 shows also that the SED obtained considering the stellar parameters and distance given by Skillen et al. (2009) does not fit the available photometry.
We used the value obtained from the SED fitting to derive the ISM H I, C I, C II, C IV, Si IV, Mg II, Ca II, and Na I column density. We considered solar abundances from Asplund et al. (2009) and the ISM ionization mix by Frisch & Slavin (2003, their model 2 - Table 5). We derived the column densities considering four different – conversions555Given the small value, we assumed that hydrogen is not in molecular form (e.g., Rachford et al. 2002). given by Savage & Mathis (1979), Diplas & Savage (1994), Güver & Özel (2009), and Gudennavar et al. (2012). For Mg II, Ca II, and Na I we also derived the column densities by considering the ISM ion abundance as a function of the H I column density given by Wakker & Mathis (2000). The results are listed in Table 2.
| Assumptions | log NHI | log NCI | log NCII | log NCIV | log NSiIV | log NMgII | log NCaII | log NNaI |
|---|---|---|---|---|---|---|---|---|
| SM79+A09+FS03 | 20.42 | 13.47 | 16.79 | 0.00 | 11.39 | 15.89 | 12.97 | 11.77 |
| DS94+A09+FS03 | 20.35 | 13.40 | 16.72 | 0.00 | 11.32 | 15.82 | 12.90 | 11.70 |
| GO09+A09+FS03 | 20.49 | 13.54 | 16.87 | 0.00 | 11.46 | 15.97 | 13.04 | 11.84 |
| G12+A09+FS03 | 20.81 | 13.86 | 17.19 | 0.00 | 11.79 | 16.29 | 13.36 | 12.17 |
| SM79+WM00 | 20.42 | – | – | – | – | 14.97 | 11.94 | 12.15 |
| DS94+WM00 | 20.35 | – | – | – | – | 14.91 | 11.93 | 12.09 |
| GO09+WM00 | 20.49 | – | – | – | – | 15.02 | 11.96 | 12.21 |
| G12+WM00 | 20.81 | – | – | – | – | 15.27 | 12.03 | 12.48 |
For the elements considered here, C II, Si II, Mg II, Ca II, and Na I are the main ionization stages in the ISM. At the low value of WASP-13, almost all of the carbon in the diffuse ISM is in the singly ionized state (Snow & McCall 2006). C IV is not typically observed in the local ISM, which is why Table 2 lists a null column density (Frisch & Slavin 2003), though a detection of C IV in the local ISM has been reported by Welsh et al. (2010). Taking into account the uncertainty on , the three different conversions to the log column density from give a value of log in the 20.0–20.8 dex range. This spread of about 0.8 dex is then also present in the column densities derived for the other ions. The use of the ISM ion abundances of Wakker & Mathis (2000) leads to column densities that are about 1 dex smaller for Mg II and Ca II and about 0.4 dex larger for Na I, compared to what was obtained assuming solar abundances in combination with the ISM ionization mix by Frisch & Slavin (2003).
Frisch & Slavin (2003) showed that the average chemical composition of the local ISM (i.e., within 200 pc) is about 60%–70% subsolar, and Savage & Sembach (1996), looking at high Galactic latitude halo stars, arrived at the same conclusion. We therefore believe that the values reported in the lower half of Table 2, obtained using the ISM ion abundances of Wakker & Mathis (2000), should be more realistic than those based on solar abundances and hence adopt those hereafter.
3.3 Intrinsic line emission
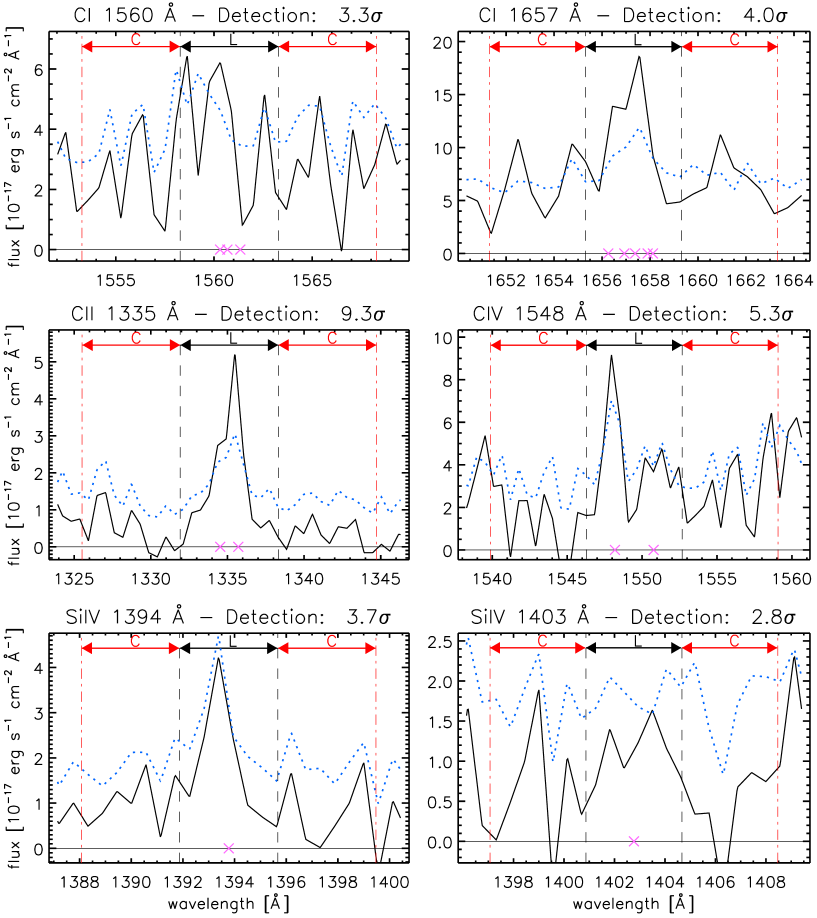
Despite the rather large distance to the star (see Section 3.2) and the expected low intrinsic stellar activity, a handful of stellar emission lines are visible in the FUV spectrum. We measured an integrated flux for the C I multiplets at 1560 and 1657 Å, the C II doublet at 1335 Å, the C IV doublet at 1548 Å, and the Si IV doublet at 1394 and 1403 Å. No further stellar lines appear to be strong enough to be visible in the spectrum.
To measure the fluxes, we integrated over a wavelength range chosen to cover all lines within each given feature (hereafter called “line” regions), taking into account the spectral resolution. We did this with the guidance of an HST/Space Telescope Imaging Spectrograph (STIS) high-resolution spectrum of Cen A, downloaded from the StarCAT666http://casa.colorado.edu/ayres/StarCAT/ catalog (Ayres 2010) and convolved to the resolution of the COS spectrum.
For each feature, we defined two “continuum” regions, one redward and one blueward of the “line” region, with the three regions having the same width. The continuum flux for each feature was then set as the average of the integrated fluxes calculated from the two “continuum” regions. The uncertainty on the continuum flux was derived by adding the uncertainties, obtained from the two continuum regions, in quadrature. We followed this procedure because the uncertainties, dominated by background subtraction, are most likely correlated; if this were not to be the case, the line detections would increase on average by about 0.5–1, depending on the considered line. We subtracted the continuum flux from the line flux to derive a continuum-subtracted line flux and its uncertainty. The wavelength regions considered for each feature are shown in Figure 4, while the resulting fluxes and line detections are listed in Table 3.
| Feature | Line wavelength | Line | Cont. | Cont. sub. | detection |
|---|---|---|---|---|---|
| range | flux | flux | line flux | ||
| [Å] | [10-17 erg s-1 cm-2] | ||||
| C I - 1560 Å | 1558.29–1563.27 | 19.411.31 | 12.331.68 | 7.082.13 | 3.3 |
| C I - 1657 Å | 1655.35–1659.29 | 41.022.34 | 26.892.63 | 14.133.52 | 4.0 |
| C II - 1335 Å | 1331.95–1338.31 | 10.610.62 | 2.510.62 | 8.100.87 | 9.3 |
| C IV - 1548 Å | 1546.31–1552.65 | 25.061.49 | 12.901.72 | 12.162.27 | 5.3 |
| Si IV - 1394 Å | 1391.88–1395.65 | 7.010.70 | 3.400.68 | 3.610.97 | 3.7 |
| Si IV - 1403 Å | 1400.88–1404.65 | 4.220.47 | 1.990.64 | 2.230.79 | 2.8 |
Table 3 shows that the C I multiplet at 1657 Å, the C II doublet at 1335 Å, the C IV doublet at 1548 Å, and the Si IV line at 1394 Å are clearly detected, while the C I multiplet at 1560 Å is marginally detected at the 3.3 level and the Si IV line at 1403 Å is not detected. Three different ionization states of carbon have been detected at 4. This result clearly indicates that despite of the measured activity index being below the minimum threshold given for main-sequence stars, WASP-13 has a hot gas atmosphere consistent with the chromosphere and transition region lines observed in other cool main-sequence stars; WASP-13 is not completely inactive. This suggests that the low index may be a bias caused by absorption along the WASP-13’s line of sight, either by the ISM or by material local to the WASP-13 system (Haswell et al. 2012; Fossati et al. 2013).
In light of the ISM column densities given in Section 3.2, the C II doublet at 1335 Å is the most affected by ISM absorption, while the other lines, particularly C IV and Si IV, can be considered to be almost free from ISM absorption. We note that the Ca II column density should be of the same order, or smaller, than that of C I. In addition, in contrast to the case of the Mg II lines of WASP-12 (Haswell et al. 2012), the C II lines of WASP-13 are not completely absorbed: for WASP-13, the presence of C II emission implies that Mg II line core emission should be present as well.
4 Discussion
We compare here the line flux ratios for the measured features with those of other nearby stars in order to estimate the “true” (i.e., free from possible biases caused by extrinsic absorptions such as ISM and/or circumstellar absorption) stellar activity level (Section 4.1), age (Section 4.1), and X-ray/EUV/FUV flux (Section 4.2).
4.1 WASP-13’s chromospheric activity and age
To estimate the chromospheric activity of WASP-13, we compared the line flux ratios derived from the COS spectrum with those of main-sequence early G-type stars (G2–G0; similar to WASP-13) of different ages and hence activity levels. The comparison stars we selected are EK Dra (G1.5V; 30 Myr), HII 314 (G1–2V; 100 Myr), HD 39587 (G0V; 278 Myr), HD 209458 (G0V; 3 Gyr), Cen A (G2V; 4.4 Gyr), the Sun (G2V; 4.57 Gyr), HD 199288 (G2V; 7.7 Gyr). These stars cover a wide range of ages; their basic parameters are listed in the first half of Table 4. The spectra of EK Dra, HII 314, HD 209458, and HD 199288, downloaded from the MAST archive, were obtained with COS using different gratings (G130M, G160M, and G140L), while the spectra of HD 39587 and Cen A, downloaded from the StarCAT catalog (Ayres 2010), were obtained with the STIS spectrograph and the E140M grating. Before measuring the line fluxes, all spectra, except for that of HD 199288, obtained with COS/G140L, have been convolved with a Gaussian to match the spectral resolution of the COS spectrum of WASP-13. For the Sun we used the solar irradiance reference spectrum (Woods et al. 2009).
| Star | Spectral | Distance | Age | |
|---|---|---|---|---|
| type | [pc] | [Myr] | ||
| EK Dra | G1.5V | 61.31.7 | 3.96i | 30a |
| HII 314 | G1–2V | 150b | 4.21c | 135b |
| HD 39587 | G0V | 8.70.1 | 4.426 | 286 |
| HD 209458 | G0V | 49.61.9 | 4.97h | 4000d |
| Cen A | G2V | 1.3250.007 | 5.00c | 4200 |
| Sun | G2V | – | 4.908 | 4570 |
| HD 199288 | G2V | 22.10.2 | 4.83e | 7700f |
| HD 59967 | G3V | 21.80.2 | 4.43e | 100g |
| HD 33262 | F9V | 11.650.03 | 4.65e | 250g |
| HD 165185 | G1V | 17.60.2 | 4.54c | 291 |
| HD 20630 | G5V | 9.140.02 | 4.420 | 522 |
| HD 97334 | G0V | 21.90.2 | 4.422 | 551 |
| HD 106516 | F9V | 22.40.4 | 4.651 | 1770 |
| HD 142373 | G0V | 15.890.05 | 5.11c | 7400g |
a – From Järvinen et al. (2007).
b – From the WEBDA database (Mermilliod & Paunzen 2003).
c – From Mamajek & Hillenbrand (2008).
d – From Melo et al. (2006).
e – From Pace (2013).
f – Average between Holmberg et al. (2009) and Casagrande et al. (2011).
g – From Casagrande et al. (2011).
h – From Figueira et al. (2014).
i – From Murgas et al. (2013).
The line flux ratios obtained for WASP-13 and the comparison stars are shown in Figure 5. For the comparison stars, we derived the line fluxes using the same wavelength regions used for WASP-13 (Table 3). For all stars, the ratio between the Si IV lines is about 0.5, in line with what is expected in the presence of an optically thin plasma (Mathioudakis et al. 1999; Bloomfield et al. 2002).
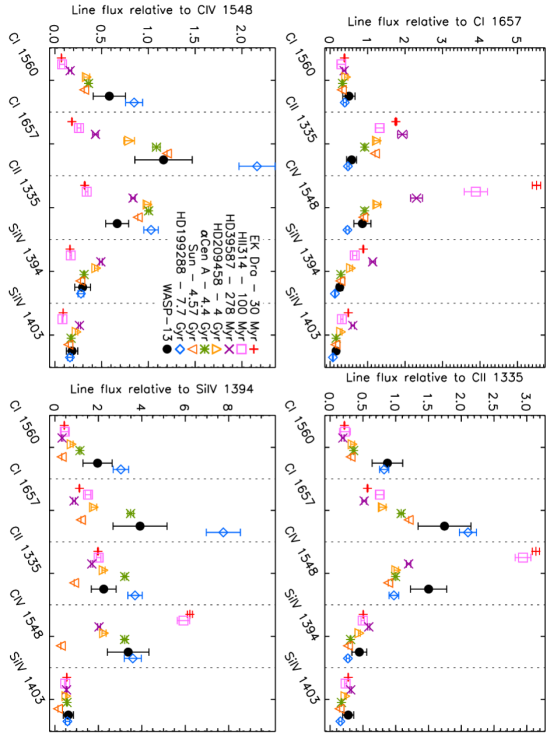
For young and active stars, the features formed in the high-temperature transition region of the chromosphere (e.g., C IV and Si IV) are stronger than the low-temperature features (e.g., C I and C II; Wood et al. 1997). The flux ratio of high- to low-temperature features decreases then with age (decreasing stellar activity). As expected, the young stars EK Dra and HII 314 have the largest flux ratios of high- to low-temperature features (e.g., C IV 1548/C I 1657 flux ratio in the top left panel of Figure 5). Therefore, the comparisons shown in Figure 5 allow one to estimate the actual stellar activity and age of WASP-13.
For the analysis of the results shown in Figure 5, one has to consider that the C II 1335 flux is strongly dependent on the amount of ISM absorption. For this reason, among the available comparisons, it is best to concentrate on those involving C I 1657, C IV 1548, and Si IV 1394. WASP-13 seems to have an FUV emission spectrum, and hence activity level, in between that of Cen A/Sun and HD 199288, the oldest and most inactive comparison stars, with a slightly closer similarity to that of Cen A/Sun (see, e.g., C I 1657–C IV 1548 flux ratio). This points toward an age of WASP-13 of about 5–6 Gyr.
To best estimate the age of WASP-13, Figure 6 shows the C IV 1548/C I 1657 flux ratio as a function of stellar age. To increase the statistics and to make the age–flux ratio relation less dependent on the uncertainties on the ages and time-variable activity of the comparison stars, we added more comparison stars to the sample (see the second half of Table 4). To increase the number of stars, we eased the condition on the spectral type by including main-sequence stars between G5 and F9. The spectra, downloaded from the StarCAT catalog (Ayres 2010), were obtained with the E140M grating of the STIS. We measured the line fluxes as for WASP-13 and the other comparison stars.
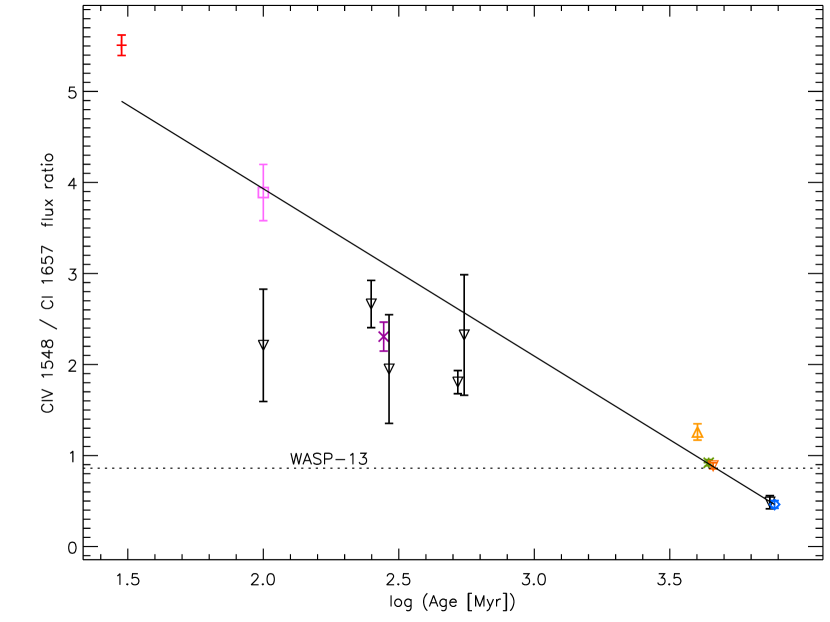
We derived a linear relation in the log(age [Myr])–flux ratio plane, obtaining
| (2) |
with a Spearman-rank correlation coefficient of 0.913. From Equation 2 and taking into account the uncertainties on the parameters of the fit and on the measured C IV 1548/C I 1657 flux ratio, we derived an age of WASP-13 of 5.12.0 Gyr, in agreement with what one can roughly estimate from Figure 5.
The literature reports a rather wide age spread for WASP-13, ranging from 4 to 12.5 Gyr (Skillen et al. 2009; Barros et al. 2012; Gómez Maqueo Chew et al. 2013; Bonfanti et al. 2015). All ages reported in the literature have been derived on the basis of different sets of stellar evolution tracks and atmospheric stellar parameters; hence, the large spread is not too surprising. The thorough spectral analysis shown by Gómez Maqueo Chew et al. (2013) led to a clear improvement of the stellar atmospheric parameters over the previous set given by Skillen et al. (2009): their slightly hotter stellar effective temperature moved the star toward younger ages compared to the other estimations, which had all been based on the stellar atmospheric parameters given by Skillen et al. (2009).
The age range derived here from the comparison of the FUV emission lines is closest to that given by Gómez Maqueo Chew et al. (2013) of 4–5.5 Gyr. This and the similarities of the FUV spectra of WASP-13 and Cen A/Sun, for which a rather precise age is available, increase our confidence in the age estimated from the chromospheric lines. By comparing the position of WASP-13 in the Hertzsprung–Russell diagram (HRD) to evolutionary tracks, Gómez Maqueo Chew et al. (2013) showed that WASP-13 is very close to the turnoff point at the end of the main sequence, where stars stop burning hydrogen in the core. As a consequence of this, Gómez Maqueo Chew et al. (2013) concluded that WASP-13 could equally be either a main-sequence star or a subgiant on its way to the Hertzsprung gap, but they did not consider the different speed of evolution in the two phases. The evolution of a star past the turnoff point, particularly in the contraction phase (small temperature increase after the turnoff point), is much quicker than any main sequence phase. This makes a main sequence evolutionary status for WASP-13 much more likely compared to a subgiant status; hence, WASP-13 is likely still burning hydrogen in the core.
4.2 WASP-13’s high energy flux
The high-energy stellar irradiation, X-ray (1–100 Å) and EUV (100–912 Å), is one of the most critical parameters for exoplanet studies (e.g., Ribas et al. 2005; Sanz-Forcada et al. 2011; Linsky et al. 2014), in particular for the analysis of the planet evaporation phenomenon and its evolutionary consequences (e.g., Davis & Wheatley 2009; Ehrenreich & Désert 2011; Mordasini et al. 2012; Lopez & Fortney 2013). For all stars beyond the solar system, directly measuring the complete XUV (X-ray EUV) flux is not possible because the ISM is completely opaque in the EUV owing to absorption by neutral hydrogen. For this reason, various indirect methods and scaling relations have been derived to estimate the XUV flux of late-type stars on the basis of observables, such as X-ray fluxes (Sanz-Forcada et al. 2011; Chadney et al. 2015), Ly fluxes (Linsky et al. 2014), and stellar rotational velocities (Wood et al. 1994; Johnstone et al. 2015; Tu et al. 2015).
Here we use a slightly different approach to derive the XUV flux of WASP-13. Given the similarity in the FUV line ratios between the Sun and WASP-13, we rescaled the solar irradiance reference spectrum (Woods et al. 2009) to match the observed WASP-13 flux of the C IV 1548 feature, accounting for WASP-13’s distance (see Section 3.2) and radius (Gómez Maqueo Chew et al. 2013). We used the C IV feature because it is expected to be unaffected by ISM absorption and hence the observed intensity can be directly compared to the Sun’s. In addition, C IV has a formation temperature peaking near 105 K, in the transition region, where much of the stellar EUV is generated (Linsky et al. 2014). For this operation, we convolved the solar spectrum to the resolution of the COS spectrum and used the same integration limits (for both line and continuum) as those adopted for WASP-13. We then integrated the rescaled solar flux within the X-ray, EUV, and FUV wavelength ranges adopted by Ribas et al. (2005, their Table 4) and Linsky et al. (2014, their Table 5), plus the Ly flux (1212–1220 Å). The results are shown in Table 5. The method applied here should provide reliable results because WASP-13’s photospheric temperature, metallicity, and FUV spectral characteristics are very similar to the Sun’s, while the slightly larger mass should have a negligible effect compared to the uncertainties.
| Wavelength | Flux at 1 AU | ||
|---|---|---|---|
| Range (Å) | (erg s-1 cm-2) | ||
| WASP-13 | Sun | ||
| 1–20 | 0.031 | 0.013 | |
| 20–100 | 0.374 | 0.150 | |
| 100–360 | 3.062 | 1.228 | |
| 360–920 | 1.978 | 0.794 | |
| 920–1180 | 1.379 | 0.553 | |
| 1–360920–1180 | 6.622 | 2.657 | |
| 1–1180 | 6.824 | 2.738 | |
| 100–200 | 1.124 | 1.599a | 0.451 |
| 200–300 | 0.688 | 1.660a | 0.276 |
| 300–400 | 1.365 | 1.902a | 0.548 |
| 400–500 | 0.196 | 0.147a | 0.079 |
| 500–600 | 0.332 | 0.534a | 0.133 |
| 600–700 | 0.280 | 0.331a | 0.112 |
| 700–800 | 0.286 | 0.739a | 0.115 |
| 800–912 | 0.704 | 1.728a | 0.283 |
| 912–1170 | 1.254 | 1.709a | 0.503 |
| 1170–1300 | 15.893 | 6.377 | |
| 1300–1400 | 1.384 | 0.555 | |
| 1400–1500 | 1.391 | 0.558 | |
| 1500–1600 | 3.434 | 1.378 | |
| 1600–1700 | 8.066 | 3.236 | |
| Ly (1212–1220) | 14.497 | 15.860b | 5.817 |
Table 5 lists the integrated fluxes for WASP-13 and the Sun777Note that the solar fluxes are systematically slightly lower compared to those of Ribas et al. (2005), because the solar spectrum adopted here corresponds to that at minimum solar activity, while Ribas et al. (2005) used a spectrum obtained at average solar activity. at 1 AU in various X-ray, EUV, and FUV wavelength regions. Despite the slightly lower activity of WASP-13 compared to that of the Sun, the solar fluxes at 1 AU are smaller than those of WASP-13. This is due to the rather large difference in stellar radius between the two stars (Gómez Maqueo Chew et al. 2013). As expected, a hypothetical WASP-13 with a radius of = 1 would have XUV fluxes slightly smaller than the solar ones.
Table 5 also lists the Ly flux obtained using the relation given by Linsky et al. (2013) and the EUV fluxes obtained using the relations given by Linsky et al. (2014). For almost all fluxes, the use of these relations leads to fluxes larger than those obtained from the scaling of the solar spectrum. The average difference is about 40%, well within the expected uncertainties (i.e., the EUV fluxes are based on a scaling relation of a scaling relation; Linsky et al. 2014). This shows that, when possible, the use of a rescaled solar spectrum is to be preferred.
The Ly line is clearly the most intense feature in the stellar high-energy spectrum with a total integrated flux of about 14 erg s-1 cm-2. The total XUV flux at 1 AU, integrated within the 1–912 Å wavelength range, is about 5.3 erg s-1 cm-2, which at the orbital distance of WASP-13 b is about 1850 erg s-1 cm-2. We used the scaled solar spectrum (see above) in the escape model of Koskinen et al. (2013a, b) to estimate the mass-loss rate from WASP-13 b. We placed the lower boundary of the model at a pressure = 10-6 bar, where the radius is = 1.15 , based on the temperature of 1500 K (Barros et al. 2012) in the lower atmosphere. In the absence of any information on the presence of heavier species in the escaping atmosphere, the model includes only H2, H, and He with their associated ions H+, H, H, He+, and HeH+. Because H2 dissociates just above the lower boundary, the model is practically composed of H, H+, and electrons above 1.2 .
The model predicts a mass-loss rate of 1.5 1011 g s-1 (2.5 10-12 yr-1). We compared this with the energy-limited mass-loss rate, written as (e.g., Erkaev et al. 2007)
| (3) |
where is the mass loss efficiency, is the effective radius where stellar energy is absorbed, is the enhancement factor due to Roche lobe effects, is the wavelength-integrated stellar flux, and is the surface gravitational potential. The mass-loss rate predicted by the energy-limited formula (we adopted = 0.46, = 1.75 , and = 1.15) is within 1% of that given by the hydrodynamic model. We note that the mass loss rate we obtained from the hydrodynamic model is about a factor of 10 higher than the mass-loss rate of 2.5 1010 g s-1 predicted by Ehrenreich & Désert (2011) on the basis of the energy-limited formulation. This is because the surface gravity of WASP-13 b is relatively low, leading to a rather high altitude for the XUV heating peak, and because Ehrenreich & Désert (2011) assumed a lower mass-loss efficiency of = 0.15. Our value of = 0.46 is based on a photoelectron heating efficiency of 0.93 that should be suitable for EUV photons under strong ionization (Cecchi-Pestellini et al. 2009; Koskinen et al. 2013a, b) and cooling by recombination. It is also reasonably close to the thermospheric heating efficiency on many solar system atmospheres.
The mass-loss rate is not large enough to substantially decrease the planet’s mass within the main-sequence lifetime of the star. Nevertheless, the mass-loss rate is as high as that derived by Ehrenreich & Désert (2011) for WASP-12 b, which is about 1000 K hotter than WASP-13 b and for which translucent circumstellar material appears to be present888The previous mass-loss rate derived for WASP-12 on the basis of the energy-limited formula may be underestimated (Koskinen et al. 2016, in preparation).. One may therefore expect the same for the WASP-13 system, although additional factors, such as the stellar magnetic field configuration (Lanza 2014) and stellar wind/radiation, may also play a role.
4.3 Circumstellar material
The analysis of the COS spectrum has shown that WASP-13 has a chromosphere typical of Sun-like stars, in contrast to what was indicated by the very low value, if taken as reflecting the intrinsic stellar properties. For WASP-13 we can therefore definitely exclude the possibility that the planet has significantly affected stellar activity, as Pillitteri et al. (2014) suggested for WASP-18. The hot Jupiter WASP-18 b is 20 times more massive and has a semi-major axis 2.5 times smaller than WASP-13 b, so this plausibly explains different situations in the two systems. If WASP-13 b was capable of reducing the activity of the host star, many more systems would be expected to present a very low value. This in turn implies that extrinsic absorption, either from the ISM and/or from material local to the system, is likely to be the cause of the –FUV flux discrepancy for the majority of planet hosts sharing it.
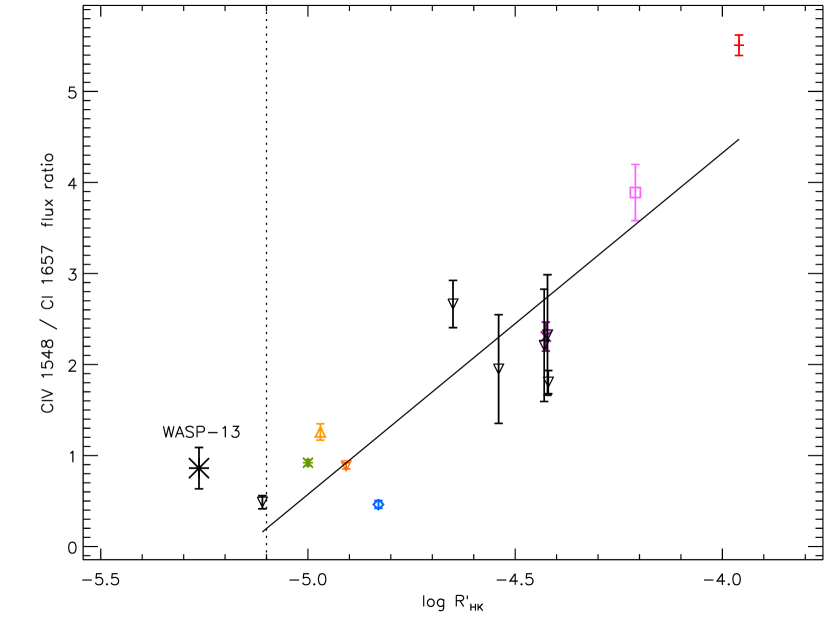
The presence of absorption biasing the measurement of the value appears clear when relating the C IV 1548/C I 1657 flux ratio and the value for WASP-13 and the comparison stars (Figure 7). From a linear fit performed without considering WASP-13, we obtained the following correlation:
| (4) |
Figure 7 and Equation 4 indicate that the true value of WASP-13 should be about 4.95, similar to the solar value and well above the measured one of 5.263. This highlights even further the presence of a bias in the measured value, which is probably caused by extrinsic absorption by the ISM and possibly by circumstellar material.
To look for the possible presence of a spectral signature of absorption local to the system, hence additional to that of the ISM, we compared the observed HIRES spectrum999The reduced HIRES spectrum of WASP-13, having a resolving power of R 48,000, was downloaded from the Keck archive https://koa.ipac.caltech.edu/cgi-bin/KOA/nph-KOAlogin. of WASP-13 with a synthetic spectrum of the star, which includes the chromospheric emission and ISM absorption components, in the region of the Ca II H&K lines. We estimated the total Ca II line core emission using the Ly–Ca II H&K relations given by Linsky et al. (2013) and distributed the total emission flux between the two lines according to their oscillator strengths (i.e., log values). For this operation we considered the Ly flux we obtained from the rescaling of the solar spectrum namely, 14 erg s-1 cm-2 at 1 AU, obtaining a total Ca II emission flux of 19 erg s-1 cm-2 at 1 AU. We simulated the chromospheric line emission using Gaussian profiles broadened in order to match the line width of the solar emission line profiles. The ISM absorption was modeled using Voigt profiles with a Ca II column density derived using the ionization mix by Frisch & Slavin (2003) and assuming a broadening -parameter of 2.0 (Redfield & Linsky 2002). Although an NUV spectrum of WASP-13 is not available, following the same procedure, we also calculated synthetic spectra in the region of the Mg II h&k lines (following Linsky et al. 2013, we obtained a total Mg II emission flux of 30 erg s-1 cm-2 at 1 AU). The photospheric synthetic spectrum of WASP-13 was calculated with LLmodels (Shulyak et al. 2004). Figure 8 shows the synthetic profiles derived assuming a logarithmic Mg II column density of 15.00 and a logarithmic Ca II column density of 12.00; see Table 2.
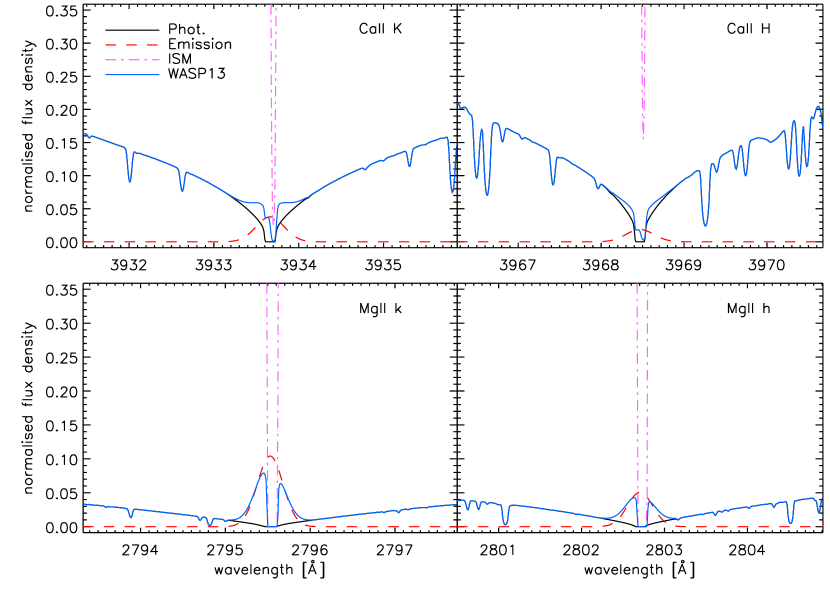
Figure 9 shows the comparison of the synthetic spectrum, obtained including chromospheric emission and ISM absorption with the observed HIRES spectrum, and the expected Mg II h&k line core profiles of WASP-13 convolved with the resolution and sampling of the STIS E230M grating. As expected, the lower ISM column density, derived using the ionization mix by Frisch & Slavin (2003), provides a better fit to the observed spectrum, compared to that obtained using solar abundances. The synthesized emission is slightly lower than the observed emission, but a simple increase of the emitted Ca II flux would not lead to a significantly better fit because it would exacerbate the mismatch on the blue side of the ISM absorption (see Ca II K line).
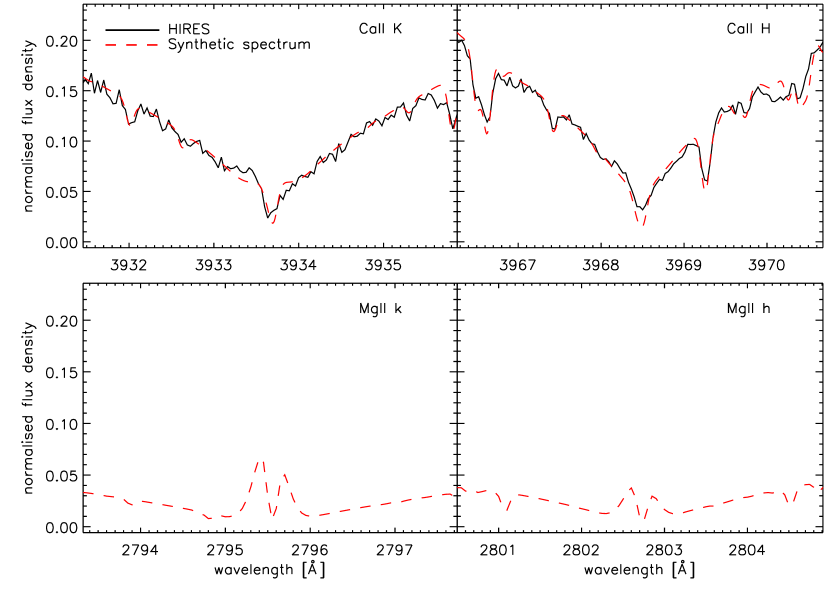
On the basis of the assumed characteristics of the ISM along the WASP-13 line of sight, Figure 9 would indicate that absorption from material local to the system is not present. Nevertheless, the ISM Ca II column density is too poorly constrained to firmly exclude the presence of extra absorption (i.e., additional to the ISM absorption) in the line core. Note also that we assume the presence of a single ISM absorption component; this may not be the case. The bottom panel of Figure 9 shows that assuming that the only nonphotospheric absorption present in the spectrum is due to the ISM, WASP-13 would indeed present Mg II line core emission that would be detectable with STIS, contrary to the case of WASP-12 where no emission was detected (Haswell et al. 2012). An NUV spectrum of WASP-13 is needed to look for the presence of Mg II line core emission and compare it with our prediction.
Much better knowledge of the ISM absorption component(s) is needed to disentangle the ISM absorption from the circumstellar absorption, if present. This may be obtained from the measurement of the ISM absorption from early-type stars lying close to the WASP-13 line of sight, following the work of Fossati et al. (2013) for the WASP-12 system. This would allow us to accurately measure ISM absorption parameters and directly derive an unbiased value of . Thus, the idea that the ISM alone could cause the low can be tested. The major problem in this procedure would be that the distance to the early-type stars would not be known and would almost certainly not match that of WASP-13. WASP-13 lies far from the Galactic plane, in a sparsely populated region of the sky with no nearby early-type stars. To offset this disadvantage, the ISM absorption is mostly confined to the Galactic plane, so closely matched distances are less critical for high Galactic latitude lines of sight. Further attempts to identify the spectroscopic signature of the extra absorption could be made on the basis of solid theoretical estimates of the temperature of the absorbing material, though the few values currently available (103–105 K; Li et al. 2010; Lanza 2014) are too poorly constrained to serve this purpose.
5 Conclusions
Like other stars hosting hot Jupiters, exemplified by WASP-12, the G1V planet-hosting star WASP-13 presents a value well below the basal level of solar-like main-sequence stars. The presence of absorption in the core of the resonance lines often used to measure stellar activity has been attributed to (i) the ISM, (ii) material local to the system, or (iii) a combination of local and ISM absorption. A direct influence of the planet on the stellar dynamo mechanism has also been suggested.
In 2015 April, we obtained HST/COS FUV spectra of WASP-13, timed with the planet’s primary transit. We have measured the actual stellar activity from the high-ionization lines free from extrinsic absorption, estimated the high-energy flux, and assessed the absorption from material local to the system. Measurements of the high-energy flux for these very inactive stars are particularly important: on the basis of the activity parameter alone, it may not be possible to reliably infer the XUV stellar flux. This XUV flux irradiates the planet and is needed as input by models of the planetary atmospheres’ response to the intense irradiation from the host star. We have demonstrated that a modest investment of HST time allows us to retrieve the stellar XUV flux and derive, e.g., the planetary mass-loss rate. Without this, evolution calculations for these hot Jupiters are speculative and subject to large uncertainties.
We integrated the stellar flux in the FUV wavelength band dominated by the stellar continuum, but the uncertainties were too large to detect the planet transit. We calculated the expected transit depth in the considered wavelength region assuming Rayleigh scattering, concluding that it should be 9% deeper than the optical transit. On the basis of the COS observations, we did not detect at 2 Rayleigh scattering in the planet atmosphere.
We analyzed the star’s SED spanning from the UV to the IR. On the basis of the stellar effective temperature and radius, we estimated a distance to the star of = 2328 pc and a reddening of = 0.0450.25 mag. Using various relations of the H I column density with , we estimated the ISM logarithmic column density of H I, Mg II, Ca II, and Na I obtaining on average 20.50, 15.00, 12.00, and 12.20, respectively.
From the co-added COS spectrum we measured the integrated flux for the C I multiplets at 1560 Å and 1657 Å, the C II doublet at 1335 Å, the C IV doublet at 1548 Å, and the Si IV doublet at 1394 Å and 1403 Å. No further stellar lines appeared to be strong enough to be visible in the spectrum. We detected at 4 lines belonging to three different ionization states of carbon (the C I multiplet at 1657 Å, the C II doublet at 1335 Å, and the C IV doublet at 1548 Å) and the Si IV line at 1560 Å at 3. These detections clearly indicate that, despite the low stellar activity index, WASP-13 hosts a chromosphere consistent with that of other cool stars (e.g., the Sun) and that the star is not completely inactive. The stellar dynamo mechanism is therefore not significantly affected by the planet.
We compared the line flux ratios derived for WASP-13 with those of main-sequence early G-type stars of different ages and activity levels. We see a clear decrease of the flux ratios of high- to low-temperature features (e.g., C IV 1548/C I 1657 flux ratio) with age. By considering the flux ratios calculated from the lines less affected by ISM absorption (C I 1657, C IV 1548, and Si IV 1394), WASP-13 appears to be only slightly older and more inactive than the Sun and Cen A. We concentrate on the C IV 1548/C I 1657 flux ratio and derive a linear log(age [Myr])–flux ratio relation, from which we estimate an age of WASP-13 of 5.12.0 Gyr.
Given the similarities between the FUV spectra of WASP-13 and the Sun, we rescaled the solar irradiance reference spectrum to match the flux of the C IV 1548 doublet, thus estimating the stellar high-energy flux, taking into account the distance and radius of WASP-13. By integrating the rescaled solar spectrum in the 1–912 Å wavelength range, we obtained a flux of 5.4 erg s-1 cm-2 at a distance of 1 AU and 1859 erg s-1 cm-2 at the distance of WASP-13 b. We used the rescaled solar spectrum as input for a detailed hydrodynamic modeling of the planet’s upper atmosphere, deriving a mass-loss rate of 1.51011 g s-1 (2.5 10-12 yr-1). This value is about 10 times higher than previous estimates based on the energy-limited formula.
For WASP-13, the value of 5.263 is clearly not a good measure of the stellar activity, which we find to be only slightly lower than that of the Sun, which has an average value of 4.908. This strongly suggests the presence of absorption in the core of the Ca II H&K resonance lines used to measure the value.
We looked for the absorption signature of veiling gas in a high-resolution Keck/HIRES spectrum of WASP-13 covering the Ca II H&K line cores. We derived the expected Ca II H&K line core emission and modeled it together with the photospheric spectrum and the ISM absorption. The composite spectrum was then compared to the observation. The large uncertainty in the Ca II ISM abundance did not allow us to arrive at any firm conclusion on the presence of absorption additional to that of the ISM. In the case of WASP-13, the ISM may provide the only cause of the biased value. A high-resolution spectrum covering the core of the Mg II h&k resonance lines is needed to establish a firm solution for the origin of the low value of WASP-13.
Acknowledgments
This work is based on observations made with the NASA/ESA Hubble Space Telescope, obtained from MAST at the Space Telescope Science Institute, which is operated by the Association of Universities for Research in Astronomy, Inc., under NASA contract NAS 5-26555. These observations are associated with program no. 13859, to which support was provided by NASA through a grant from the Space Telescope Science Institute. This publication makes use of data products from the Two Micron All Sky Survey, which is a joint project of the University of Massachusetts and the Infrared Processing and Analysis Center/California Institute of Technology, funded by the National Aeronautics and Space Administration and the National Science Foundation. Support for StarCAT was provided by grant HST-AR-10638.01-A from STScI and grant NAG5-13058 from NASA. This work has made use of public databases hosted by SIMBAD and VizieR, both maintained by CDS, Strasbourg, France. L.F. acknowledges financial support from the Alexander von Humboldt foundation. C.H. is supported by STFC under grant ST/L000776/1. We thank the anonymous referee for the useful comments. Facilities: HST (COS), HST (STIS), Keck (HIRES).
References
- Amôres & Lépine (2005) Amôres, E. B., & Lépine, J. R. D. 2005, AJ, 130, 679
- Asplund et al. (2009) Asplund, M., Grevesse, N., Sauval, A. J. & Scott, P. 2009, ARA&A, 47, 481
- Ayres (2010) Ayres, T. R. 2010, ApJS, 187, 149
- Baliunas & Jastrow (1990) Baliunas, S. & Jastrow, R. 1990, Nature, 348, 520
- Barnes (2007) Barnes, S. A. 2007, ApJ, 669, 1167
- Barros et al. (2012) Barros, S. C. C., Pollacco, D. L., Gibson, N. P., et al. 2012, MNRAS, 419, 1248
- Beaugé & Nesvorný (2013) Beaugé, C. & Nesvorný, D. 2013, ApJ, 763, 12
- Bessell et al. (1998) Bessell, M. S., Castelli, F. & Plez, B. 1998, A&A, 333, 231
- Bloomfield et al. (2002) Bloomfield, D. S., Mathioudakis, M., Christian, D. J., Keenan, F. P., & Linsky, J. L. 2002, A&A, 390, 219
- Bonfanti et al. (2015) Bonfanti, A., Ortolani, S., Piotto, G. & Nascimbeni, V. 2015, A&A, 575, A18
- Bourrier et al. (2013) Bourrier, V., Lecavelier des Etangs, A., Dupuy, H., et al. 2013, A&A, 551, A63
- Casagrande et al. (2011) Casagrande, L., Schönrich, R., Asplund, M., et al. 2011, A&A, 530, A138
- Cecchi-Pestellini et al. (2009) Cecchi-Pestellini, C., Ciaravella, A., Micela, G. & Penz, T. 2009, A&A, 496, 863
- Chadney et al. (2015) Chadney, J. M., Galand, M., Unruh, Y. C., Koskinen, T. T. & Sanz-Forcada, J. 2015, Icarus, 250, 357
- Cohen et al. (2011) Cohen, O., Kashyap, V. L., Drake, J. J., et al. 2011, ApJ, 733, 67
- Cutri et al. (2013) Cutri, R. M., et al. 2013, VizieR Online Data Catalog, 2328, 0
- Dalgarno & Williams (1965) Dalgarno, A. & Williams, D. A. 1965, Proceedings of the Physical Society, 85, 685
- Danforth et al. (2010) Danforth, C. W., Keeney, B. A., Stocke, J. T., Shull, J. M., & Yao, Y. 2010, ApJ, 720, 976
- Davis & Wheatley (2009) Davis, T. A. & Wheatley, P. J. 2009, MNRAS, 396, 1012
- Diplas & Savage (1994) Diplas, A. & Savage, B. D. 1994, ApJ, 427, 274
- Donahue (1998) Donahue, R. A. 1998, Cool Stars, Stellar Systems, and the Sun, 154, 1235
- Droege et al. (2006) Droege, T. F., Richmond, M. W., Sallman, M. P. & Creager, R. P. 2006, PASP, 118, 1666
- Duncan et al. (1991) Duncan, D. K., Vaughan, A. H., Wilson, O. C., et al. 1991, ApJS, 76, 383
- Ehrenreich & Désert (2011) Ehrenreich, D. & Désert, J.-M. 2011, A&A, 529, A136
- Erkaev et al. (2007) Erkaev, N. V., Kulikov, Y. N., Lammer, H., et al. 2007, A&A, 472, 329
- Figueira et al. (2014) Figueira, P., Oshagh, M., Adibekyan, V. Z. & Santos, N. C. 2014, A&A, 572, A51
- Fitzpatrick (1999) Fitzpatrick, E. L. 1999, PASP, 111, 63
- Fortney et al. (2008) Fortney, J. J., Lodders, K., Marley, M. S. & Freedman, R. S. 2008, ApJ, 678, 1419
- Fossati et al. (2010a) Fossati, L., Haswell, C. A., Froning, C. S., et al. 2010a, ApJ, 714, L222
- Fossati et al. (2010b) Fossati, L., Bagnulo, S., Elmasli, A., et al. 2010b, ApJ, 720, 872
- Fossati et al. (2013) Fossati, L., Ayres, T. R., Haswell, C. A., et al. 2013, ApJ, 766, L20
- Fossati et al. (2015a) Fossati, L., Haswell, C. A., Linsky, J. L. & Kislyakova, K. G. 2015a, Astrophysics and Space Science Library, Vol. 411, 59
- Fossati et al. (2015b) Fossati, L., Ingrassia, S. & Lanza, A. F. 2015b, ApJ, 812, L35
- France et al. (2013) France, K., Froning, C. S., Linsky, J. L., et al. 2013, ApJ, 763, 149
- Frisch & Slavin (2003) Frisch, P. C. & Slavin, J. D. 2003, ApJ, 594, 844
- García Muñoz (2007) García Muñoz, A. 2007, Planet. Space Sci., 55, 1426
- Gómez Maqueo Chew et al. (2013) Gómez Maqueo Chew, Y., Faedi, F., Cargile, P., et al. 2013, ApJ, 768, 79
- Green et al. (2012) Green, J. C., Froning, C. S., Osterman, S., et al. 2012, ApJ, 744, 60
- Gudennavar et al. (2012) Gudennavar, S. B., Bubbly, S. G., Preethi, K. & Murthy, J. 2012, ApJS, 199, 8
- Gustafsson et al. (2008) Gustafsson, B., Edvardsson, B., Eriksson, K., et al. 2008, A&A, 486, 951
- Güver & Özel (2009) Güver, T. & Özel, F. 2009, MNRAS, 400, 2050
- Haswell et al. (2012) Haswell, C. A., Fossati, L., Ayres, T., et al. 2012, ApJ, 760, 79
- Hebb et al. (2009) Hebb, L., Collier-Cameron, A., Loeillet, B., et al. 2009, ApJ, 693, 1920
- Høg et al. (2000) Høg, E., Fabricius, C., Makarov, V. V., et al. 2000, A&A, 355, L27
- Holmberg et al. (2009) Holmberg, J., Nordström, B. & Andersen, J. 2009, A&A, 501, 941
- Howard et al. (2012) Howard, A. W., Marcy, G. W., Bryson, S. T., et al. 2012, ApJS, 201, 15
- Hu et al. (2012) Hu, R., Seager, S. & Bains, W. 2012, ApJ, 761, 166
- Hubbard et al. (2001) Hubbard, W. B., Fortney, J. J., Lunine, J. I., et al. 2001, ApJ, 560, 413
- Hubeny et al. (2003) Hubeny, I., Burrows, A. & Sudarsky, D. 2003, ApJ, 594, 1011
- Järvinen et al. (2007) Järvinen, S. P., Berdyugina, S. V., Korhonen, H., Ilyin, I. & Tuominen, I. 2007, A&A, 472, 887
- Johnstone et al. (2015) Johnstone, C. P., Güdel, M., Brott, I. & Lüftinger, T. 2015, A&A, 577, A28
- Keil et al. (1998) Keil, S. L., Henry, T. W. & Fleck, B. 1998, Synoptic Solar Physics, Vol. 140, 301
- Kharchenko (2001) Kharchenko, N. V. 2001, Kinematika i Fizika Nebesnykh Tel, 17, 409
- Knutson et al. (2010) Knutson, H. A., Howard, A. W. & Isaacson, H. 2010, ApJ, 720, 1569
- Koskinen et al. (2013a) Koskinen, T. T., Harris, M. J., Yelle, R. V. & Lavvas, P. 2013a, Icarus, 226, 1678
- Koskinen et al. (2013b) Koskinen, T. T., Yelle, R. V., Harris, M. J. & Lavvas, P. 2013b, Icarus, 226, 1695
- Lanza (2014) Lanza, A. F. 2014, A&A, 572, L6
- Lecavelier Des Etangs (2007) Lecavelier Des Etangs, A. 2007, A&A, 461, 1185
- Lee & Kim (2004) Lee, H-W. & Kim, H. I. 2004, MNRAS, 347, 802
- Li et al. (2010) Li, S.-L., Miller, N., Lin, D. N. C. & Fortney, J. J. 2010, Nature, 463, 1054
- Linsky et al. (2010) Linsky, J. L., Yang, H., France, K., et al. 2010, ApJ, 717, 1291
- Linsky et al. (2013) Linsky, J. L., France, K. & Ayres, T. 2013, ApJ, 766, 69
- Linsky et al. (2014) Linsky, J. L., Fontenla, J. & France, K. 2014, ApJ, 780, 61
- Livingston et al. (2007) Livingston, W., Wallace, L., White, O. R., & Giampapa, M. S. 2007, ApJ, 657, 1137
- Lopez & Fortney (2013) Lopez, E. D. & Fortney, J. J. 2013, ApJ, 776, 2
- Mamajek & Hillenbrand (2008) Mamajek, E. E. & Hillenbrand, L. A. 2008, ApJ, 687, 1264
- Mann & von Braun (2015) Mann, A. W. & von Braun, K. 2015, PASP, 127, 102
- Matsakos et al. (2015) Matsakos, T., Uribe, A., Königl, A. 2015, A&A, 578, A6
- Melo et al. (2006) Melo, C., Santos, N. C., Pont, F., et al. 2006, A&A, 460, 251
- Mathioudakis et al. (1999) Mathioudakis, M., McKenny, J., Keenan, F. P., Williams, D. R., & Phillips, K. J. H. 1999, A&A, 351, L23
- Mermilliod & Paunzen (2003) Mermilliod, J.-C. & Paunzen, E. 2003, A&A, 410, 511
- Mordasini et al. (2012) Mordasini, C., Alibert, Y., Georgy, C., et al. 2012, A&A, 547, A112
- Murgas et al. (2013) Murgas, F., Jenkins, J. S., Rojo, P., Jones, H. R. A., & Pinfield, D. J. 2013, A&A, 552, A27
- Pace (2013) Pace, G. 2013, A&A, 551, L8
- Pillitteri et al. (2014) Pillitteri, I., Wolk, S. J., Sciortino, S. & Antoci, V. 2014, A&A, 567, A128
- Piters et al. (1997) Piters, A. J. M., Schrijver, C. J., Schmitt, J. H. M. M., et al. 1997, A&A, 325, 1115
- Rachford et al. (2002) Rachford, B. L., Snow, T. P., Tumlinson, J., et al. 2002, ApJ, 577, 221
- Redfield & Linsky (2002) Redfield, S. & Linsky, J. L. 2002, ApJS, 139, 439
- Radick et al. (1998) Radick, R. R., Lockwood, G. W., Skiff, B. A. & Baliunas, S. L. 1998, ApJS, 118, 239
- Ribas et al. (2005) Ribas, I., Guinan, E. F., Güdel, M. & Audard, M. 2005, ApJ, 622, 680
- Sanz-Forcada et al. (2011) Sanz-Forcada, J., Micela, G., Ribas, I., et al. 2011, A&A, 532, A6
- Savage & Mathis (1979) Savage, B. D. & Mathis, J. S. 1979, ARA&A, 17, 73
- Savage & Sembach (1996) Savage, B. D. & Sembach, K. R. 1996, ApJ, 470, 893
- Shkolnik (2013) Shkolnik, E. L. 2013, ApJ, 766, 9
- Shulyak et al. (2004) Shulyak, D., Tsymbal, V., Ryabchikova, T., Stütz, C., & Weiss, W. W. 2004, A&A, 428, 993
- Skillen et al. (2009) Skillen, I., Pollacco, D., Collier Cameron, A., et al. 2009, A&A, 502, 391
- Snow & McCall (2006) Snow, T. P. & McCall, B. J. 2006, ARA&A, 44, 367
- Stelzer et al. (2013) Stelzer, B., Marino, A., Micela, G., López-Santiago, J. & Liefke, C. 2013, MNRAS, 431, 2063
- Tu et al. (2015) Tu, L., Johnstone, C. P., Güdel, M. & Lammer, H. 2015, A&A, 577, L3
- van der Bliek et al. (1996) van der Bliek, N. S., Manfroid, J. & Bouchet, P. 1996, A&AS, 119, 547
- van Leeuwen (2007) van Leeuwen, F. 2007, A&A, 474, 653
- Vidal-Madjar et al. (2003) Vidal-Madjar, A., Lecavelier des Etangs, A., Désert, J.-M., et al. 2003, Nature, 422, 143
- Wakker & Mathis (2000) Wakker, B. P. & Mathis, J. S. 2000, ApJ, 544, L107
- Welsh et al. (2010) Welsh, B. Y., Wheatley, J., Siegmund, O. H. W. & Lallement, R. 2010, ApJ, 712, L199
- Wood et al. (1994) Wood, B. E., Brown, A., Linsky, J. L., et al. 1994, ApJS, 93, 287
- Wood et al. (1997) Wood, B. E., Linsky, J. L. & Ayres, T. R. 1997, ApJ, 478, 745
- Woods et al. (2009) Woods, T. N., Chamberlin, P. C., Harder, J. W., et al. 2009, Geophys. Res. Lett., 36, L01101
- Wright et al. (2004) Wright, J. T., Marcy, G. W., Butler, R. P. & Vogt, S. S. 2004, ApJS, 152, 261
- Wright et al. (2010) Wright, E. L., Eisenhardt, P. R. M., Mainzer, A. K., et al. 2010, AJ, 140, 1868
- Yelle (2004) Yelle, R. V. 2004, Icarus, 170, 167
- Zahnle et al. (2009) Zahnle, K., Marley, M. S., Freedman, R. S., Lodders, K. & Fortney, J. J. 2009, ApJ, 701, L20