What does Big Data tell? Sampling the social network by communication channels
Abstract
Big Data has become the primary source of understanding the structure and dynamics of the society at large scale. The network of social interactions can be considered as a multiplex, where each layer corresponds to one communication channel and the aggregate of all of them constitutes the entire social network. However, usually one has information only about one of the channels or even a part of it, which should be considered as a subset or sample of the whole. Here we introduce a model based on a natural bilateral communication channel selection mechanism, which for one channel leads to consistent changes in the network properties. For example, while it is expected that the degree distribution of the whole social network has a maximum at a value larger than one, we get a monotonously decreasing distribution as observed in empirical studies of single channel data. We also find that assortativity may occur or get strengthened due to the sampling method. We analyze the far-reaching consequences of our findings.
I Introduction
Over the past decades the information-communication technology (ICT) has changed in various ways how we communicate and interact with each other. Yet at the same time it has revolutionized social sciences Lazer et al. (2009) by making available an unprecedented amount of high-quality data of social interactions of huge number of people. Through the computational analysis and subsequent modeling one could get insight into earlier inaccessible properties like the structure of the interaction network at the societal level Onnela et al. (2007a), the inhomogeneous dynamics of communication Karsai et al. (2011); Iribarren and Moro (2009); Jo et al. (2012a), and the laws of collective attention Wu and Huberman (2007) to name a few examples. In these cases the data is usually in the form of communication records, e.g., mobile phone calls, text messages, and emails Onnela et al. (2007b); Wu et al. (2010); Eckmann et al. (2004), as well as social networking services (SNS), e.g., Facebook and Twitter Ugander et al. (2011); Kwak et al. (2010). While in each case one has information about a particular kind of interaction, the general interest stems also from the assumption that this type of research can provide insight into the structure and function of the society as a whole.
It is now understood that a network of human social interactions should be considered as a multiplex network where the each edge is categorized by its type Boccaletti et al. (2014); Kivelä et al. (2014); Lee et al. (2015) at least from two different points of view. Usually one assumes that the links can be classified according to the nature of relationships like kinship, friendship, workmate links, etc. Each of these defines a network, which then serves as a layer of the whole multiplex network. On the other hand the interaction can also be assorted according to the channels used for communication like face-to-face, mobile phone, social network services, etc. Then the layers of the multiplex correspond to different communication channels. Data is usually available only for one channel, meaning that from the whole multiplex there is only one layer we can investigate at a time. Linking data from diverse channels is in most cases impossible due to their different origins and for privacy reasons 111Exceptions are the Reality Mining type data Eagle et al. (2009); Jo et al. (2012b); Stopczynski et al. (2014), where multichannel information is collected from a relatively small group of volunteers. This is clearly a very interesting line of research but is not directly suitable for large scale conclusions..
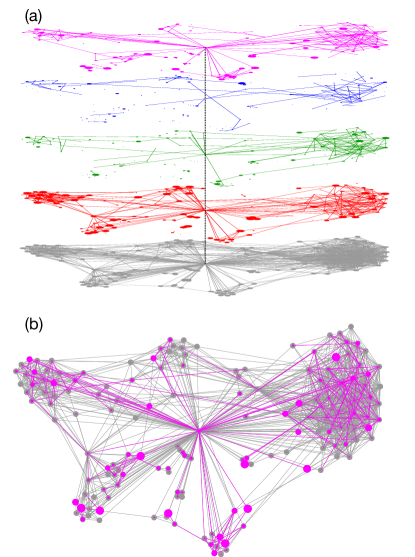
Having information only about one layer of the multiplex raises the following questions. To what extent can we from the analysis of one particular layer draw conclusions of the properties of the whole network? How much the properties of the whole network are reflected by the partial datasets? The answer to these questions is of fundamental importance, if we want to apply the results from the available data to the whole society. A schematic view of this picture is shown in Fig. 1. The most apparent problem here is the general observation that in ICT provided data about large populations, wherever they come from, the degree distribution shows a monotonously decreasing behavior Onnela et al. (2007a); Ugander et al. (2011); Newman (2004). This has the consequence that the most probable degree is one. Then a simple-minded generalization of this observation would imply that this statement is true for a number of social contacts of an individual, which is clearly nonsense.
Dealing with data from only one communication channel can be interpreted as sampling such that each layer constitutes a sample of the whole multiplex network, comprised of the people using a particular channel of communication. The sampling method changes the properties of the network and it is an inverse problem Aster et al. (2012) to draw conclusions about the whole system from the partial observations.
We would like to stress the difference from previous studies on sampling networks Stumpf et al. (2005); Stumpf and Wiuf (2005); Lee et al. (2006). These studies focused on the bias caused by selecting a fraction of the data (or network) for analysis such that its statistical properties remain unaltered. While this sampling is a statistical issue and has previously been studied well, the selection of social links by a single communication channel is inherently social activity and has so far not attracted much research attention.
Generally speaking, available datasets usually undergo two-step sampling Gjoka et al. (2010). The first sampling takes place when the calling person chooses a communication channel from various options depending on context or a person with whom the contact is made. The other sampling occurs when an observer or a researcher analyzes the dataset. Since it is often hard to analyze all the logs in an ICT service mainly due to technical reasons, a fraction of data are randomly sampled for the analysis and the properties are statistically inferred. In this paper, we will focus on the former sampling, which is of fundamental importance since a bias originating from social activity is not reduced by the amount of data.
In this paper we analyze the relationship between the whole network and the sampled network using different techniques. We will show how the sampling may substantially change the properties of the network, e.g., it can make a monotonic degree distribution from one with a peak at degree larger than one. We will demonstrate under which condition the sampled network reflects the properties of the surrogate network.
II Empirical observations
We first summarize some general empirical findings or stylized facts in social networks from different ICT datasets Onnela et al. (2007b); Kwak et al. (2010); Ugander et al. (2011); Lengyel et al. (2015). Here we have chosen to analyze two datasets: One is the mobile phone call (MPC) dataset Onnela et al. (2007a) and the other is the Hungarian social networking service iWiW Lengyel et al. (2015). For the MPC network, we consider a link between two users existing provided that it is mutual Onnela et al. (2007a), and for the iWiW network when the friendship was recognized by both users.
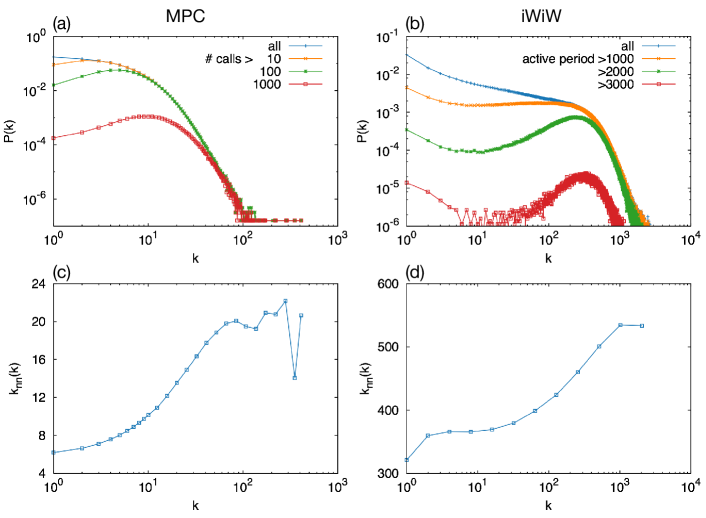
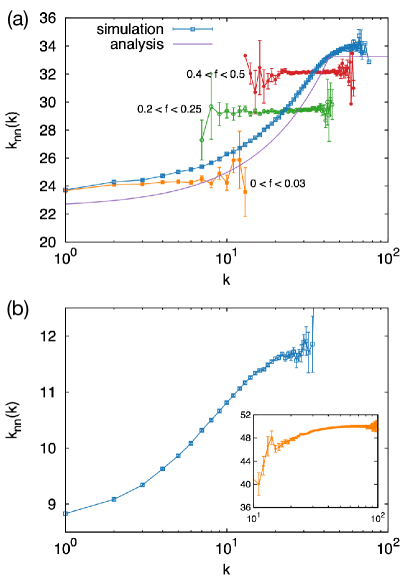
Figure 2 summarizes degree distributions and the average degree of neighbors of the users with degree , which are measured for the MPC and iWiW networks, respectively. For both networks, the degree distribution is found to decrease monotonically. This decrease is slow for a range of small , then followed by a fast decay that is either exponential or follows a power-law with very large decay exponent Onnela et al. (2007a). Both networks show assortativity, characterized by an increasing as a function of . In this paper we focus on these two properties.
The decreasing and the increasing are generally observed for ICT datasets, despite their diverse origins. For example, the average degree for the MPC network is small, i.e., of the order of , while for the Facebook network it is large, i.e., of the order of Ugander et al. (2011). Furthermore, the growth mechanisms of the networks differ from each other. Some require invitation, e.g., in case of iWiW, while others require paid subscription as in case of MPC. However, the stylized facts across various datasets imply that there could exist a common underlying mechanism.
It is reasonable to assume that very few people have only one social contact, thus the maximum of the distribution should not be at unity Hill and Dunbar (2003). This implies that the degree distribution should first increase and then decrease, which we call a peaked degree distribution. We argue that the discrepancy between this plausible picture and most empirical findings from the ICT datasets can be attributed to the selection method of a single communication channel from the whole network of social interaction between people.
In order to support our motivation, we briefly argue the following. As it takes time and effort for people to build up a network on a communication channel, people with larger activity may develop their egocentric networks in a particular channel more similarly to their real egocentric networks. For example, for the MPC network, an activity of a user can be defined as the total number of calls. Then the degree distribution only for users with activity larger than some threshold value is expected to be more similar to the real degree distribution. Figure 2(a) shows that the degree distributions for users with activity above sufficiently large thresholds show peaked behavior, whereas the degree distribution for all users is monotonically decreasing. This may indicate that the discrepancy of overweighting the low degree nodes comes from the low activity users. Since we do not have activity records for the iWiW network, as a proxy for it we use the active period defined by the number of days between the first and last logins. We find the same transformation from monotonically decreasing to peaked degree distribution, as shown in Fig. 2(b). As the egocentric networks of users with large activity are expected to be more similar to the real egocentric networks of users, the observed peaked distribution for such users can be considered as evidence for the peaked degree distributions in the entire social network.
Another important property of social networks is assortative mixing, which is usually attributed to the link formation mechanism related to homophily McPherson et al. (2001). As we do not know the underlying social network exactly, we cannot confirm this at the societal scale. However, we will consider this property here.
III Sampling Method
It is important to stress that ICT datasets report dynamics of a single communication channel while people in general use many different means of communication. The natural relationship network of humans is thus a multi-layer system, in each layer of which there are only links that represent a single communication channel. Therefore, the data related to a single layer can be considered as a special sampling of the entire network. In order to understand this sampling we model how people choose a communication channel or an ICT service to make contacts with other people.
People have diverse interests and preferences for communication and they show different usage patterns of services such as the frequency of visits or the variation of the time spent using the service. For example, users that have invested a considerable amount of time to build up their friendship network would show a higher preference to use the service. The degree of preference of a user to choose a service can be described by an affinity quantity, denoted by for user .
Let us now assume that agents and know each other, and they try to communicate and for that purpose they have to choose a communication channel. In general the agents have different personal affinities towards different communication channels. When they are choosing a channel they tend to avoid those that are inconvenient for the other, because it could risk the success of communication. For example, writing an urgent email to someone who is checking it weekly is not a good idea. Alternatively waiting for someone to appear on an instant messaging channel, if login is irregular, could be meaningless. So naturally everyone tends to choose those channels to communicate with an acquaintance for which both of them have relatively high affinity. Hence, we assume the probability that a link between and is made over a given communication channel is a symmetric function of and , , as introduced in Caldarelli et al. (2002); Boguná and Pastor-Satorras (2003).
Our strategy to investigate the effect of sampling is as follows. Since the real, underlying social network is unknown, we generate surrogate networks with the given properties, such as peaked degree distributions. To these networks we apply a sampling method that mimics the usage of a single communication channel. We note here that ICT dataset may cover only part of the population due to competing services. Random selection of nodes or links does not change the basic characteristics of the degree distribution whether it is monotonously decreasing or peaked.
We assume that the affinity distribution is a decreasing function (e.g. Onnela et al. (2007a); Gyarmati and Trinh (2010)). This implies that a large fraction of people rarely spend time using the service, while there are a relatively small number of enthusiastic users. As for the affinity distribution, we choose an exponential function
| (1) |
where is the average affinity and it serves as a control parameter. Each user is assigned an affinity value that is randomly drawn from , which implies that the correlation between affinities of neighboring users is ignored for simplicity. The effect of such correlations existing in reality can be studied for future work.
We then sample links in the surrogate network with a probability as a function of affinities of users connected by the link. For neighboring users and , the probability of sampling a link is defined as follows
| (2) |
The set of sampled users consists of users that have at least one sampled link. An example of a sampled network from an egocentric network is presented in Fig. 1. We would like to note that our model takes into account only two point correlations. As expected, then all higher order correlations such as clustering are systematically lost by this sampling.
Here we assume the minimum rule for since a link is often established in a communication channel when both nodes and accept to use it. As we will see in Section V, this rule is not only a natural consequence of mutual acceptance, but it is the most representative rule for a broader class of rules that reproduce the observed stylized facts. In addition, the minimum rule is analytically solvable as shown in the next Section.
We now consider three kinds of surrogate networks: Random regular graphs (RR) with degree , Erdős-Rényi random graphs (ER) with average degree , and weighted social networks using link deletion (WSN) with average degree . We will use the WSN studied in our previous work 222The parameters to generate WSN are , , , , and the maximum time step . The notation of the parameters are the same as in Murase et al. (2015).. All three networks show peaked degree distributions. The RR and ER do not show assortative mixing, while the WSN was devised to produce high clustering, community structure, and assortative mixing, as observed in real networks based on ICT data.
IV Results
IV.1 Degree distribution
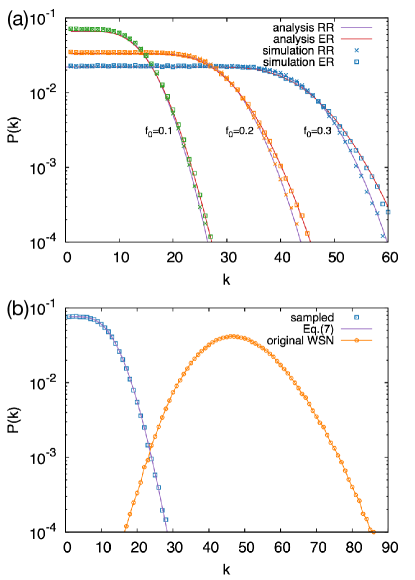
Monotonically decreasing degree distributions are found for sampled networks in all the surrogate networks, as depicted in Fig. 3. For the RR case, degree distributions of the sampled networks are flat up to the crossover degree , followed by exponentially decaying behavior. Similar patterns are observed for the ER and WSN cases with crossover degrees .
We can analytically calculate the degree distribution of the network sampled from the regular random graph with degree . Since the affinities between neighboring nodes are uncorrelated, the probability of sampling a link involving the node with affinity is obtained as
| (3) |
Then we obtain the probability that the node has exactly links in the sampled network as
| (4) |
The degree distribution of the sampled network is calculated as
| (5) | ||||
| (6) |
where denotes the regularized beta function. Here we used the approximation that for all , which is the case for the sufficiently small value of . This analytical solution perfectly fits the simulation results, as shown in Fig. 3(a).
The first part of the degree distribution is flat, which can be calculated. The function may have a very strong peak and can be approximated by a Dirac delta function:
| (7) |
which gives rise to constant up to , and after which it is zero. In Appendix A, other functions are analyzed to show that the exponential function is a borderline between the case when is always decreasing and the case when it has a peak at .
We now consider the case of ER graphs. The degree distribution of the surrogate network is binomially distributed, denoted by . The probability that a node originally having links will keep links is independently of the rest of the network so we can get the degree distribution for any uncorrelated network by a weighted sum of Eq. (5):
| (8) |
We calculate numerically to compare it with the simulation results, as shown in Fig. 3(a). Similarly, one can obtain of the sampled network in the case of WSN [see Fig. 3(b)].
So far we have considered surrogate networks with degree distributions decaying faster than exponential, whereas heavy-tailed degree distributions are observed in many ICT datasets. In order to consider more realistic situations, we generate surrogate networks with log-normal and Lévy distributions of degree, where we used and for log-normal distribution, and and for Lévy distribution. Both distributions have peaks at values larger than . Then, using Eq. (8), we find that degree distributions in the sampled networks using are heavy-tailed but yet monotonically decreasing.
Based on the above analysis and simulations we conclude that the monotonically decreasing degree distribution in most ICT datasets could be the consequence of the sampling method applied to the real social network showing the peaked degree distribution. Our conclusion is robust with respect to the variation of details of the method as will be shown in Sec. V.
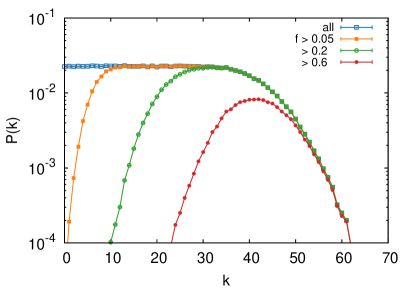
We have found a mechanism transforming the ground-truth peaked degree distribution to the observed monotonically decreasing one. This raises the question whether the activity thresholding that resulted in an opposite direction, i.e., from monotonically decreasing degree distribution to the peaked one would work also for the model. For this, we need to find an appropriate proxy for activity, and affinity seems to be a good candidate since low (high) activity, i.e., low (high) preference for a channel would imply low (high) activity on that channel. We indeed find peaked degree distributions in the sampled networks when considering only nodes with affinity larger than some threshold value in Fig. 4. This peaked behavior compares favourably with the empirical observations as shown in Fig. 2, both in a linear or logarithmic scale.
IV.2 Assortativity
Here we investigate the effect of the proposed sampling method on the assortative mixing of the sampled networks. Figure 5(a) shows that the assortative mixing turns out to be present in the sampled networks even when the nodes in the surrogate network are completely uncorrelated. When the surrogate network shows assortative mixing, e.g., in the case of WSN, the assortativity is observed as expected, see Fig. 5(b).
We first calculate the correlation of affinities between neighboring nodes in the sampled networks. Similarly to the definition of , we define the average affinity of neighboring nodes of a node with affinity , denoted by . Let us denote by the event that a link in the surrogate network is sampled. The affinity distribution of for the neighbor of the node in the sampled network can be written as a conditional probability . Then we get
| (9) | ||||
| (10) | ||||
| (11) |
which turns out to be an increasing function of . Note that in Eq. (3) is the probability of the event that for a given affinity . This result holds irrespective of a structure of the surrogate network. The positive correlation between affinities of neighboring nodes appears even when there is no such correlation in the surrogate networks.
This correlation is expected to persist also in since and are positively correlated. For the RR case with degree , for a node with affinity can be obtained as follows:
| (12) |
The integral part is exactly solved using Eqs. (1–3) as
| (13) |
where . Since the expected degree of a node with affinity is , we replace in Eq. (12) using the assumption of to get for :
| (14) |
or otherwise
| (15) |
From this solution, one can obtain the extreme values of , i.e., when the degree or the affinity is extremely small or large. If the affinity of a node is very small, we get . On the other hand, if the affinity is very large, one gets . We confirm numerically that these solutions apply also to the ER case, as shown in Fig. 5(a).
In Fig. 5(a), we have plotted for nodes whose is in a given range. The assortative behavior mostly disappears as in the surrogate network, implying that the assortativity in the sampled network is attributed to the dependence of on but not on the assortativity of the surrogate network.
Assortative mixing is also observed for the networks sampled from the WSN, as shown in Fig. 5(b). This is not surprising because the surrogate network shows already assortativity. We note that for the surrogate network is concave, while the sampled network shows a slightly convex curve in the log-linear plot. We think that sampling enhances assortativity as compared to that of the surrogate network. This implies that the sampling plays a crucial role in the observed assortativity. An important lesson from this study is that the assortativity observed from sampling does not assure that the original (multiplex) network is assortative.
IV.3 Node strength
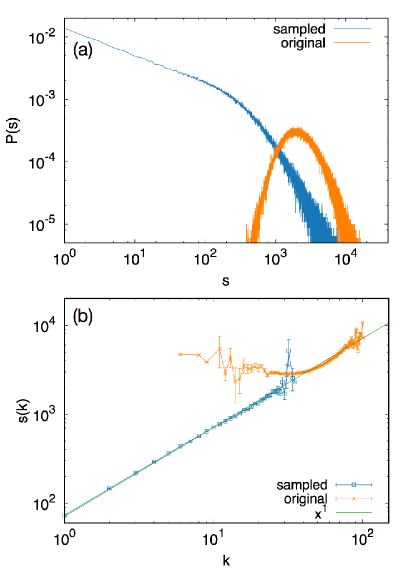
The effect of sampling on the strength distribution of nodes and the strength-degree correlation was tested using the WSN as a surrogate network. The original strength distribution is peaked as seen in Fig. 6(a), and the strength-degree correlation in Fig. 6(b) shows a rather flat and then increasing behavior which is the result of the WSN model Murase et al. (2015).
After the sampling the low degree nodes in the sampled network are not necessarily the ones that had low degree in the original network. The value of affinity has much larger influence on the sampled degree of a node than its original degree. Thus the link weight will be largely independent of the sampled degree of the nodes the link is connected to. This implies linear relationship between the degree and strength, which is exactly what was found in Fig. 6(b). Similar relation was found in the mobile phone dataset presented in Onnela et al. (2007b), where a correlation with was obtained. The empirical data shows almost linear strength-degree correlation, but our model indicates that this result has no implications for the original social network.
As there is only marginal correlation between the degree and the link weight, the degree distribution mostly determines the strength distribution, which is the convolution of the link weight and degree distributions. As a result the strength distribution is a decreasing function instead of being peaked as shown in Fig. 6(a).
V Generalization of the Model
In this section, we generalize our model and discuss the robustness of the results we have seen in the previous section. We will focus on the effects of the affinity distribution and sampling probability.
V.1 Generalized-Mean Model
First, we generalize the distribution of affinity, , to be a truncated Weibull distribution:
| (16) |
where is the normalization constant. Here we implement the truncation at in the affinity distribution instead of the sampling probability. Obviously gives back the exponential distribution. When , a divergence at is seen thus the nodes tend to have a smaller .
The sampling probability is defined as a generalized mean of and with exponent :
| (17) |
The generalized mean includes Pythagoranean means as special cases such that for example when is , , or , it is equivalent to arithmetic, geometric, or harmonic mean, respectively. For any real , is an increasing function of and . For larger , is closer to the larger of and . In the limits of and , is equivalent to and , respectively. Therefore, the model in the previous section is a special case with and .
V.2 Results for Generalized-Mean Model
We conducted numerical simulations for various and using Erdős-Rényi random graphs with as a surrogate network. In the simulations, we controlled for each and so that the sampled network has an average degree of , i.e., about % of the links are sampled.
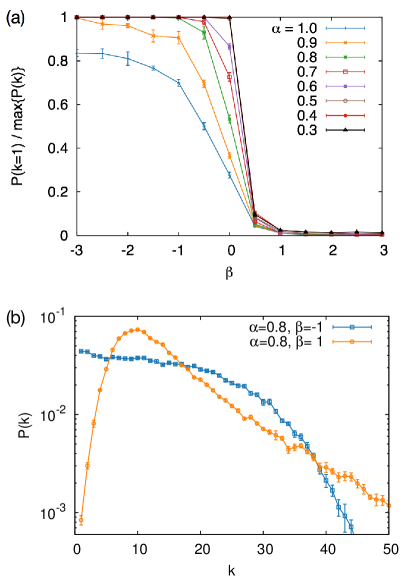
First we investigated whether the degree distribution is monotonically decreasing or not. For this, we define a quantity as . If is monotonically decreasing, must be one while it is less than one when is a peaked distribution. As shown in Fig. 7(a), the monotonically decreasing degree distribution is realized only when and for sufficiently small values of . The parameter range of for which gets wider as decreases, indicating that for smaller values of , nodes have low degrees more easily.
On the other hand, when , there is no parameter region where monotonically decreasing degree distribution is realized as quickly drops to zero. This implies that in this parameter range higher degree nodes are favoured by the sampling probability function. The resulting network will consist of a number of high degree nodes. Numerical results show that is a threshold value above which monotonically decreasing is precluded. Typical degree distributions for these two regions are shown in Fig. 7(b).
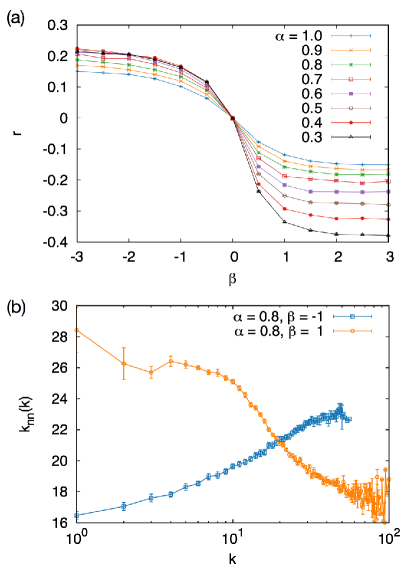
Let us now investigate assortativity. The assortativity coefficient , which is the Pearson’s correlation coefficient of neighboring degrees, is plotted in Fig. 8. The coefficient is positive when while it is negative when . Even though affinity and original degree is independently assigned to each node, degrees in the neighboring nodes get correlated by the sampling. Hereafter we call this the sampling-induced assortativity.
As we have seen in the previous section, the sampling-induced assortativity originates from the correlation of of the neighboring nodes. To understand the dependency of assortativity on , we hereafter consider the correlation of . When , we can analytically prove that there is no correlation of in the sampled network for any . The average affinity of the neighbors of a node with , , is calculated in a similar way as Eq. (9):
| (18) | ||||
| (19) |
which is independent of , stating that there is no correlation of in the neighboring nodes as in the surrogate networks.
In contrast, the assortativity is modified by the sampling when . The differentiation of with respect to is
| (20) |
where . The sign of this equation can be evaluated analytically: When , while when . See Appendix B for details. Therefore, the sign of determines the bias of the assortativity in the sampled networks.
To conclude, we find decreasing only for . In the parameter region where decreasing is realized, the positive correlation of is inevitable. These results indicate that we can not conclude that the whole social network has assortative mixing even when we find assortativity in empirical network taken from one communication channel.
VI Summary and Discussion
The question of general interest is to what extent ICT data can tell us about the structure of the entire social network of people, as all such data are incomplete and capture only a part of the whole plethora of social relationships. While each type of service has different features, we observe universal properties of the networks generated from any service data. There is always a different story behind each service but there is also commonly observed feature, namely that they all display a decreasing degree distribution, which cannot be true for the entire social network and hence must be attributed to the sampling.
To investigate the effect of sampling method we have modeled how people are using ICT communication services. The method is general enough to be applied to various communication channels. The networks sampled by this method robustly reproduce the stylized facts of the ICT data: Decreasing degree distributions and assortative mixing, even when they were absent from the original networks. Thus, the characteristics of the sampled networks can be strongly dependent on the sampling method, hence some properties of the original network are hardly observed.
This result has an important implication such that properties observed on a sampled network may not be true for the original network as turned out to be the case with decreasing degree distribution. Hence it can be the sampling rather than the original network that plays a pivotal role in explaining some of the empirical network properties. There is though a subset of users with high activity, i.e., users who put much effort in the given ICT service. Their network properties show features reminiscent of the true social network so that these users can be used to some extent to reflect the properties from one layer to the whole social network. This can also be shown in our sampling result, where high affinity nodes show properties characteristic for the surrogate networks, i.e., peaked degree distribution and flat in case of ER [see Figs. 4 and 5(a)].
We have checked the robustness of our model by studying more general channel selection functions and affinity distributions. Here we have shown that there is a class of rules that result in the universally observed single channel properties of monotonic degree distribution and assortative mixing. This implies that the choice of the communication channel should follow rules similar to the minimum rule, i.e. a person may be reluctant to use a communication channel with a friend who does not like that channel even if that is the person’s favorite. We note here that we have tested our sampling model on other networks e.g. scale-free with similar result.
The sampling model presented in this paper is only one possible mechanism for link selection. Even though obvious factors such as three-point correlations are missing from it the qualitative agreement between the sampling model and the empirical data is indicative. We did not intend to prove that the model presented here is the very mechanism for communication channel selection but we showed that it is enough to reproduce ICT-related observations from uncorrelated random networks. Thus properties measured on those partial networks may not reflect anything from the original ones, which emphasizes the importance of the simultaneous investigation of multiple communication channels. One of the promising ways to get a more complete picture of human sociality is “Reality Mining” Eagle and Pentland (2006); Jo et al. (2012b); Stopczynski et al. (2014), where several communication channels including face-to-face encounters are simultaneously recorded. Empirical research towards such direction is expected to reveal the relationship between the networks of different communication channels and the way people choose among them. This will help us to understand how much of the results from previous empirical studies concentrating mostly on a certain communication channel can be applied to the whole social network.
Acknowledgements.
J. T. acknowledges financial support of AScI internship programme. Y. M. appreciates hospitality at Aalto University and acknowledges support from CREST, JST. H.-H. J. acknowledges financial support by Basic Science Research Program through the National Research Foundation of Korea (NRF) grant funded by the Ministry of Education (2015R1D1A1A01058958). J. K. acknowledges support from EU Grant No. FP7 317532 (MULTIPLEX). The systematic simulations in this study were assisted by OACIS Murase et al. (2014). Partial support by OTKA, K112713 is gratefully acknowledged. This project was supported by JSPS and NRF under the Japan-Korea Scientific Cooperation Program. This work was supported under the framework of international cooperation program managed by the National Research Foundation of Korea (NRF-2016K2A9A2A08003695). K.K. acknowledges support from Academy of Finland’s COSDYN project (No. 276439) and EU’s Horizon 2020 FET Open RIA 662725 project IBSEN.Appendix A Trial with other affinity distributions
We have noted in the main text that the exponential affinity distribution is a special case for which the degree distribution of the sampled network starts with a constant value. This will be proven using the approximation already mentioned namely that:
| (21) | ||||
| (22) |
The degree distribution is thus
| (23) | ||||
| (24) | ||||
| (25) |
where is the solution of the equation .
For the above equation gives
| (26) |
The second case happens because .
Let us repeat the calculation for arbitrary and we are interested in the behavior of for . This latter assumption implies since only nodes with low affinity have low degree. The probability is calculated as
| (27) | ||||
| (28) |
The derivative is given as
| (29) |
Using this relation, the degree distribution is obtained as a function of :
| (30) |
Since is an increasing function of , when Eq. (30) is an increasing (decreasing) function of , is an increasing (decreasing) function of . Therefore, in order to be constant, must be an exponential function.
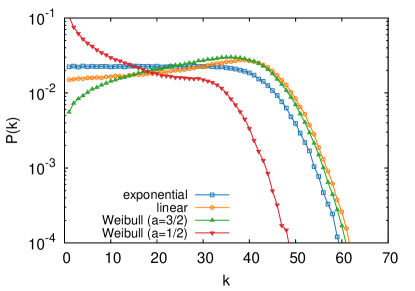
Equation (30) allows us to determine if a degree distribution function starts as decreasing or increasing. In the latter case it will definitely have a peak. As shown in Fig. 9, simulation results of degree distributions for different functional forms are consistent with the above argument. The tested distributions are summarized in Table 1.
| exponential | |||
|---|---|---|---|
| linear | for | ||
| Weibull () | |||
| Weibull () |
Appendix B Sign of Equation (V.2)
In this appendix, we evaluate the sign of , which determines the correlation of between the neighbors in the sampled network.
Here we introduce as
| (34) |
This is a positive increasing function of . When changes from to , changes from to . Using this notation, Eq. (32) is
| (35) | ||||
Chebyshev integral inequality Fink and Jodeit (1984) states that the inequality
| (36) |
holds under the hypothesis that
| (37) |
for all and is a non-negative measure. In other words, the equation holds when and have the same monotonicity. The inverse inequality holds when and have the opposite monotonicity. The proof is obtained by calculating the following inequality:
| (38) |
References
- Lazer et al. (2009) D. Lazer, A. Pentland, L. Adamic, S. Aral, A.-L. L. Barabasi, D. Brewer, N. Christakis, N. Contractor, J. Fowler, M. Gutmann, et al., Science 323, 721 (2009), ISSN 1095-9203, URL http://dx.doi.org/10.1126/science.1167742.
- Onnela et al. (2007a) J. P. Onnela, J. Saramäki, J. Hyvönen, G. Szabó, D. Lazer, K. Kaski, J. Kertész, and A. L. Barabási, Proceedings of the National Academy of Sciences 104, 7332 (2007a), ISSN 1091-6490, eprint physics/0610104v1, URL http://dx.doi.org/10.1073/pnas.0610245104.
- Karsai et al. (2011) M. Karsai, M. Kivelä, R. K. Pan, K. Kaski, J. Kertész, A.-L. Barabási, and J. Saramäki, Physical Review E 83, 025102+ (2011), URL http://dx.doi.org/10.1103/physreve.83.025102.
- Iribarren and Moro (2009) J. L. Iribarren and E. Moro, Physical Review Letters 103, 038702+ (2009), ISSN 0031-9007, eprint 0706.0641, URL http://dx.doi.org/10.1103/physrevlett.103.038702.
- Jo et al. (2012a) H.-H. Jo, M. Karsai, J. Kertész, and K. Kaski, New Journal of Physics 14, 013055+ (2012a), ISSN 1367-2630, URL http://dx.doi.org/10.1088/1367-2630/14/1/013055.
- Wu and Huberman (2007) F. Wu and B. A. Huberman, Proceedings of the National Academy of Sciences 104, 17599 (2007), URL http://dx.doi.org/10.1073/pnas.0704916104.
- Onnela et al. (2007b) J.-P. Onnela, J. Saramäki, J. Hyvönen, G. Szabó, M. Argollo de Menezes, K. Kaski, A.-L. Barabási, and J. Kertész, New Journal of Physics 9, 179+ (2007b), ISSN 1367-2630, URL http://dx.doi.org/10.1088/1367-2630/9/6/179.
- Wu et al. (2010) Y. Wu, C. Zhou, J. Xiao, J. Kurths, and H. J. Schellnhuber, Proceedings of the National Academy of Sciences of the United States of America 107, 18803 (2010), ISSN 1091-6490, URL http://dx.doi.org/10.1073/pnas.1013140107.
- Eckmann et al. (2004) J.-P. Eckmann, E. Moses, and D. Sergi, Proceedings of the National Academy of Sciences of the United States of America 101, 14333 (2004), ISSN 1091-6490, URL http://dx.doi.org/10.1073/pnas.0405728101.
- Ugander et al. (2011) J. Ugander, B. Karrer, L. Backstrom, and C. Marlow, The anatomy of the facebook social graph (2011), eprint 1111.4503, URL http://arxiv.org/abs/1111.4503.
- Kwak et al. (2010) H. Kwak, C. Lee, H. Park, and S. Moon, in Proceedings of the 19th international conference on World wide web (ACM, New York, NY, USA, 2010), WWW ’10, pp. 591–600, ISBN 978-1-60558-799-8, URL http://dx.doi.org/10.1145/1772690.1772751.
- Boccaletti et al. (2014) S. Boccaletti, G. Bianconi, R. Criado, C. I. del Genio, J. Gómez-Gardeñes, M. Romance, I. Sendiña Nadal, Z. Wang, and M. Zanin, Physics Reports 544, 1 (2014), ISSN 03701573, URL http://dx.doi.org/10.1016/j.physrep.2014.07.001.
- Kivelä et al. (2014) M. Kivelä, A. Arenas, M. Barthelemy, J. P. Gleeson, Y. Moreno, and M. A. Porter, Journal of Complex Networks 2, 203 (2014), ISSN 2051-1329, URL http://dx.doi.org/10.1093/comnet/cnu016.
- Lee et al. (2015) K.-M. Lee, B. Min, and K.-I. Goh, The European Physical Journal B 88, 1 (2015).
- Note (1) Note1, exceptions are the Reality Mining type data Eagle et al. (2009); Jo et al. (2012b); Stopczynski et al. (2014), where multichannel information is collected from a relatively small group of volunteers. This is clearly a very interesting line of research but is not directly suitable for large scale conclusions.
- Newman (2004) M. E. J. Newman, Proceedings of the National Academy of Sciences 101, 5200 (2004), ISSN 1091-6490, URL http://dx.doi.org/10.1073/pnas.0307545100.
- Aster et al. (2012) R. C. Aster, B. Borchers, and C. H. Thurber, Parameter Estimation and Inverse Problems, Second Edition (Academic Press, 2012), 2nd ed., ISBN 0123850487, URL http://www.worldcat.org/isbn/0123850487.
- Stumpf et al. (2005) M. P. H. Stumpf, C. Wiuf, and R. M. May, Proceedings of the National Academy of Sciences of the United States of America 102, 4221 (2005), ISSN 1091-6490, URL http://dx.doi.org/10.1073/pnas.0501179102.
- Stumpf and Wiuf (2005) M. P. H. Stumpf and C. Wiuf, Phys. Rev. E 72, 036118+ (2005), URL http://dx.doi.org/10.1103/physreve.72.036118.
- Lee et al. (2006) S. H. Lee, P.-J. Kim, and H. Jeong, Phys. Rev. E 73, 016102+ (2006), ISSN 1539-3755, eprint cond-mat/0505232, URL http://dx.doi.org/10.1103/physreve.73.016102.
- Gjoka et al. (2010) M. Gjoka, M. Kurant, C. T. Butts, and A. Markopoulou, in Infocom, 2010 Proceedings IEEE (IEEE, 2010), pp. 1–9.
- Lengyel et al. (2015) B. Lengyel, A. Varga, B. Ságvári, A. Jakobi, and J. Kertész, Geographies of an online social network (2015), eprint 1503.07757, URL http://arxiv.org/abs/1503.07757.
- Hill and Dunbar (2003) R. A. Hill and R. I. M. Dunbar, Human Nature 14, 53 (2003), URL http://dx.doi.org/10.1007/s12110-003-1016-y.
- McPherson et al. (2001) M. McPherson, L. Smith-Lovin, and J. M. Cook, Annual Review of Sociology 27, 415 (2001).
- Caldarelli et al. (2002) G. Caldarelli, A. Capocci, P. De Los Rios, and M. A. Muñoz, Phys. Rev. Lett. 89, 258702+ (2002), URL http://dx.doi.org/10.1103/physrevlett.89.258702.
- Boguná and Pastor-Satorras (2003) M. Boguná and R. Pastor-Satorras, Phys. Rev. E 68, 036112+ (2003), ISSN 1063-651X, URL http://dx.doi.org/10.1103/physreve.68.036112.
- Gyarmati and Trinh (2010) L. Gyarmati and T. A. Trinh, IEEE network 24, 26 (2010).
- Note (2) Note2, the parameters to generate WSN are , , , , and the maximum time step . The notation of the parameters are the same as in Murase et al. (2015).
- Murase et al. (2015) Y. Murase, H.-H. Jo, J. Török, J. Kertész, and K. Kaski, PLoS ONE 10, e0133005+ (2015), URL http://dx.doi.org/10.1371/journal.pone.0133005.
- Eagle and Pentland (2006) N. Eagle and A. Pentland, Personal Ubiquitous Comput. 10, 255 (2006), ISSN 1617-4909, URL http://dx.doi.org/10.1007/s00779-005-0046-3.
- Jo et al. (2012b) H.-H. Jo, M. Karsai, J. Karikoski, and K. Kaski, EPJ Data Science 1, 10+ (2012b), ISSN 2193-1127, URL http://dx.doi.org/10.1140/epjds10.
- Stopczynski et al. (2014) A. Stopczynski, V. Sekara, P. Sapiezynski, A. Cuttone, M. M. Madsen, J. E. Larsen, and S. Lehmann, PLoS ONE 9, e95978+ (2014), URL http://dx.doi.org/10.1371/journal.pone.0095978.
- Murase et al. (2014) Y. Murase, T. Uchitane, and N. Ito, Physics Procedia 57, 73 (2014), ISSN 18753892, URL http://dx.doi.org/10.1016/j.phpro.2014.08.134.
- Fink and Jodeit (1984) A. M. Fink and M. Jodeit, On Chebyshev’s other inequality (Institute of Mathematical Statistics, Hayward, CA, 1984), vol. 5 of Lecture Notes–Monograph Series, pp. 115–120, ISBN 0-940600-04-8, URL http://dx.doi.org/10.1214/lnms/1215465637.
- Eagle et al. (2009) N. Eagle, A. S. Pentland, and D. Lazer, Proceedings of the National Academy of Sciences 106, 15274 (2009), ISSN 1091-6490, URL http://dx.doi.org/10.1073/pnas.0900282106.