Multi-band superconductivity and large anisotropy in FeS crystals
Abstract
By using a hydrothermal method, we have successfully grown crystals of the newly discovered superconductor FeS, which has an isostructure of the iron based superconductor FeSe. The superconductivity appears at about 4.5K, as revealed by both resistive and magnetization measurements. It is found that the upper critical field is relatively low, with however an rather large anisotropy . A huge magnetoresistivity (290 at 9T and 10K, c-axis) together with a non-linear behavior of Hall resistivity vs. external field are observed. A two-band model is applied to fit the magnetoresistance and non-linear transverse resistivity, yielding the basic parameters of the electron and hole bands.
pacs:
74.70.Xa, 74.25.Fy, 74.25.Ha, 81.20.-nI Introduction
The discovery of high temperature superconductivity in fluorine doped LaFeAsO has opened a new era for the research on unconventional superconductivityHosonoJACS2008 . As far as we know, there are at least eight different structures concerning the FeAs-based and FeSe-based superconductorsChuCW ; WenHH ; RGreene . Beyond the iron pnictides, so far, many relatives with similar structures have been found to exhibit superconductivity. For example, superconductivity has been discovered in iron chalcogenidesWuMK , leading to the great expansion of the iron-based superconducting families. The highest superconducting transition temperature, as revealed by the traditional criterion, namely the Meissner effect and zero resistance stays still at about 55-57K in the 1111 system ChenXHNature ; RenZACPL ; XuZAEPL ; ChengPEPL . In many iron chalcogenide superconductors, the doping of sulfur leads to the localization effect of electrons and the system exhibits insulating behavior in low temperature regionPetrovic ; Petrovic2 . This is probably due to the narrow bandwidth of the p-electrons in sulfur element. It is thus a surprise to observe superconductivity at 4.5K in the FeS systemHuangFQ1 with the typical -PbO structureWuMK . A preliminary band structure calculation has indeed told that the electronic structure as well as the Fermi surfaces are quite similar in FeSe and FeS systems, namely with almost identical contributions from the electron and hole pocketsFeSband . Thus, it is very curious to know whether the newly discovered superconductivity in the FeS system has some similarities as that of the FeSe systems. In this paper, we report the characterizations of superconductivity in crystals of FeS. Our results reveal multi-band superconductivity, a rather large anisotropy of superconductivity, a huge magnetoresistivity and non-linear Hall effect.
II Experimental details
In this paper, we report the successful growth of the FeS crystals using a hydrothermal methodDong ; DuZY . Firstly, K0.8Fe1.6S2 crystals were grown using the self-flux method. Next, NaOH (JK, 99 purity) was dissolved in deionized water in a teflon-linked stainless-steel autoclave (volume 25 mL). Then, iron powder (Aladdin Industrial, 99.99 purity), thiourea (JK, 99.9 purity), and several pieces of K0.8Fe1.6S2 crystals were added to the solution. After that, the autoclave was sealed and heated up to 120 ∘C followed by staying for 25 hours. Finally, all the potassium atoms are extracted from the body and the FeS crystals can be obtained by leaching.
In this study, X-ray diffraction (XRD) measurements are performed on a Bruker D8 Advanced diffractometer with the Cu-Kα radiation. DC magnetization measurements are carried out with a SQUID-VSM-7T (Quantum Design). The resistive measurements are done with the four-probe method on a Quantum Design instrument Physical Property Measurement System (PPMS). And the Hall resistive measurements are done with the six-probe method.
III Results and discussion
III.1 Sample characterization
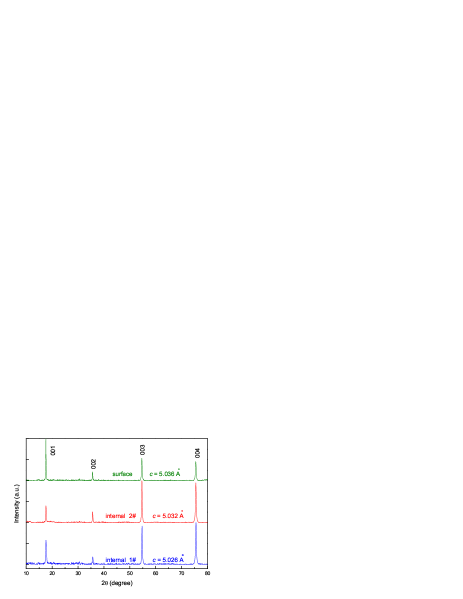
In Fig. 1, we show the X-ray diffraction (XRD) spectra for three different parts of an FeS crystal. The sample has a very layered feature and can be easily cleaved. One XRD pattern is taken from the external surface of the crystal directly and two measurements are done on the inner surfaces after cleaving the same crystal. One can see that only (00l) reflections can be seen in all the spectra, yielding a c-axis lattice constant . Both inside and outside parts show similar behavior and the lattice constants are close to in the previous reportHuangFQ1 , indicating a uniform bulk property of our FeS crystal with a tetragonal structure.
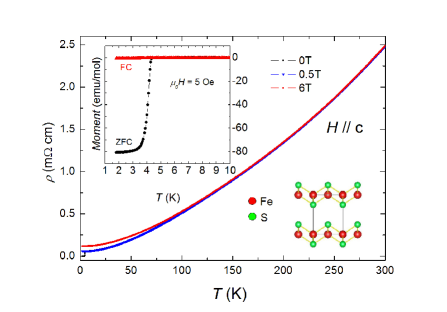
The temperature dependence of resistivity at various magnetic fields are shown in Fig. 2. The lower right inset of Fig.2 shows the schematic crystal structure of tetragonal FeS. With the lowering down of temperature, the resistivity decreases monotonically, which shows a highly metallic conductivity. The residual resistivity ratio, defined as RRR=46, is quite large, indicating the good quality of the sample. It is interesting to have a comparison with the FeSe single crystalsWuMK ; Hurongwei ; Matsuda . In the early FeSe samples, the RRR in FeSe was reported less than 15WuMK ; Hurongwei . However, a newly updated value of RRR=80 can be estimated in a clean FeSe single crystalMatsuda . Having a glance at the temperature dependence of resistivity in FeSe and FeS, one can immediately find the difference. The temperature dependent resistivity in FeS exhibits a positive curvature all the way up to 300 K, not like that in FeSe where a negative curvature is generally observed in the high temperature regionWuMK ; Hurongwei ; Matsuda . With the increase of applied magnetic field, superconductivity is quickly suppressed ( c-axis), and a significant magnetoresistance (MR) is also observed. In zero field, an abrupt resistivity drop can be seen at = 4.5K. This superconducting transition can also be seen in the temperature dependence of the magnetic susceptibility measurements with the zero-field-cooled (ZFC) and field-cooled(FC) modes shown in the upper left inset of Fig.2. Since the curve measured in the ZFC mode is flattening in the low temperature limit, and the XRD data shows the pure FeS phase, we can conclude the perfect superconducting shielding of the sample at 5 Oe.
III.2 Magnetic and transport properties
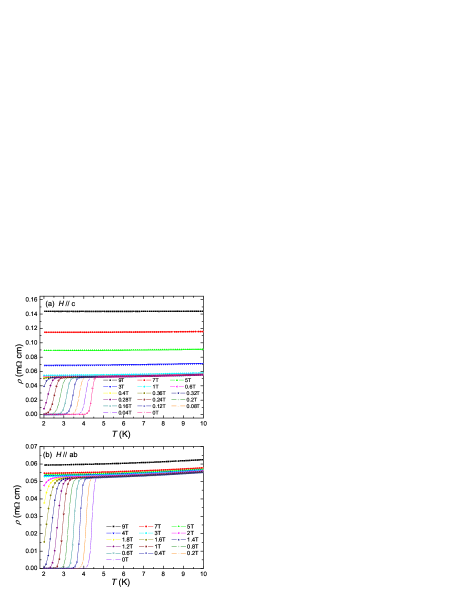
Fig. 3(a) and (b) present the resistivity data measured under different magnetic fields of (a) c-axis and (b) ab-plane, while the current is always applied in the ab-plane. The superconducting transition appears at 4.5K at an ambient field. As the applied field is increased, the superconducting transition is suppressed down to 2K gradually. The superconductivity at 2K vanishes at a magnetic field of only 0.36 T when c-axis, or about 2T when ab-plane. This indicates a quite large anisotropy. Furthermore, the behavior of magnetoresistivity under high fields for the two directions are very distinct. The magnetoresistance can reach 180% at =5K with =9T when the magnetic field is parallel to c-axis. For some samples, the MR value can even reach 290% (see below). This value, as far as we know, is much higher than many iron based materials, including the BaFe2As2 parent phaseBaFe2As2MR and the NdFeAsO parent phaseChengPPRB . However, it is comparable with the MR value in the recently reported clean FeSe crystalMatsuda . In the two band model, the magnetoresistance can be enhanced when the charge carriers from the two bands have opposite signs. This explains why the magnetoresistance effect is very strong when the field is applied parallel to the c-axis. Similar case occurs in the MgB2 system with electron and hole contributionsYangHuanPRL2008 . When the field is applied along the ab-plane, as shown in Fig.3(b), the magnetoresistance is only about 13% at 9T and 5K. For different samples, this value can vary a little bit, but is still very small. This strongly indicates a two-dimensional feature of the electric conduction.
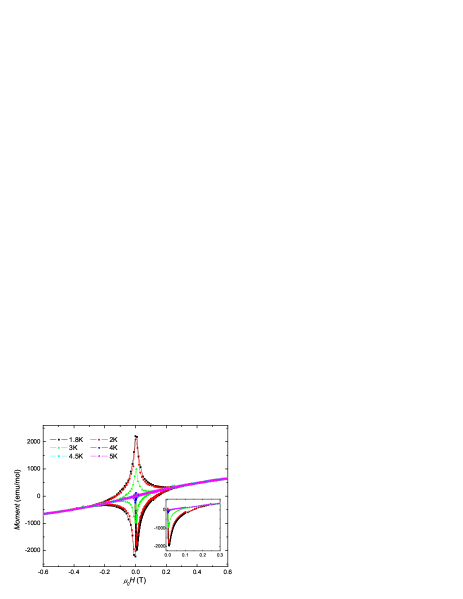
Fig. 4 presents the magnetization hysteresis loops (MHLs) of the FeS crystal at various temperatures with the magnetic field applied parallel to c-axis. A weak and soft ferromagnetic background can be seen above . No hysteresis of this ferromagnetic background is observed here. This weak ferromagnetic signal may come from the magnetic impurities or it is an intrinsic feature, which needs to be further resolved in the future. From the MHLs, we also determined the width of the magnetization in the field ascending and decreasing processes. The shape of MHLs and the hysteresis indicate that FeS is a type-II superconductor. The inset shows an enlarged view of the magnetization in the magnetic penetrating process. One can see that the full penetrating field which corresponds to the maximum value of magnetization is only about 85Oe (1.8K). This suggests either a low charge carrier density, or an easy vortex motion with weak flux pinning effect.
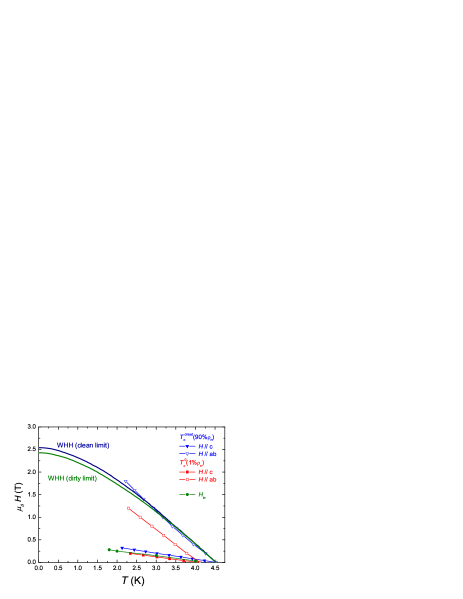
In Figure 5, we show the upper critical field and irreversible field versus temperature. To determine the upper critical field , we can linearly extrapolate the resistivity data between 5K and 10K down to low temperature region as the normal-state value , and then determine with the criterion of 90% , and with 1% , respectively. The irreversibility line (T) is determined from the irreversible magnetization shown in Fig. 4 by using the criterion of = 20 emu/mol. This criterion is chosen since our instrument gives an opening width of magnetization, i.e., = 20 emu/mol in the normal state (5K). For a FeS sample with 1 mg mass, this corresponds to the criterion of 2.27. The reason for this may be the slight diamagnetic signal coming from the organic Teflon tape, or induced by the eddy current of the supporting copper tube. The upper critical fields curves (T) look rather straight and even slightly positively curved. This may be induced by the multi-band effectMultibandHc2 . We also add the theoretical curves for (T) of the Werthamer-Helfand-Hohenberg (WHH) theory in the dirty and clean limit. One can see that, in the temperature region of 2.5K to , the experimental data are close to the theoretical curves. Because of the linearity of (T) near , the data can be easily fitted with a linear line with the slopes =-0.13392(T/K), =-0.77861(T/K) with the magnetic fields parallel to c-axis and ab-planes, respectively. Using the data with the criterion of 90% , we can get the upper critical field by using the WHH formulaWHH formula in the dirty limit , which gives (0)=0.42T and (0)=2.4T. The anisotropy determined by the ratio of the upper critical field along the two different directions is about 5.8. This value is much higher than most 11, 111 and 122 iron-based superconductorsYuan ; M.A.Tanatar ; LiChunhongPRB , but comparable to that in 1111 systemJiaYinAPL . We became aware of a recent report on the FeS crystal synthesized in the similar way as oursPaglione , the authors report an anisotropy of about 10 for the FeS system.
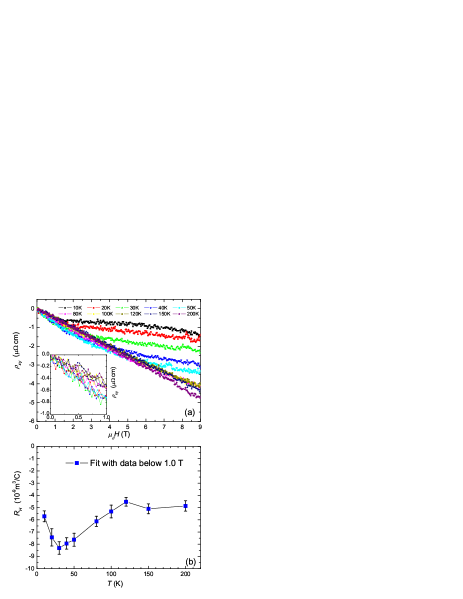
The Hall resistance and the magnetoresistance measurements shown below are done on a separate sample. In Fig. 3(a), we have showed a very strong MR effect observed with c-axis. A straightforward understanding to the large MR would be the multi-band effect. From the band structure calculationsFeSband , indeed, both the hole and electron pockets appear in identical Fermi surface area. We thus have measured the Hall resistivity and present the data at various temperatures in Fig. 6(a). For temperatures below 80K, does not have a linear correlation with the magnetic field. While, interestingly, the Hall resistivity exhibits a kinky feature at temperatures of 10K and 20K. Below a certain field, the shows a rough linear behavior. We must emphasize that for a simple two-band system, the Hall resistivity vs. may be non-linear, but normally it will not show a kinky feature. We would assume that this kinky structure may be observed by accident in the low temperature region due to the multi-band effect. However, with increasing temperature, the non-linear curves at low temperatures seem to evolve gradually to the linear ones at high temperature (above 80K). So we can assume that at high temperatures, one main band makes most contribution to the conduction. As the temperature is cooled down, multi-band effect emerges. We thus calculate the Hall coefficient using the low-field part of each curve below 1T and show the results in Fig. 6(b). It is very interesting that the Hall coefficient is generally negative showing a dominance of the electron-like charge carriers. In the low temperature region, there is a non-monotonic temperature dependence of vs. . This behavior is different from that in many FeAs-based systems in which the Hall coefficient, no matter positive or negative in sign, increases the magnitude in lowering the temperatureChengPPRB ; BaFe2As2Hall ; SrFeAsFHanFei . This enriched message from the Hall effect measurements must reflect an interesting multi-band effect.
III.3 Multi-band analysis on the transport data
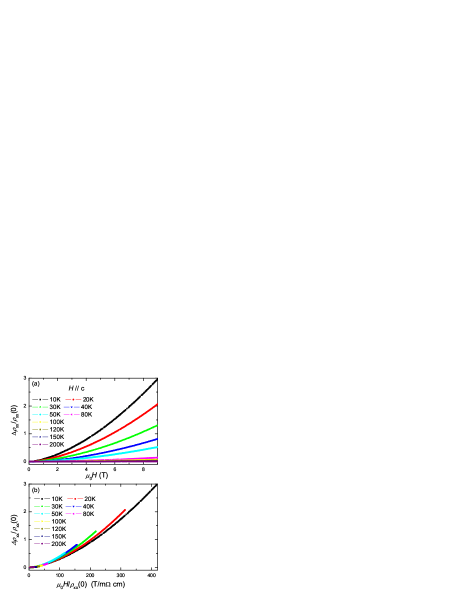
In Fig. 7(a), we present the MR effect when the current is applied parallel to the ab-plane and the magnetic field is aligned along -axis. One can see that the MR can reach about 290% at 9 T and 10 K, and this value is rather high, even considering those in the parent phase with the presence of the antiferromagnetic orderChengPPRB ; BaFe2As2Hall . We have also tried the Kohler’s plot scaling of the magnetoresistance and the scaling is shown in Fig. 7(b). One can find an obvious violation of the Kohler’s scaling rule, which can be attributed to the multi-band effect in this system.
The huge MR effect together with the violation of Kohler’s rule can certainly get an explanation from the multi-band effect, since the multiple scattering rate (or mobility ) and the charge carrier density ( band index, and is the effective mass) entangle each other and contribute a large MR effect when the scattering rate of each band has different temperature dependenceYangHuanPRL2008 . In the system with the isotropic mobility and effective mass for each band, the longitudinal and transverse conductance tensor components can be expressed as
| (1) |
| (2) |
Eqs. 1 and 2 are used to describe the transport properties of the system with types of charge carrier, and is the conductance for the band at zero magnetic field. However, neither the two-band model () nor the three-band one () can fit the experimental data very well by using two or three sets of and (results not shown here), which may suggest that the Fermi surface for each band is more complex than a simple cylindric shaped one, or the effective mass or the mobility is not a constant for each band. In a two-band model in the low field region, the conductances can be expressed as the polynomial expansion form approximately to the third terms,
| (3) |
| (4) |
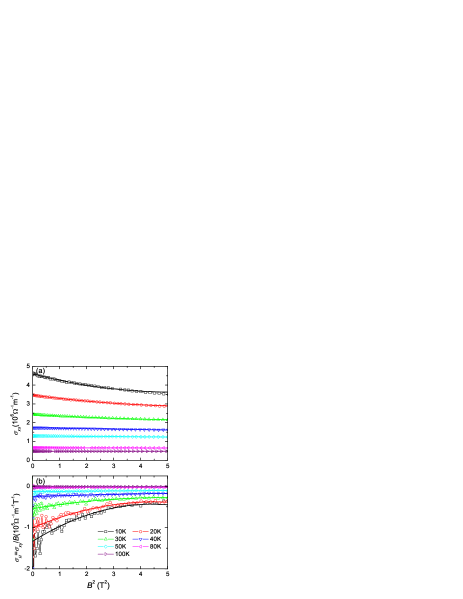
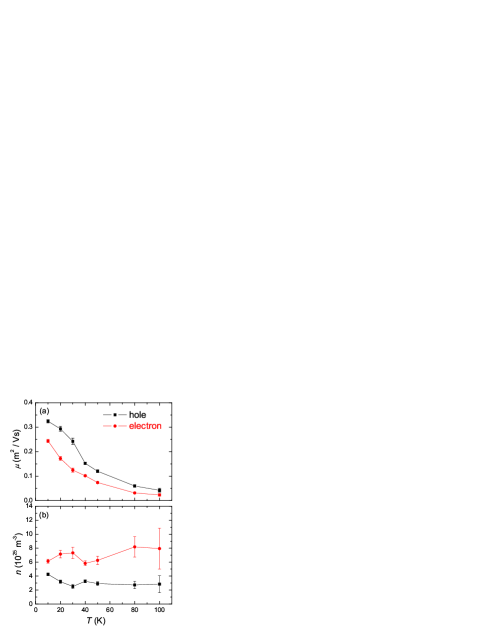
In the case of approximate two-band model, we have only four parameters, namely and (i=1, 2) that need to be resolved. According to above equations, at each temperature, we have two curves (B) and (B) to be fitted in order to yield the wanted parameters. We use Eqs. 3 and 4 to fit the experimental data in the low field region, and the fitting results are shown in Fig. 8 with the solid lines. For different temperatures, the fitting ranges of magnetic field are slightly different. The fitting range is 0 - 2 T for the data measured at 10 K, 20 K and 30 K, 0 - 3 T for 40 K and 50 K, and 0 - 4 T for 80 K and 100 K. The parameters resulting from the fitting are given in Fig. 9. It should be noted that only the scattering rate is expected to have the temperature dependence, and for each band should be constant at different temperatures. As shown in Fig. 9(b), for both bands have indeed very weak temperature dependence, which makes the fitting more reliable. From the results derived here, we can find that there should be both an electron band and a hole band in this material, and the two kinds of charge carriers have almost balanced mobilities and charge carrier densities at different temperatures. This is consistent with the theoretical results of band structure calculations that the electron and hole like charge carriers contribute almost identically in FeSFeSband . Although we have concluded only multi-band electric conduction from the normal state properties, the multi-band superconductivity is naturally imaginable, since superconductivity is evolved from the normal state. Recent thermal conductivity and specific heat data give strong support to the multi-band superconductivityLiSY ; FeSSH . Our detailed characterization of superconductivity and the normal state properties, especially the strong magnetoresistance and high anisotropy in FeS will stimulate further investigations in this new superconductor, and help to reach the final understanding to the mechanism of the iron-based superconductors.
IV Conclusions
In summary, we have successfully grown crystals of FeS with a tetragonal structure. Resistive measurements reveal that the anisotropy determined from the slopes of upper critical fields near under two configurations ab-plane and c-axis is about 5.8. Further resistive measurements reveal a very strong magnetoresistance (up to 290 at 9T and 10K) when c-axis and a clear non-linear Hall effect. Detailed analysis based on the approximate two-band model give rise to the basic parameters of the electron and hole bands, showing almost balanced contributions of these two bands. All these suggest the importance of multi-band effect and rather high anisotropy of the new superconducting FeS system.
ACKNOWLEDGMENTS
This work was supported by the National Natural Science Foundation of China (Grant No. 11534005, No.11190023), the Ministry of Science and Technology of China (Grant Nos.2011CBA00102, 2012CB821403).
References
- (1) Y. Kamihara, T. Watanabe, M. Hirano, and H. Hosono, J. Am. Chem. Soc. 130, 3296 (2008).
- (2) C. W. Chu, Nature Phys. 5, 787 (2009).
- (3) H. H. Wen and S. Li, Annu. Rev. Condens. Matter Phys. 2, 121 (2011).
- (4) J-P. Paglione and R. L. Greene, Nat. Phys. 6, 645 (2010).
- (5) P. F.-C. Hsu, J.-Y. Luo, K.-W. Yeh, T.-K. Chen, T.-W. Huang, P. M. Wu, Y.-C. Lee, Y.-L. Huang, Y.-Y. Chu, D.-C. Yan, et al., Proceedings of the National Academy of Sciences105,14262 (2008).
- (6) X. H. Chen, T. Wu, G. Wu, R. H. Liu, H. Chen, and D. F. Fang, Nature 453, 761 (2008).
- (7) Z. A. Ren, W. Lu, J. Yang, W. Yi, X. L. Shen, Z. C. Li, G. C. Che, X. L. Dong, L. L. Sun, F. Zhou, and Z. X. Zhao, Chin. Phys. Lett. 25, 2215 (2008).
- (8) C. Wang, L. Li, S. Chi, Z. Zhu, Z. Ren, Y. Li, Y. Wang, X. Lin, Y. Luo, S. Jiang, X. Xu, G. Cao, and Z. Xu, Europhys. Lett. 83, 67006 (2008).
- (9) P. Cheng, B. Shen, G. Mu, X. Y. Zhu, F. Han, B. Zeng and H. H. Wen, Europhys. Lett. 85, 67003 (2009).
- (10) H. Lei, M. Abeykoon, E. S. Bozin, K. Wang, J. B. Warren, and C. Petrovic, Phys. Rev. Lett. 107, 137002 (2011).
- (11) K. Wang, H. Lei, and C. Petrovic, Phys. Rev. B. 84, 054526 (2011).
- (12) X. Lai, H. Zhang, Y. Wang, X. Wang, X. Zhang, J. Lin, and F. Huang, JACS 137, 10148 (2015).
- (13) L. Zhang, D. J. Singh, and M. H. Du, Phys. Rev. B. 78, 134514 (2015).
- (14) X. Dong, K. Jin,D. Yuan, H. Zhou, J. Yuan, Y. Huang, W. Hua, J. Sun, P. Zheng, W. Hu, Y. Mao, M. Ma, G. Zhang, F. Zhou, and Z. Zhao, Phys. Rev. B. 92, 064515 (2015).
- (15) Z. Du, X. Yang, H. Lin, D. L. Fang, G. Du, J. Xing, H. Yang, X. Zhu, and H. H. Wen, Nat. Commun. 7, 10565 (2016).
- (16) H. Lei, R. Hu, and C. Petrovic, Phys. Rev. B. 84, 014520 (2011)
- (17) S. Kasahara, T. Watashige, T. Hanaguri, Y. Kohsaka, T. Yamashita, Y. Shimoyama, Y. Mizukami, R. Endo, H. Ikeda, K. Aoyama, T. Terashima, S. Uji, T. Wolf, H. von Lneysen, T. Shibauchi, and Y. Matsuda, PNAS 111, 16309-16313 (2014).
- (18) P. Zheng, G. Chen, Z. Li, W. Hu, J. Dong, G. Li, N. L. Wang, and J. L. Luo, Chin. Phys. Lett. 26, 107401 (2009)
- (19) P. Cheng, H. Yang, Y. Jia, L. Fang, X. Zhu, G. Mu, and H. H. Wen, Phys. Rev. B. 78, 134508 (2008).
- (20) H. Yang, Y. Liu, C. Zhuang, J. Shi, Y. Yao, S. Massidda, M. Monni, Y. Jia, X. Xi, Q. Li, Z.-K. Liu, Q. Feng, and H. H. Wen, Phys. Rev. Lett. 101, 067001 (2008).
- (21) F. Hunte, J. Jaroszynski, A. Gurevich, D. C. Larbalestier, R. Jin, A. S. Sefat, M. A. McGuire, B. C. Sales, D. K. Christen, and D. Mandrus, Nature, 453, 903(2008).
- (22) N. R. Werthamer, E. Helfand, and P. C. Hohenberg, Phys. Rev. 147, 295 (1996).
- (23) M. Fang, J. Yang, F.Balakirev, Y. Kohama, J. Singleton, B. Qian, Z. Q. Mao, H. Wang, and H. Yuan, Phys. Rev. B. 81, 020509 (2010).
- (24) N. Spyrison, M. A. Tanatar, K. Cho, Y. Song, P. c. Dai, C. L. Zhang, and R. Prozorov, Phys. Rev. B. 86, 144528 (2012).
- (25) C.-H. Li, B. Shen, F. Han, X. Zhu, H. H. Wen, Phys. Rev. B. 83, 184521 (2011).
- (26) Y. Jia, P. Cheng, L. Fang, H. Luo, H. Yang, C. Ren, L. Shan, C. Gu, and H. H. Wen, Appl. Phys. Lett. 93, 142506 (2008).
- (27) C. K. H. Borg, X. Zhou, C. Eckberg, D. J. Campbell, S. R. Saha, J. Paglione and E. E. Rodriguez, arXiv 1512.01245v3.
- (28) L. Fang, H. Luo, P. Cheng, Z. Wang, Y. Jia, G. Mu, B. Shen, I. I. Mazin, L. Shan, C. Ren, and H. H. Wen, Phys. Rev. B. 80, 140508(R) (2009).
- (29) F. Han, X. Zhu, G. Mu, P. Cheng, H. H. Wen, Phys. Rev. B. 78, 180503(R) (2008).
- (30) T. Ying, X. Lai, X. Hong, Y. Xu, L. He, J. Zhang, M. Wang, Y. Yu, F. Huang, and S. Y. Li, arXiv:1511.07717 (2015)
- (31) J. Xing, H. Lin, Y. Li, S. Li, X. Zhu, H. Yang, and H. H. Wen, arXiv:1512.04074 (2015).