Site and bond percolation thresholds in -based lattices:
Vulnerability of quantum annealers to random qubit and coupler failures
on chimera topologies
Abstract
We estimate the critical thresholds of bond and site percolation on nonplanar, effectively two-dimensional graphs with chimera like topology. The building blocks of these graphs are complete and symmetric bipartite subgraphs of size , referred to as graphs. For the numerical simulations we use an efficient union-find based algorithm and employ a finite-size scaling analysis to obtain the critical properties for both bond and site percolation. We report the respective percolation thresholds for different sizes of the bipartite subgraph and verify that the associated universality class is that of standard two-dimensional percolation. For the canonical chimera graph used in the D-Wave Systems Inc. quantum annealer (), we discuss device failure in terms of network vulnerability, i.e., we determine the critical fraction of qubits and couplers that can be absent due to random failures prior to losing large-scale connectivity throughout the device.
pacs:
64.60.ah,64.60.F-,07.05.Tp,64.60.anI Introduction
In its most basic variant, the standard percolation model comprises a very minimalistic model of porous media Broadbent and Hammersley (1957); Hammersley, J. M. (1957); Hammersley (1957). However, despite its simplicity, percolation can be applied to problems across disciplines ranging from forest fires to current flow in resistor networks, liquid gelation, network connectivity, coffee brewing, simple configurational statistics Fisher (1961), transport phenomena in ionic glasses Bunde et al. (1991), string-bearing models that also involve a large degree of optimization, describing, for example, vortices in high superconductivity Pfeiffer and Rieger (2002, 2003), to name a few. Although conceptually simple, the configurational statistics of the percolation problem feature a nontrivial phase transition Stauffer (1979); Stauffer and Aharony (1994). To facilitate intuition, consider, for example, random-bond percolation on a two-dimensional square lattice where one studies a diluted system in which only a random fraction of the edges subsist. The connected components Essam and Fisher (1970) of the lattice can be seen as clusters that are then analyzed with respect to their geometric properties. Depending on the fraction of subsisting edges, the geometric properties of the clusters change: Exceeding a lattice-structure dependent critical threshold , the model transitions from a disconnected phase with typically small clusters to a phase where there is a single large cluster that interconnects a finite, nonzero fraction of the lattice sites, thus achieving large-scale connectivity. The appearance of this system-spanning cluster can be described by a second-order phase transition Yeomans (1992).

Because the location of the percolation critical point is sensitive to the topology of the underlying graph, there is general interest in understanding these threshold values for relevant model systems Becker and Ziff (2009); Saberi (2015). In some cases it is possible to derive these thresholds exactly by analytical calculations. For example, in Refs. Newman et al. (2001) and Callaway et al. (2000) a generating function approach was developed to determine the statistical properties of random graphs with arbitrary degree distribution (e.g., Erdős-Rényi random graph ensembles). Unfortunately, this is only typically possible for few exceptional cases and so it is generally necessary to rely on numerical approaches (e.g., via Monte Carlo simulations) to calculate the precise percolation thresholds via a finite-size scaling analysis on finite lattices. In this regard, from a point of view of numerical simulations, significant algorithmic progress has been made by using bookkeeping concepts based on union-find data structures Cormen et al. (2001) that led to highly efficient algorithms for bond and site percolation problems Newman and Ziff (2000, 2001). For an extension of the algorithmic procedure to continuum percolation models, describing spatially extended, randomly oriented and possibly overlapping objects, see Ref. Mertens and Moore (2012).
Here, we perform numerical simulations to estimate the thresholds for both bond and site percolation on nonplanar effectively two-dimensional lattices, where the elementary building blocks are given by subgraphs, i.e., complete bipartite subgraphs of size Essam and Fisher (1970) (see Sec. II below for details). The particular choice of is known as the chimera graph Bunyk et al. (2014), which is the native (hardware) topology of the special-purpose quantum annealing device developed by D-Wave Systems Inc. com (a). Our motivation to study percolation on the chimera graph stems from the possible existence of fabrication defects or trapped fluxes that might lead to either malfunctioning qubits (see, for example, Fig. 1 in Ref. Bian et al. (2014)) or couplers, thus restricting the size of embeddable problems on the D-Wave chip Klymko et al. (2014). From an alternative point of view, adopted in the context of network robustness and vulnerability Albert et al. (2000); Callaway et al. (2000), the fraction might be interpreted as the fraction of sites or bonds that might be absent due to random failures, such as fabrication defects, trapped fluxes, or operational errors, while still maintaining large-scale connectivity throughout the chip. Above , however, large-scale connectivity will be lost, leaving small-sized interconnected qubit clusters only. This could also affect the functionality of the chip and become an important issue for particular embeddings of problems where a large fraction of (randomly chosen) couplers are turned off com (b).
There are multiple reasons to compute the percolation threshold of chimera like lattices: First, the native com (c) benchmark problem to study the D-Wave device is an Ising spin glass Binder and Young (1986); Stein and Newman (2013) on the chimera lattice. Because true optima need to be computed using classical simulation techniques to verify that the device can, indeed, find the solutions of the problems, efficient optimization techniques have to be used Katzgraber et al. (2014, 2015). Often, not only is the minimum of the cost function needed, but also the ground-state degeneracy. Monte Carlo based methods, such as isoenergetic cluster moves Zhu et al. (2015), have proven to be extremely efficient in studying systems with low ground-state degeneracy; however, to improve the efficiency of the algorithm, it is imperative to know the site percolation threshold of the underlying lattice. Simple subgraphs with known ground states, such as one-dimensional graphs Hen et al. (2015); King (2015) and spanning trees hal (2015), have been investigated on the D-Wave device. In addition, there have been attempts to create hard benchmark problems using planted solutions Boixo et al. (2014). While these elegant approaches have the advantage that the solution to the problem to be optimized is known a priori, the used construction procedures might lead to diluted graphs in which only a finite fraction of edges on the lattice are used. Although the construction procedure contains correlations and the adding of edges is not purely random, the problem shares characteristics of random bond percolation and so disconnected clusters might occur. Finally, next-generation hardware might likely include a more interconnected topology, i.e., larger values of in the building blocks. Understanding the possible failure rate of these more complex architectures due to percolation is of great importance in the design and scalability of future-generation devices.
Here, we numerically study the -based chimera lattice with up to sites and estimate the site-percolation threshold by performing a finite-size scaling of the Binder parameter Binder (1981a) to be (see also the Supplemental Material of Ref. Zhu et al. (2015)). In addition, we study general -based chimera like lattices with and estimate the corresponding bond- and site-percolation thresholds , as well as the associated critical exponents that describe the percolation transition.
II The chimera topology
We consider nonplanar, effectively two-dimensional lattice graphs , consisting of a vertex set , containing vertices, and an edge set , containing undirected edges. The elementary building blocks of these graphs are subgraphs, i.e., complete bipartite graphs Essam and Fisher (1970); com (d) containing sites. These subgraphs can be partitioned into two vertex subsets and of size and have an edge set, consisting of all possible undirected edges with one terminal vertex in and one in .
To compose the full chimera graph with vertices, subgraphs are arranged on a grid. For horizontally (vertically) adjacent subgraphs and , and following an ordering of the vertices in the respective vertex subsets and , vertices out of () are joined to their respective mirror vertex in (). The particular choice with yields the canonical chimera graph. A topological representation of such a chimera graph with is shown in Fig. 1.
Subsequently, we consider chimera like graphs of size () up to () in order to perform a finite-size scaling analysis for different subgraph sizes and to determine the respective thresholds for bond, as well as site percolation. Note that there is a difference between the practical (small) graph sizes to which the D-Wave chip architecture is currently limited to (see Ref. com (a)), as opposed to large systems that, from a point of view of statistical physics, display a decent finite-size scaling behavior. Given that between 2011 and 2015 the number of sites increased from (Rainier chip, see Fig. 1) to (Washington chip) on the D-Wave device, we can expect com (e) to see chips of the order of sites studied in this work by 2019.
III Numerical details
For the numerical simulations we use the highly efficient algorithm by Newman and Ziff Newman and Ziff (2000, 2001) based on a union-find data structure Cormen et al. (2001). In particular, we implemented union by rank and path compression for the find-part of the bookkeeping procedure.
Within the bond-percolation study, one sweep of the algorithm goes as follows: First, a random permutation of the edges in the edge set of is obtained by means of a Fisher-Yates shuffle Cormen et al. (2001) [having algorithmic complexity with the number of edges]. Initially, each vertex is its own single-site cluster. Edges from the shuffled edge set are added one at a time and for each edge it is checked whether its incident vertices belong to different clusters. If this is the case, the respective clusters are merged using the union-by-rank approach. Once all edges have been probed, one lattice sweep is completed. We measure the size of the largest cluster and the average size of all finite clusters. Because of the previously described approach, these can be measured very efficiently with a resolution of . However, to keep the amount of raw data manageable, we consider only approximately values of in the vicinity of the critical point. Error bars are computed by averaging over sweeps for each system size studied.
Note that while the bond percolation variant of the algorithm only requires an edge list representing —i.e., the edge set of the underlying graph—the site percolation variant of the algorithm relies on an adjacency list of , i.e., a collection of lists of neighbors for each node Cormen et al. (2001).
| Type | ||||
|---|---|---|---|---|
| BP | 0.2943(1) | 1.34(2) | 0.146(8) | 2.42(2) |
| SP | 0.38722(7) | 1.34(3) | 0.145(5) | 2.41(2) |
IV Results
We illustrate our approach and data analysis in detail using a finite-size scaling analysis of the canonical -based chimera lattice. However, we have performed the same algorithm for all lattices with .
IV.1 Bond percolation on chimera graphs
The observables we consider can be rescaled following a generic scaling assumption, i.e.,
| (1) |
where and represent dimensionless critical exponents (or ratios thereof, see below), is the critical threshold, and denotes an unknown scaling function Stauffer and Aharony (1994); Binder and Heermann (2002). Following Eq. (1), data curves of the observable computed at different values of and fall on top of each other, if the scaling parameters , , and are chosen properly. The values of the scaling parameters that yield the best data collapse determine the numerical values of the critical point and the critical exponents that govern the behavior of the underlying observable .
To determine the optimal data collapse for a given set of data curves we perform a computer-assisted scaling analysis Melchert (2009); Sorge (2015). Here, the “quality” of the data collapse is measured by the mean-square distance of the data points to the master scaling curve , described by the scaling function, in units of the standard error of the data points Houdayer and Hartmann (2004). It is a quantitative measure for the quality of a data collapse that is far superior than the commonly used eyeballing scaling analysis. It is common practice to limit the analysis to the larger system sizes, for which corrections to scaling are less pronounced, and to discard small system sizes that are typically affected by stronger systematic corrections to scaling Binder and Heermann (2002). In general, systematic corrections to scaling result in a scaling behavior that deviates from that predicted by the scaling assumption, Eq. (1). Note that such corrections are not taken into account here. Furthermore, while can be influenced by potential corrections to scaling, it might not be interpreted as a measure for these corrections. Here, if not stated explicitly, the scaling analysis is limited to the three largest systems simulated.
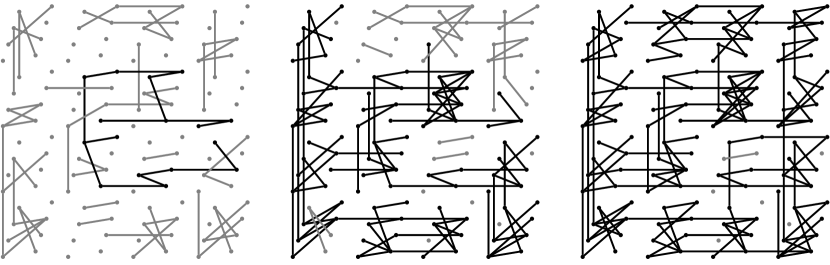
Example instances of bond-percolation configurations in the subcritical, critical, and supercritical regimes for chimera graphs with sites are shown in Fig. 2. The resulting numerical estimates of the critical percolation thresholds and corresponding critical exponents for bond and site percolation are listed in Table 1.
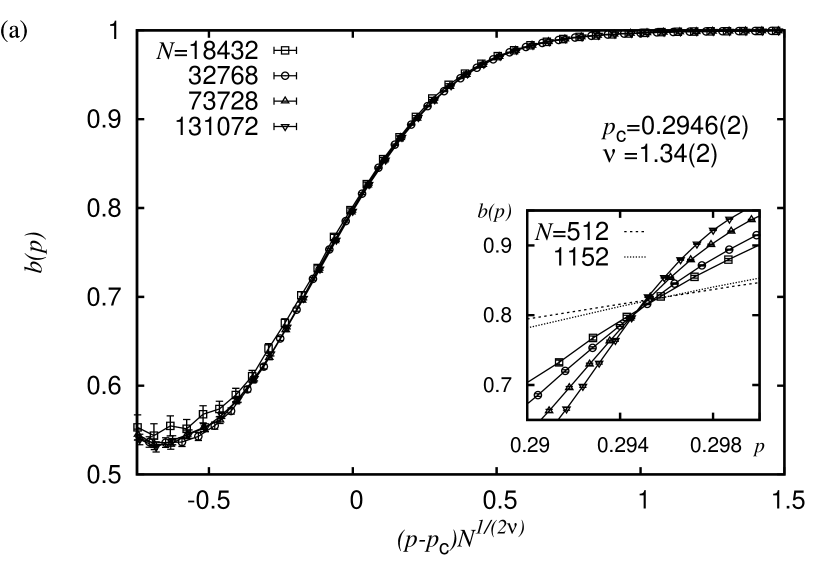
IV.1.1 Analysis of the Binder ratio
First we consider the relative size of the largest cluster of connected vertices . The dimensionless ratio, known as the Binder parameter Binder (1981b), is defined via
| (2) |
Here, represents an average over sweeps. Because the system-size-dependent part of the scaling function in Eq. (1) cancels out in the Binder ratio, it has a simple scaling form that follows Eq. (1) with . When the argument of the scaling function is zero and thus system-size independent. This means that data for different system sizes cross at [see inset to Fig. 3(a)]. Determining the correct thermodynamic values of and results in a data collapse, as can be seen in the main panel of Fig. 3(a). There are visible corrections to scaling in the nonpercolating phase, i.e., for . To account for this, the scaling analysis is performed in the interval on the rescaled axis to accentuate the region where scales well. Consequently, the best data collapse yields and with a quality of the data collapse com (f). Note that the numerical value of the correlation length exponent is in good agreement with , the standard value for percolation in two-dimensional lattices.
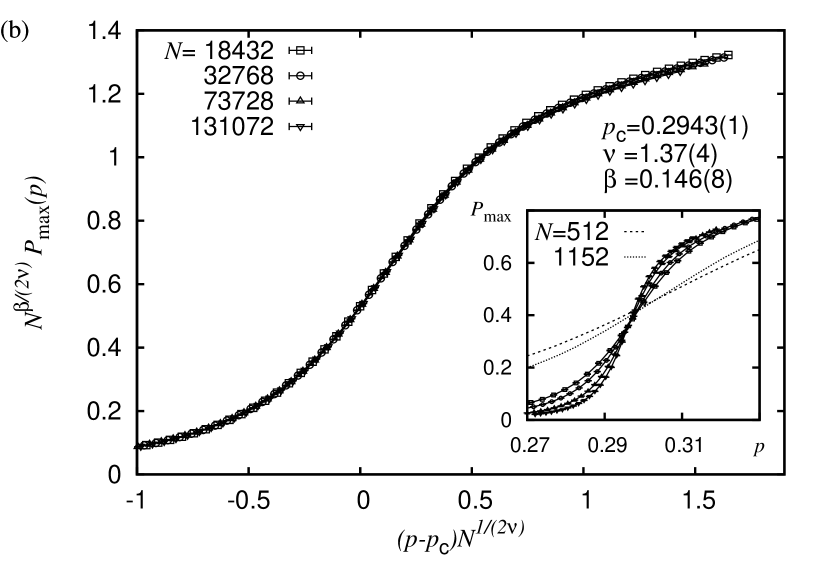
IV.1.2 Analysis of the order parameter
The scaling of the disorder-averaged order parameter
| (3) |
is expected to follow Eq. (1) with . Here, refers to the percolation strength exponent that governs the growth of the largest cluster with increasing system size at fixed . The best data collapse (obtained in the range ) yields , , and with a quality [see Fig. 3(b)]. If we fix the numerical values of the critical exponents to their exact values for two-dimensional percolation ( and ) we are left with only one adjustable parameter, resulting in the estimate with (expectedly worse) collapse quality . However, both numerical values are still in good agreement.
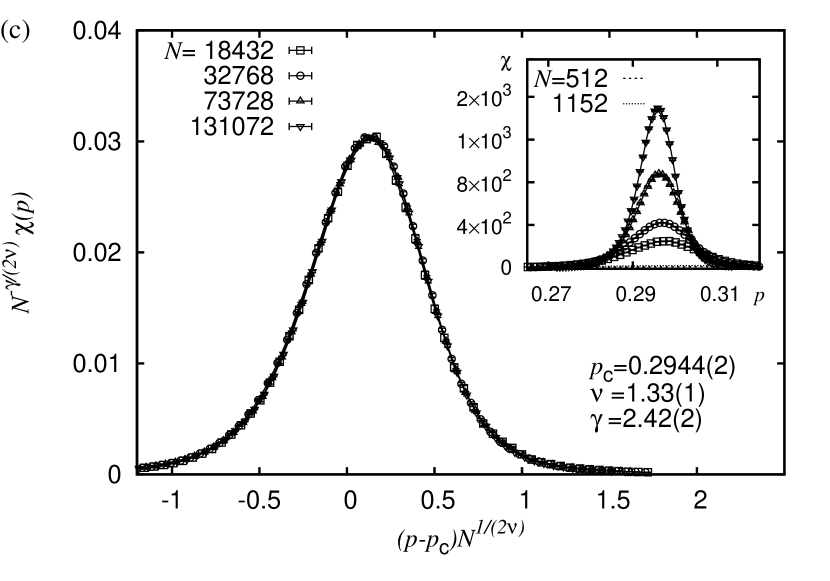
IV.1.3 Analysis of the order parameter fluctuations
A third critical exponent can be estimated from the scaling of the order parameter fluctuations , i.e.,
| (4) |
The fluctuations are expected to scale according to Eq. (1) allowing one to determine the fluctuation exponent through . Here, so as to perform the best possible data collapse, the nonsymmetric range is chosen. This is motivated by the observation that the peaks of the data curves are located in the superpercolating regime, with the precise location of the peaks approaching their asymptotic value from above. Hence the aforementioned asymmetric interval accentuates the region around the peaks, resulting in the estimates , , and with a quality [see Fig. 3(c) for a scaling collapse]. Note that the numerical value of the fluctuation exponent is in reasonable agreement with the expected exact value for two-dimensional percolation, namely, .
IV.2 Site percolation on chimera graphs
The analysis of the site-percolation problem is analogous to the analysis performed for bond percolation (Sec. IV.1). Note that, as discussed in Ref. Zhu et al. (2015), the location of the site-percolation threshold is pivotal for the efficient and correct performance of cluster algorithms designed to simulate spin-glass models in arbitrary space dimensions. In Ref. Zhu et al. (2015), the authors simulated chimera lattices with up to sites, and estimated the site-percolation threshold from the finite-size scaling of the Binder parameter, finding with .
We perform an analysis of the order parameter using systems of up to sites. By increasing the system sizes by approximately one order of magnitude in comparison to the study of Ref. Zhu et al. (2015) we are able to verify that the exponent is very likely in the two-dimensional percolation universality class. From an analysis of the Binder ratio we obtain , which, compared to the estimate of Ref. Zhu et al. (2015), turns out to be slightly larger.
Although the associated critical exponent is in good agreement with the two-dimensional percolation value, the data-collapse quality is rather large, reflecting that there are deviations from the expected scaling behavior, similar to the difficulties encountered in the analysis of bond percolation in Sec. IV.1.
To ensure that our analysis of the order parameter and its fluctuations is as precise as possible, we increased the number of samples studied to . Our estimates of the critical parameter for site percolation on the -based chimera lattice are , , (; ). Furthermore, the parameter estimates obtained from the order parameter fluctuations are , , and (; ). Note that both estimates of are in agreement with each other and in agreement with the Binder cumulant values estimated above. In both cases, the critical exponent is in agreement with the exact value of two-dimensional percolation and and are in reasonable agreement with their exact two-dimensional values (i.e., within two standard deviations). Despite the numerical values of and not matching the known values of two-dimensional (D) percolation exactly, we believe, based on the other exponents and our general expectations on this short-ranged percolation model, that the transition is actually of the universality class of D random percolation.
| (BP) | (SP) | |
|---|---|---|
| 2 | 0.44778(15) | 0.51294(7) |
| 3 | 0.35502(15) | 0.43760(15) |
| 4 | 0.29427(12) | 0.38675(7) |
| 5 | 0.25159(13) | 0.35115(13) |
| 6 | 0.21942(11) | 0.32232(13) |
| 7 | 0.19475(9) | 0.30052(14) |
| 8 | 0.17496(10) | 0.28103(11) |
IV.3 Percolation thresholds on generalized chimera graphs
For -based generalized chimera graphs one might intuitively expect that the percolation threshold is a decreasing function of the average vertex degree and thus of (however, note that counterexamples can be constructed Wierman (2002) on planar lattices). Here, we perform a finite-size scaling analysis for the disorder-averaged relative size of the largest cluster, i.e., the order parameter [Eq. (3)], to determine the thresholds for — (the standard chimera graph has ). Therefore, for each value of , we consider three system sizes with up to sites (the precise value of depends of the choice of , of course). Furthermore, we consider different permutations of the edge set or the vertex set for both bond and site percolation to compute . As can be seen in Fig. 4, the thresholds decrease with increasing and can be fit well by functions of the form . In this regard we find , and for bond percolation and for site percolation. For the bond-percolation variant one might further rephrase this scaling in terms of the number of internal edges, i.e., , to also find a scaling with a characteristic exponent . In either case, this suggests that in the asymptotic limit, as . The results of the finite-size scaling analysis are listed in Table 2 (the results for the canonical chimera lattice are again listed for ).
The quality of the data collapse is somewhat sensitive to the scaling interval chosen in the course of the analysis. For example, for the critical point for site percolation on the chimera graph we obtained estimates in the range (; ) to (; ). Generally, we expect that a narrower scaling interval —enclosing the critical point without extending too far into the off-critical region where deviations from the scaling behavior are expected—should lead to a more reliable estimate of . For example, for the given statistics (e.g., samples), restricting the scaling interval further to the range results in , , and (). The scaling exponents are also in agreement with the exact two-dimensional values. Increasing the statistics by a factor of to independent samples effectively allows us to add one digit of precision, i.e., (; ), a result that is in good agreement with an independent estimate by Ziff com (g).

What does this mean for architectures built from subgraphs? From a point of view of network robustness and vulnerability, increasing leads to a hardware topology that is less vulnerable to a random failure of qubits. For example, while the native D-Wave design with allows for a random failure of approximately of the qubits ( of the couplers) without losing large-scale connectivity, this value rises to about ( in the case of couplers) if the size of the elementary building blocks is scaled up only by a factor of to . Therefore, using topologies that have high connectivity or, for example, small-world properties Guclu et al. (2006) is key in designing quantum annealing machines robust to random failures of qubits and couplers.


IV.4 Small-world enhanced chimera graphs
We now discuss how to improve the stability of chimera like lattices by merely increasing the average degree by one via the addition of “small-world” (SW) bonds to the existing regular chimera graph. This results in a supergraph of , which we refer to as a small-world chimera graph (SWCG). Our aim is to determine the location of the site-percolation threshold for the ensemble of SWCGs and to assess the gain in network robustness. The additional SW bonds that make up an instance of a SWCG are obtained by the following three-step procedure: (i) generate a list of integers that represent the vertices of the (plain) chimera graph, (ii) obtain a random permutation of the list, and (iii) interpret subsequent pairs of integers as the end vertices of additional bonds that, in turn, are added to the initial graph. In doing so, the degree of each vertex increases by exactly one com (h). The resulting percolation thresholds can be expected to decrease with decreasing average degree, and, consequently the ensemble of SWCGs can be expected to be less vulnerable to random qubit failures. This is in agreement with the containment principle due to Fisher Fisher (1961), stating that if results from by removing a fraction of its bonds (i.e., being a spanning subgraph of ; see Ref. Essam and Fisher (1970)), then for both bond and site percolation.
For the SWCGs, it is anticipated that there is a scaling window around that has mean-field exponents. A proof of such scaling window exists on quasi-random graphs Nachmias (2009). Figure 5 illustrates a finite-size scaling analysis of the order parameter and its associated finite-size susceptibility for the site-percolation problem on SWCGs. In the vicinity of the critical point we expect the unscaled order parameter data to scale as
| (5) |
From the data corresponding to different system sizes, we obtain the system-size-dependent effective estimates and . From the effective critical points we extrapolate to the asymptotic critical point by fitting the data to
| (6) |
with , , and , as shown in the main plot of Fig. 5(a). Similarly, the sequence of exponents is fit well by
| (7) |
where , , and if the fit is restricted to systems of size . Upon successively excluding the smaller system sizes from the fit we find that the value of approaches the expected mean-field value Moore and Newman (2000). For example, restricting the analysis to yields , , and [see the inset of Fig. 5(a)]. Note that in the figure we fixed .
An additional estimate of the critical point can be obtained from the position of the peaks of the finite-size susceptibility . We have located the individual peak positions by fitting a polynomial of fifth order to the unscaled data curves. This is illustrated in Fig. 5(b), where the main plot shows the raw data with the respective fits and the inset shows the scaling behavior of the peak positions, where a fit to the function
| (8) |
yields , , and . The value of is in reasonable agreement with the above estimate based on the analysis of the order parameter. Furthermore, the numerical value of the critical point compares well with an estimate obtained using a data-collapse analysis (not shown).
Note that both estimates, and , are in reasonable agreement and are located significantly below the threshold value of the standard chimera graph. Consequently, SWCGs provide a topology that is significantly less vulnerable to random failures of qubits, i.e., while the standard chimera graph exhibits a fragmentation threshold and thus allows for a random failure of approximately of the qubits without losing large-scale connectivity, this value increases to for the ensemble of SWCGs. Finally, we note that the critical exponents for percolation on SWCGs assume mean-field values when small-world bonds are added, as demonstrated in the presented study.
Finally, note that chimera topologies are the archetypal architecture used in current quantum annealers. While, from a point of view of robustness, a fully connected topology would be desirable, a hardware implementation seems not possible at present. To be precise, only a finite number of fabrication layers for the chips are available. Having a fully connected graph would require layers, which is prohibitive for current chip designs with qubits. Given the flux qubit structure used in current quantum annealing machines, -like topologies might be used for multiple upcoming generations of these devices.
V Summary
We have performed numerical simulations to determine the bond- and site-percolation thresholds on nonplanar, effectively two-dimensional lattice graphs, where the elementary building blocks are complete bipartite subgraphs (). The simulations have been performed using a highly efficient percolation algorithm Newman and Ziff (2000, 2001) based on a union-find data structure Cormen et al. (2001). From a finite-size scaling analysis we have obtained the critical points and the three critical exponents , , and , thus locating the critical bond- and site-percolation thresholds and allowing us to verify that the transition is in the two-dimensional percolation universality class. In either case, the percolation threshold is a decreasing function of and our result suggests that in the asymptotic limit as .
The particular choice of is the canonical chimera graph, i.e., the hardware topology of the D-Wave quantum annealing device, developed at D-Wave Systems Inc. com (a). The native (no embedding required) benchmark (optimization) problem for the D-Wave device is an Ising spin glass Binder and Young (1986); Hartmann and Rieger (2001) and recently, much effort was put into the simulation of Ising spin glasses on the chimera topology Katzgraber et al. (2014); Weigel et al. (2015); Katzgraber et al. (2015). As discussed in Ref. Zhu et al. (2015), the location of the site-percolation threshold is crucial for the efficient and correct performance of cluster algorithms designed to simulate spin-glass models on, e.g., the above graph topology.
Finally, referring to the implementation of, e.g., the D-Wave chip and adopting the point of view of network robustness and vulnerability, the above results suggest that the native D-Wave design, as analyzed in Secs. IV.1 and IV.2, allows for a random failure of approximately of the qubits ( of the couplers) prior to losing large-scale connectivity on the chip. Similarly, embedded problems that turn off a sizable fraction of couplers randomly, might lead to loss of connectivity. Bear in mind that the above figures are valid in the asymptotic limit. In general, for finite-sized graphs of no more than sites, finite-size effects result in effective thresholds that differ slightly from the asymptotic values quoted in Table 2. To illustrate this, one might, e.g., define effective, system-size-dependent critical points from the peak locations of the finite-size fluctuations (see Sec. IV.1.3). In this regard, for bond (site) percolation on a lattice with sites we observe [], i.e., shifting towards smaller values as . Similarly, for , for bond percolation and for site percolation. Finally, for the largest system sizes studied in this work, for bond percolation and for site percolation. Although the asymptotic peaks seem to be located slightly above (within the superpercolating regime), this might nevertheless lead to expect that the finite-size values of for bond and site percolation for the chimera graph are within a interval of the asymptotic critical point.
In addition, we have found that by extending the plain -based chimera graph using small-world bonds—thereby effectively increasing the average vertex degree by one—the respective percolation threshold decreases to . Thus, small-world-extended chimera graphs provide a topology that allows for a random failure of approximately of the qubits before the large-scale connectivity of the device is lost. As pointed out earlier, using topologies that have higher connectivity, such as the above extended chimera graphs, might be key in designing quantum annealing machines robust to random failures of qubits and couplers.
Acknowledgements.
We would like to thank R. Ziff for sharing his estimates of with us, as well as fruitful discussions. O.M. thanks Zheng Zhu for valuable discussions and comments as well as for critically reading the manuscript. H.G.K. thanks Firas Hamze for comments and discussions and acknowledges support from the National Science Foundation (Grant No. DMR-1151387). The research of H.G.K. and O.M. is based in part upon work supported in part by the Office of the Director of National Intelligence (ODNI), Intelligence Advanced Research Projects Activity (IARPA), via MIT Lincoln Laboratory Air Force Contract No. FA8721-05-C-0002. The views and conclusions contained herein are those of the authors and should not be interpreted as necessarily representing the official policies or endorsements, either expressed or implied, of ODNI, IARPA, or the U.S. Government. The U.S. Government is authorized to reproduce and distribute reprints for Governmental purpose notwithstanding any copyright annotation thereon. M.A.N. is supported in part by a grant from Pacific Northwest National Laboratory (PNNL).References
- Broadbent and Hammersley (1957) S. R. Broadbent and J. M. Hammersley, Percolation processes. I. Crystals and Mazes, Proceedings of the Cambridge Philosophical Society 53, 629 (1957).
- Hammersley, J. M. (1957) Hammersley, J. M., Percolation Processes: Lower Bounds for the Critical Probability, Ann. Math. Statist. 28, 790 (1957).
- Hammersley (1957) J. M. Hammersley, Percolation processes. II. The connective constant, Proceedings of the Cambridge Philosophical Society 53, 642 (1957).
- Fisher (1961) M. E. Fisher, Critical Probabilities for Cluster Size and Percolation Problems, J. Math. Phys. 2, 620 (1961).
- Bunde et al. (1991) A. Bunde, P. Maass, and M. D. Ingram, Diffusion Limited Percolation: A Model for Transport in Ionic Glasses, Berichte der Bunsengesellschaft für physikalische Chemie 95, 977 (1991).
- Pfeiffer and Rieger (2002) F. O. Pfeiffer and H. Rieger, Superconductor-to-normal phase transition in a vortex glass model: numerical evidence for a new percolation universality class, J. Phys. Cond. Mat. 14, 2361 (2002).
- Pfeiffer and Rieger (2003) F. O. Pfeiffer and H. Rieger, Critical properties of loop percolation models with optimization constraints, Phys. Rev. E 67, 056113 (2003).
- Stauffer (1979) D. Stauffer, Scaling theory of percolation clusters, Phys. Rep. 54, 1 (1979).
- Stauffer and Aharony (1994) D. Stauffer and A. Aharony, Introduction to Percolation Theory (Taylor and Francis, London, 1994).
- Essam and Fisher (1970) J. W. Essam and M. E. Fisher, Some Basic Definitions in Graph Theory, Rev. Mod. Phys. 42, 271 (1970).
- Yeomans (1992) J. M. Yeomans, Statistical Mechanics of Phase Transitions (Oxford University Press, Oxford, 1992).
- Becker and Ziff (2009) A. M. Becker and R. M. Ziff, Percolation thresholds on two-dimensional Voronoi networks and Delaunay triangulations, Phys. Rev. E 80, 041101 (2009).
- Saberi (2015) A. A. Saberi, Recent advances in percolation theory and its applications, Physics Reports 578, 1 (2015).
- Newman et al. (2001) M. E. J. Newman, S. H. Strogatz, and D. J. Watts, Random graphs with arbitrary degree distributions and their applications, Phys. Rev. E 64, 026118 (2001).
- Callaway et al. (2000) D. S. Callaway, M. E. J. Newman, S. H. Strogatz, and D. J. Watts, Network Robustness and Fragility: Percolation on Random Graphs, Phys. Rev. Lett. 85, 5468 (2000).
- Cormen et al. (2001) T. H. Cormen, C. E. Leiserson, R. L. Rivest, and C. Stein, Introduction to Algorithms, 2nd edition (MIT Press, Cambridge, MA, 2001).
- Newman and Ziff (2000) M. E. J. Newman and R. Ziff, Efficient Monte Carlo Algorithm and High-Precision Results for Percolation, Phys. Rev. Lett. 85, 4104 (2000).
- Newman and Ziff (2001) M. E. J. Newman and R. Ziff, Fast Monte Carlo algorithm for site or bond percolation, Phys. Rev. E 64, 016706 (2001).
- Mertens and Moore (2012) S. Mertens and C. Moore, Continuum percolation thresholds in two dimensions, Phys. Rev. E 86, 061109 (2012).
- Bunyk et al. (2014) P. Bunyk, E. Hoskinson, M. W. Johnson, E. Tolkacheva, F. Altomare, A. J. Berkley, R. Harris, J. P. Hilton, T. Lanting, and J. Whittaker, Architectural Considerations in the Design of a Superconducting Quantum Annealing Processor, IEEE Trans. Appl. Supercond. 24, 1 (2014).
- com (a) URL http://www.dwavesys.com.
- Bian et al. (2014) Z. Bian, F. Chudak, R. Israel, B. Lackey, W. G. Macready, and A. Roy, Discrete optimization using Quantum Annealing on sparse Ising models, Frontiers in Physics 2 (2014).
- Klymko et al. (2014) C. Klymko, B. D. Sullivan, and T. S. Humble, Adiabatic quantum programming: minor embedding with hard faults, Quant. Inf. Proc. 13, 709 (2014).
- Albert et al. (2000) R. Albert, H. Jeong, and A. Barabási, Error and attack tolerance of complex networks, Nature 406, 378 (2000).
- com (b) Note that in Ref. Vinci et al. (2015) the percolation properties of a two-level-grid minor embedded into chimera were studied within the context of quantum annealing corrections.
- com (c) Within this context, native refers to a problem that uses all physical qubits on the chip as logical qubits. An embedded problem, for example, might require multiple physical qubits to encode one logical qubit or interaction between two qubits that are not nearest neighbors on the lattice.
- Binder and Young (1986) K. Binder and A. P. Young, Spin Glasses: Experimental Facts, Theoretical Concepts and Open Questions, Rev. Mod. Phys. 58, 801 (1986).
- Stein and Newman (2013) D. L. Stein and C. M. Newman, Spin Glasses and Complexity, Primers in Complex Systems (Princeton University Press, 2013).
- Katzgraber et al. (2014) H. G. Katzgraber, F. Hamze, and R. S. Andrist, Glassy Chimeras Could Be Blind to Quantum Speedup: Designing Better Benchmarks for Quantum Annealing Machines, Phys. Rev. X 4, 021008 (2014).
- Katzgraber et al. (2015) H. G. Katzgraber, F. Hamze, Z. Zhu, A. J. Ochoa, and H. Munoz-Bauza, Seeking Quantum Speedup Through Spin Glasses: The Good, the Bad, and the Ugly, Phys. Rev. X 5, 031026 (2015).
- Zhu et al. (2015) Z. Zhu, A. J. Ochoa, and H. G. Katzgraber, Efficient Cluster Algorithm for Spin Glasses in Any Space Dimension, Phys. Rev. Lett. 115, 077201 (2015).
- Hen et al. (2015) I. Hen, J. Job, T. Albash, T. F. Rønnow, M. Troyer, and D. A. Lidar, Probing for quantum speedup in spin-glass problems with planted solutions, Phys. Rev. A 92, 042325 (2015).
- King (2015) A. D. King, Performance of a quantum annealer on range-limited constraint satisfaction problems (2015), arXiv:1502.02098.
- hal (2015) A Study of Spanning Trees on a D-Wave Quantum Computer, Physics Procedia 68, 56 (2015).
- Boixo et al. (2014) S. Boixo, T. F. Rønnow, S. V. Isakov, Z. Wang, D. Wecker, D. A. Lidar, J. M. Martinis, and M. Troyer, Evidence for quantum annealing with more than one hundred qubits, Nat. Phys, 10, 218 (2014).
- Binder (1981a) K. Binder, Critical properties from Monte Carlo coarse graining and renormalization, Phys. Rev. Lett. 47, 693 (1981a).
- com (d) Note that in Ref. Essam and Fisher (1970) these bipartite graphs are referred to as “bichromatic.”.
- com (e) Needless to mention, the expectation that the current chip topology will scale to hundreds of thousands of qubits requires an unhealthily large amount of wishful thinking. This estimate does not take into account, for example, fabrication limitations, or the effects of qubit noise that are amplified the more qubits are added to the system Zhu et al. (2016); Perdomo-Ortiz et al. (2015a, b).
- Binder and Heermann (2002) K. Binder and D. W. Heermann, Monte Carlo simulation in statistical physics: an introduction (4th ed.) (Springer (Springer series in solid-state science), 2002).
- Melchert (2009) O. Melchert, autoScale.py - A program for automatic finite-size scaling analyses: A user’s guide, Preprint: arXiv:0910.5403v1 (2009), the source-code of autoScale.py and the raw-data for an illustrative example can be downloaded toghether with the source-files of the preprint at http://arxiv.org/abs/0910.5403 by choosing the download-option Other formats.
- Sorge (2015) A. Sorge, pyfssa: v0.2.0 (2015), pyfssa is a scientific Python package for algorithmic finite-size scaling analysis at phase transitions.
- Houdayer and Hartmann (2004) J. Houdayer and A. K. Hartmann, Low temperature behavior of two-dimensional Gaussian Ising spin glasses, Phys. Rev. B 70, 014418 (2004).
- Binder (1981b) K. Binder, Finite size scaling analysis of Ising model block distribution functions, Z. Phys. B 43, 119 (1981b).
- com (f) The numerical value of measures the mean-square distance of the data points to the master scaling curve described by the scaling function, in units of the standard error Houdayer and Hartmann (2004).
- Wierman (2002) J. C. Wierman, Percolation threshold is not a decreasing function of the average coordination number, Phys. Rev. E 66, 046125 (2002).
- com (g) R. Ziff (private communication) drew our attention to his independent estimates of (bond percolation) and (site percolation) on the chimera lattice, consistent with the values quoted in Table 2.
- Guclu et al. (2006) H. Guclu, G. Korniss, M. A. Novotny, Z. Toroczkai, and Z. Rácz, Synchronization landscapes in small-world-connected computer networks, Phys. Rev. E 73, 066115 (2006).
- com (h) If is odd, one qubit does not have a small-world bond.
- Nachmias (2009) A. Nachmias, Mean-field conditions for percolation on finite graphs, Geometric and Functional Analysis 19, 1171 (2009).
- Moore and Newman (2000) C. Moore and M. E. J. Newman, Exact solution of site and bond percolation on small-world networks, Phys. Rev. E 62, 7059 (2000).
- Hartmann and Rieger (2001) A. K. Hartmann and H. Rieger, Optimization Algorithms in Physics (Wiley-VCH, Berlin, 2001).
- Weigel et al. (2015) M. Weigel, H. G. Katzgraber, J. Machta, F. Hamze, R. S. Andrist, and Octomore Collaboration, Erratum: Glassy Chimeras could be blind to quantum speedup: Designing better benchmarks for quantum annealing machines [Phys. Rev. X 4, 021008 (2014)], Phys. Rev. X 5, 019901 (2015).
- Vinci et al. (2015) W. Vinci, T. Albash, G. Paz-Silva, I. Hen, and D. A. Lidar, Quantum annealing correction with minor embedding, Phys. Rev. A 92, 042310 (2015).
- Zhu et al. (2016) Z. Zhu, A. J. Ochoa, F. Hamze, S. Schnabel, and H. G. Katzgraber, Best-case performance of quantum annealers on native spin-glass benchmarks: How chaos can affect success probabilities, Phys. Rev. A 93, 012317 (2016).
- Perdomo-Ortiz et al. (2015a) A. Perdomo-Ortiz, B. O’Gorman, J. Fluegemann, R. Biswas, and V. N. Smelyanskiy, Determination and correction of persistent biases in quantum annealers (2015a), (arXiv:quant-phys/1503.05679).
- Perdomo-Ortiz et al. (2015b) A. Perdomo-Ortiz, J. Fluegemann, R. Biswas, and V. N. Smelyanskiy, A Performance Estimator for Quantum Annealers: Gauge selection and Parameter Setting (2015b), (arXiv:quant-phys/1503.01083).