A search for hyperluminous X-ray sources in the XMM-Newton source catalog
Abstract
We present a new method to identify luminous off-nuclear X-ray sources in the outskirts of galaxies from large public redshift surveys, distinguishing them from foreground and background interlopers. Using the 3XMM-DR5 catalog of X-ray sources and the SDSS DR12 spectroscopic sample of galaxies, with the help of this off-nuclear cross-matching technique, we selected 98 sources with inferred X-ray luminosities in the range , compatible with hyperluminous X-ray objects (HLX). To validate the method, we verify that it allowed us to recover known HLX candidates such as ESO 24349 HLX1 and M82 X1. From a statistical study, we conservatively estimate that up to of these sources may be fore- or background sources, statistically leaving at least 16 that are likely to be HLXs, thus providing support for the existence of the HLX population. We identify two good HLX candidates and using other publicly available datasets, in particular the VLA FIRST in radio, UKIDSS in the near-infrared, GALEX in the ultra-violet and CFHT Megacam archive in the optical, we present evidence that these objects are unlikely to be foreground or background X-ray objects of conventional types, e.g. active galactic nuclei, BL Lac objects, Galactic X-ray binaries or nearby stars. However, additional dedicated X-ray and optical observations are needed to confirm their association with the assumed host galaxies and thus secure their HLX classification.
1 Introduction
Intermediate mass black holes (IMBHs) are a class of black holes (BHs) with masses greater than standard stellar mass black holes (StMBHs), but smaller than the supermassive black holes (SMBHs) that reside in the centers of galaxies, with attributed mass of . The masses of StMBHs are expected theoretically to span a range between roughly and (Fryer & Kalogera, 2001). These StMBHs are the end points of stellar evolution for sufficiently massive stars formed out of metal enriched gas. At low metallicities, much more massive stars and black holes may be formed (see, e.g., Belczynski et al., 2010, and references therein). Indeed it has been suggested that zero metallicity stars can form with masses of , and produce primordial IMBH seeds directly as a result of stellar evolution (Heger et al., 2003). Following processes of growth and assembly of SMBHs from these primordial seeds in a hierarchical structure formation scenario inevitably results in a population of IMBHs wandering in galaxy halos at the present epoch, with an occurrence rate of approximately 100 IMBHs per Milky Way-sized halo (see e.g. Volonteri & Perna, 2005, and references therein).
Ultraluminous X-ray sources (ULXs), non-nuclear X-ray sources accreting above the Eddington limit for a StMBH (), have long been proposed as candidate IMBHs (see Feng & Soria, 2011, for a review). Recent studies (see, e.g., Sutton et al., 2013; Bachetti et al., 2013; Walton et al., 2013, and references therein) have shown that the emission of most ULXs with luminosities up to may be explained by super-Eddington accretion onto quite massive StMBHs (). So far only one accreting IMBH candidate, ESO 24349 HLX1, has been reliably identified (Farrell et al., 2009). Discovered serendipitously as a bright and variable X-ray source with maximum unabsorbed X-ray luminosity in the 0.2–10 keV band , it resides in an edge-on spiral galaxy some 95 Mpc away. It is believed to be an accreting IMBH (Servillat et al., 2011; Davis et al., 2011; Godet et al., 2012; Webb et al., 2012) with a stellar companion on a 1 yr eccentric orbit (Lasota et al. (2011), but see Godet et al. (2014)), embedded in a young stellar system, e.g. open cluster (Farrell et al., 2012).
Currently, many research teams are pursuing the search of other candidate IMBH sources similar to ESO 24349 HLX1. There are two main types of search strategy used: (1) exploring the luminous tail of the ULX luminosity distribution (e.g. Sutton et al., 2012), and (2) studying the low mass end of SMBH mass distribution by using various scaling relations in dwarf galaxies (e.g. Greene & Ho, 2004). The first class of searches is usually based on ULX catalogs such as Liu & Mirabel (2005) and Walton et al. (2011). Although they provide a meaningful list of sources for deeper studies, they are however limited by the narrow selection of ULX host galaxies, where for example ULXs are sought using a cross-match between the XMM-Newton source catalog and nearby galaxy catalogs, i.e. the Third Reference Catalogue of Bright Galaxies (RC3) (de Vaucouleurs et al., 1991) containing galaxies. The RC3 is well covered by X-ray observations and hence is a good input catalog for ULX searches. But for our purposes it contains a limited total solid angle and limited search volume (especially important for such rare objects as accreting IMBHs) compared to modern large galaxy surveys.
To overcome these limitations we propose an extended approach to select HLX candidates: we cross-correlate the XMM-Newton source catalog (Rosen et al., 2015) with one of the largest available galaxy redshift surveys, the Sloan Digital Sky Survey Data Release 12 (Alam et al., 2015) containing data on more than 3 million galaxies with known distances, using a special match condition. We then apply several filter criteria to discard most of the known contaminating object classes based on their broadband spectral energy distribution (SED) properties and X-ray spectral features. In this paper we present this search method and a selection of 2 candidate HLXs representing a snapshot of its early results.
The paper is organised as follows. In Section 2 we describe our selection methodology and how we address the most important issues of foreground and background contamination of the candidate sample with conventional object classes such as AGN, stars, etc. In Section 3 we present the details of data analysis. In Section 4 we present 2 candidates and their observed properties. Section 5 is devoted to the discussion on the candidates. We give our conclusions in Section 6.
2 Sample selection
The goal of this study is to find extragalactic off-nuclear X-ray sources in the HLX X-ray luminosity range , similar to ESO 24349 HLX1. This source is observed as a point X-ray object 8″ away from the nucleus of the host spiral galaxy and it exhibits spectral states similar to accreting StMBH: a soft power-law with index of around 3 observed once and tentatively classified as the very high state, a harder power-law with a slope =2.2 and a blackbody disk component with temperature keV in the high soft state, and a simple hard power-law with a power-law index in the range 1.4–2.1 in the low hard state (Godet et al., 2009; Servillat et al., 2011; Godet et al., 2012). Its observed luminosity changes by almost two orders of magnitude between the low and the high states, from to in the 0.2–10 keV band.
The observed properties of ESO 24349 HLX1 define our main search criteria: we look for X-ray sources in the outskirts of galaxies whose distance is known, in order to be able to convert the observed flux to an estimate of the X-ray luminosity. At the same time we apply a luminosity filter and select X-ray sources with inferred luminosities in the range , which translates to the mass of few hundred to few for a black hole accreting at the Eddington limit. We do not impose, however, any constraints on X-ray spectrum or variability of selected X-ray sources because it is uncertain if these properties are unique for ESO 24349 HLX1 or not.
In this study we chose to work with the XMM-Newton source catalog as an input list of X-ray sources mainly because whilst XMM-Newton has only fair spatial resolution with half energy width of 15″, it has excellent sensitivity over a large field of view and a broad energy range. We used its recent release 3XMM-DR5 (Rosen et al., 2015) which is the largest existing catalog of X-ray sources available publicly.
Throughout the paper we refer to source properties as they are given in the official distributed 3XMM-DR5 catalog files. As the first step of our selection procedure we applied a filter to the 3XMM-DR5 sources. We selected only point sources (those with SC_EXT_ML = 0 in the catalog) with a detection significance of more than 8 (SC_DET_ML ), which corresponds to a detection significance of in order to discard spurious objects. Point source tag in the catalog is set when an attempt to fit PSF convolved with -model for extended objects results in an extent parameter of less than 6″111More details on this procedure is available in the XMM-Newton catalog pipeline documentation at http://xmmssc-www.star.le.ac.uk/Catalogue/2XMM/SSC-AIP-TN-003.ps. This filter yielded 309,327 sources out of an initial list of 396,910 unique sources contained in the catalog.
Then we performed an off-nuclear cross-match (see Fig. 1 for the illustration of its concepts) of the X-ray source list with the spectroscopic sample of the SDSS DR12 catalog (Alam et al., 2015).
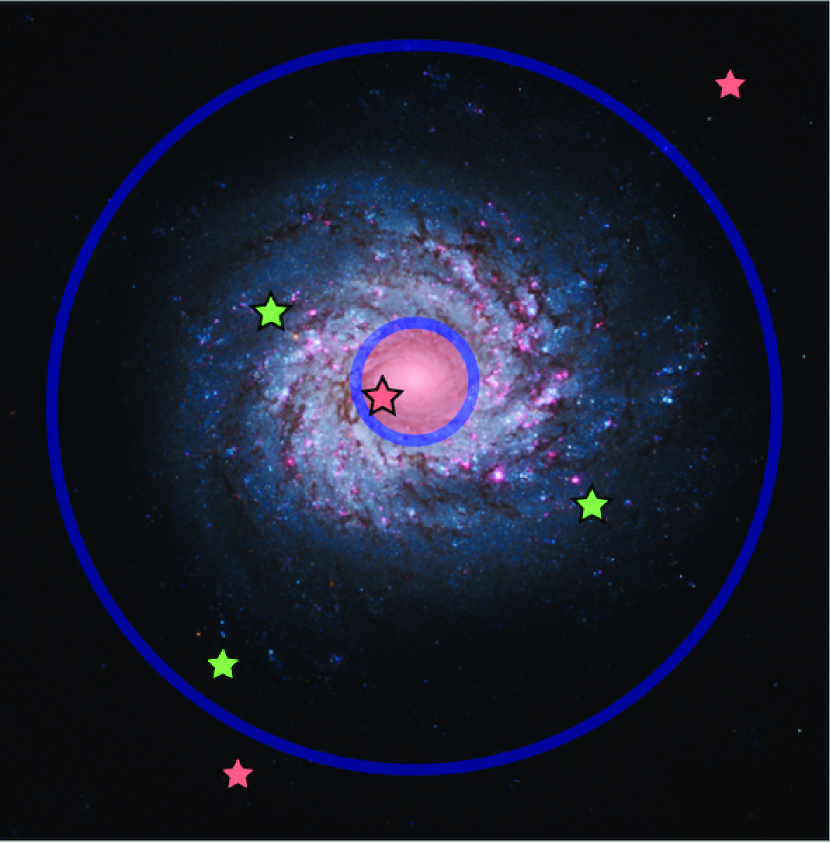
An X-ray source was considered for further analysis if its angular distance from the center of a galaxy was between the inner radius and outer radius calculated individually for each potential galaxy/X-ray source pair. The inner radius was used to exclude X-ray sources that were too close to the galaxy nucleus, as it would not be possible to distinguish them from an AGN or to exclude contamination from it. If SC_POSERR is the position error of the X-ray source (its median value in our catalog sample is 1.4″), we chose this radius to be 3 * SC_POSERR but not less than 5″. This minimum limit was chosen after Walton et al. (2011) reasoning with the correction that the overall 3XMM-DR5 astrometry precision is significantly better than the one of 2XMMi-DR3 used by them (Rosen et al., 2015).
The outer radius was chosen in order to have a reasonable chance that the source was associated with the galaxy and not be a background/foreground source. We used an outer radius of 2 * petroRad_r + 3 * SC_POSERR where petroRad_r is the modified Petrosian radius (Petrosian, 1976) of a galaxy in the band adopted in the SDSS. The Petrosian radius is defined using the shape of the azimuthally averaged light profile and SDSS uses 2 Petrosian radii to recover all the flux of a galaxy (petroMag). We use the Petrosian radius in this study instead of the isophotal diameter (e.g. given for galaxies from the RC3 catalog) which is more common for ULX searches, because it provides more uniform galaxy flux and extent measures across possible galaxy brightness profiles, independently from brightness profile fits.
It is not easy in general to characterise the ratio between the Petrosian radius and the as it depends on the brightness profile of a galaxy, but in some samples Petrosian diameters are generally found to be smaller than the projected major axis of a galaxy at the 25 mag arcsec-2 isophotal level.
As a result of the off-nuclear cross-match we obtained a list of X-ray source/galaxy pairs. Therefore, we were able to compute the X-ray luminosity of each source under the assumption that it was associated with the matched galaxy with known distance. Having done this, we then selected only those X-ray sources that satisfied our luminosity criterion to be considered as HLX candidates: . At this step we also restricted our study to the objects with distances less than 800 Mpc which corresponds to the limiting sensitivity of the XMM-Newton for objects with luminosity at the fainter end of the studied range. This intermediate list had 373 objects.
Obviously, by construction the selected intermediate sample was prone to contain superpositions of either background or foreground X-ray objects onto optical galaxies. Since we are interested only in candidate hyperluminous X-ray sources, throughout this paper we refer to the conventional types of sources (which are not associated with the matched galaxies as we assume by default) such as active galactic nuclei (AGN), X-ray active stars, cataclysmic variables (CVs), etc, as contaminants. Main contaminant object types can be background AGN, background BL Lac objects, background starburst galaxies, Galactic foreground compact objects, Galactic foreground stars.
We tried to address the problem of cleaning our HLX candidates from the contaminants by using broadband spectral energy distribution (SED) properties of different object types, in particular the X-ray-to-optical flux ratio . To compute it we use the X-ray flux in the standard XMM-Newton catalog band 0.2–12 keV and the optical flux in the SDSS band throughout this paper. We note that ratios from the literature are highly inhomogeneous with respect to the actual bands used and further in the paper we either tried to bring them to the same reference system or indicate that the estimate is uncertain. The X-ray-to-optical flux ratio of ESO 24349 HLX1 is usually large, around 100, judging from optical and X-ray data from Webb et al. (2014), though the amplitude of its variability is a factor of in the X-ray and a factor of several in the optical. For ULXs typical values are (Tao et al., 2011). The most common contaminating object types, AGN and foreground stars, have instead low X-ray-to-optical flux ratios: it is rarely more than 10 for AGN and always less than 0.1 for stars (Lin et al., 2012). However, distant obscured AGN can reach extreme X-ray-to-optical flux ratios of and much more (Mignoli et al., 2004; Bauer et al., 2004). This population of objects with extreme values starts to emerge at fluxes roughly below few (e.g. Comastri et al. (2002), see also fig. 7 of Bauer et al. (2004), fig. 1 of Mignoli et al. (2004)). To minimize their contamination we imposed X-ray flux limit of for our intermediate selection which gave us the list of 98 HLX candidates we later refer to as the base sample.
The full details of our filtering and cross-match method described to this point, including the exact queries we used to construct our samples, are given in the Appendix A. The intermediate and base tables of our HLX candidates can be easily obtained from the SDSS CasJobs service with these queries.
2.1 Estimate of contaminating sources contribution
It is possible to estimate the contribution of unknown contaminants to our base sample. We follow the procedure described by Walton et al. (2011) with minor modification: we do not account for non-uniform sensitivity of the XMM-Newton observations which would only decrease more realistic contamination estimate. Hence we present here its upper limit. In total there are 33,879 extragalactic objects from the SDSS DR12 spectroscopic sample which were observed in the 3XMM-DR5 catalog set of observations and were fed as an input to our off-nuclear cross-match method. To summarize, these are galaxies with distance less than 800 Mpc and Petrosian radius larger than 2.5 arcsec – the later would have zero area after applying our off-nuclear criterion. The footprint of 3XMM-DR5 observations is defined by its preliminary multi-order coverage (MOC) map computed from the combined images222Available from http://xmm-catalog.irap.omp.eu/links.. This is the simplest footprint estimate available so far and it does not take into account exposure maps and variable observation sensitivity, so the number of SDSS galaxies inside it may be considered as an upper limit on number of galaxies which we inspected with our off-nuclear cross-match technique. In the same way as Walton et al. (2011) for each individual galaxy falling in the 3XMM-DR5 footprint we then compute the number of contaminating sources in its solid angle (with the nuclear region subtracted) using the log N – log S relation for resolved X-ray background sources in the hard (2–10 keV) X-ray band from Moretti et al. (2003). We use the following formula to compute individual sensitivity limit for each galaxy:
| (1) |
in , where is a factor from Walton et al. (2011) to account for the average fraction of the flux observed in the hard band (2–12 keV) compared to the full XMM-Newton 0.2–12 keV band for an assumed background source spectrum, is the minimum X-ray flux limit we adopted when constructing our sample, is the lower limit of our search luminosity range, is luminosity distance computed from galaxy redshift using standard cosmology adopted by the SDSS CasJobs service. This individual limiting sensitivity value is then subsituted to log N – log S expression from Moretti et al. (2003) to get a number of expected background sources above this sensitivity in the searched area of a given galaxy. We do not expect any major corrections to our contamination estimate due to the slight differences in energy range between the hard band of Moretti et al. (2003) and that of the XMM-Newton.
Finally, after summing individual values of number of background sources computed for each galaxy sensitivity limit and solid angle we get total value of contaminants we expect to have in our sample of 98 sources. The quoted uncertainty corresponds to the 15 per cent uncertainty of the hard band number counts from Moretti et al. (2003).
Moretti et al. (2003) used several wide-field and pencil-beam X-ray surveys to compute their log N – log S relation. They performed a detailed comparison of their results with the literature and found that their cosmic X-ray background (CXB) model agrees with other studies within the uncertainties, i.e. there is no evidence that their study is biased due to the cosmic variance or other reasons. Nevertheless we verify our contamination estimate using other published log N – log S functions. We note that Moretti et al. (2003) function provides systematically larger source number counts than that of Chandra-COSMOS and XMM-COSMOS surveys (Elvis et al., 2009, see fig. 9) and therefore our contaminants estimate would only be lower based on these log N – log S data. Georgakakis et al. (2008) combined several surveys such as CDF-N, CDF-S, EGS and XBOOTES to derive soft (0.5–2.0 keV), hard (2–10 keV) and total (0.5–10 keV) band log N – log S relations. Using hard band log N – log S from Georgakakis et al. (2008) (i.e. setting in Equation 1 as above) yields 59 contaminants in our sample. With their total band relation (also setting in Equation 1) one gets 73 contaminants. Both methods agree with Moretti et al. (2003) in a statistical sense and we shall use its results throughout this paper.
With this simple approach we do not take into account CCD chips gaps and searched galaxies area overlap both reducing the total solid angle of our survey and the flux extinction that will be suffered by background sources due to the gas and dust in the galaxies these sources are falsely associated with. Probably more important, we do not correct for the varying sensitivity of observations like Walton et al. (2011) did because for the very recent release of 3XMM-DR5 catalog there is no upper limit server available yet to the community like Flix333www.ledas.ac.uk/flix/flix3.html which is available for older catalog releases. It is clear that all the effects above and the shallow X-ray observations of a fraction of 33,879 input galaxies with detection limits above our estimates for them would only decrease our contamination estimate, so fractional contamination of per cent should be considered as a conservative upper limit.
2.2 Final sample
Upper limit for fractional contamination of 72 per cent allows us to expect that in our base sample of 98 objects at least few are good HLX candidates. Ideally, one needs to obtain spectroscopy to confirm that the distances to the candidate HLXs are indeed those of the supposed host galaxies. However, getting such a confirmation for all 98 objects is very expensive observationally, so in this paper we present a smaller subset of the HLX candidates for which we find evidence in the public data available through the Virtual Observatory (VO) that their observed properties differ from those of the main contaminating object type, AGN.
We use several criteria based on the SED analysis of the objects from our base sample. As we mentioned earlier, we limited our selection to the sources with to filter out population of AGN with extreme X-ray-to-optical flux ratios. However, not only distant intrinsically obscured AGN below this flux level have high X-ray-to-optical ratios. Conventional AGN with intrinsic seen through significant absorption material (e.g. through a foreground galaxy) can have very large observed X-ray-to-optical flux ratio. An example of such case is a bright ULX candidate with observed discovered by Miniutti et al. (2006) which was later proved by Dadina et al. (2013) to be background absorbed AGN with intrinsic . More recently, Sutton et al. (2015) has obtained optical spectrum of another HLX candidate 2XMM J134404.1271410 with which turned out to be quasar at redshift seen through nearby galaxy IC 4320. At the same time there are a several ULXs known to have values of because e.g. they are embedded in optically bright HII regions in their host galaxy or show significant variability (Tao et al., 2011; Heida et al., 2013).
One possible way out from this significant overlap of of AGN and compact accreting objetcs is to compare X-ray and near-infrared (NIR) fluxes as NIR is less sensitive to the line of sight absorption than optical light. Below we refer to the flux in the band as to the NIR flux. It is easy to estimate that a line of sight absorption of cm-2 with normal gas-to-dust ratio for a typical AGN increases its intrinsic X-ray-to-optical flux ratio by a factor of , whereas for it is only a factor of 1.05. Moreover, extreme X-ray-to-optical flux ratio objects such as EROs (extremely red objects) have very decent while showing X-ray-to-optical flux ratios of hundreds and even thousands (Mignoli et al., 2004). In the sample of ULX candidates observed in the NIR by Heida et al. (2014) AGN seen through the foreground galaxies possess moderate while ULXs have such a ratio greater than for e.g. XMMU J024323.5+372038 in NGC 1058 and RX J004722.4-252051 in NGC 253 to for Holmberg II X1.
Based on these considerations we decided to start studying our base sample from sources that could satisfy or criteria based on data existing in the Virtual Observatory without obtaining new observations. We note however, that sources from our base sample which do not satisfy these criteria are still worth further investigation.
As the first step of this selection of optically/NIR quiet objects, we apply the following criterion based on the SDSS data. The non-detection of an optical source within the 3 X-ray error circle up to the limit of the SDSS (22.2 AB mag in band ), gives one lower limit on this ratio for the minimum X-ray flux of our sample ( in the standard XMM-Newton energy band 0.2–12 keV). We hence filtered from the base sample those sources that have an optical object in the SDSS DR12 photometric database within their X-ray positional uncertainty (61 objects). These sources with optical counterparts thus having are likely to be reasonably distant AGN that dominate the resolved X-ray background at fluxes . We note that their number is in good agreement with our contamination estimate. This test passage left 37 optically faint sources for further inspection. Known HLX candidates such as ESO 24349 HLX1 and M82 X1 are not included in this sample due to incompleteness of the optical redshift survey we used i.e. SDSS DR12 does not cover the full sky. When testing this method using other redshift databases such as HyperLEDA in the input, we were able to recover these HLX candidates. New HLX candidates from other redshift databases will be presented in the future papers.
To strengthen obtained limit we queried the archive of the Canadian Astronomical Data Centre (CADC) which hosts deep imaging data from the Hubble Space Telescope, CFHT Megacam and WIRCam and other instruments. We used Virtual Observatory’s Table Access Protocol (Dowler et al., 2011) service at the CADC to find and retreive cut out images of 5 out of 37 objects from the subset above. We then analysed their deep optical images. For one object (XMM1226+12, see below) we find evidence that it satisfies chosen constraint . Other 4 objects either have relatively bright optical counterparts and , or do not have optical counterparts but project on diffuse host galaxy light which only allows us to obtain insufficiently strict lower limit of . Nevertheless, we found it reasonable to start observational campaign to follow up these candidates at optical/NIR wavelengths in order to obtain decisive evidence on association of X-ray sources counterparts with assumed host galaxies and/or improve and constraints available from the Virtual Observatory.
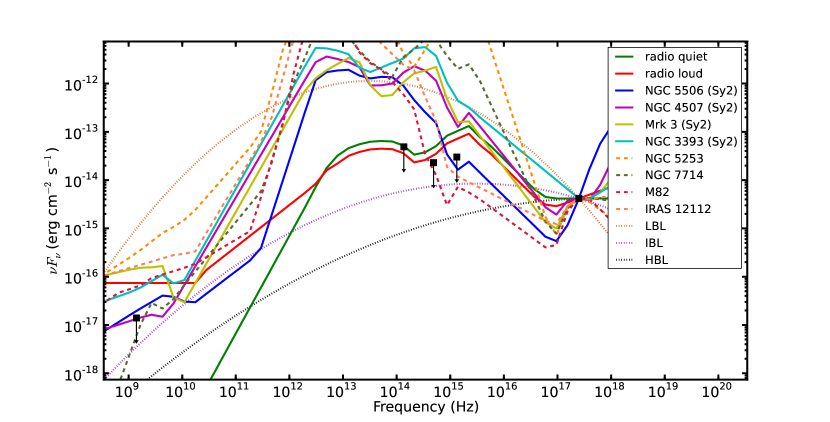
We further developed this idea of discarding other contaminating types of objects by using their broadband SED properties. In Figure 2 we plot observed X-ray-to-radio SEDs of several contaminating object types: AGN, starburst galaxies (Ruiz et al., 2010) and BL Lacs (Nieppola et al., 2006) normalized to the minimum X-ray flux of sources from our sample . When adding upper limits of several other publicly available surveys from radio to near-infrared (NIR) to ultra-violet (UV) domains, it becomes immediately clear that the detection of an object in the X-ray together with a non-detection at other wavelengths in several existing public surveys permits us to filter out all contaminating object classes listed above except for the rare high-energy-peaked blazars (HBL), which however can be discarded at later stages when studying the X-ray spectra, as these possess characteristic hard and flat spectra.
To make this test we involved surveys at other wavelengths, namely the UKIRT Infrared Deep Sky Survey (UKIDSS) in the near-infrared (Lawrence et al., 2007), the Galaxy Evolution Explorer (GALEX) in the ultra-violet (Martin et al., 2005) and the VLA FIRST (Becker et al., 1995) in the radio, all easily accessible from many sites through the VO infrastructure. We performed a cross-match within positional uncertainties plus a typical survey resolution from the X-ray coordinates with the UKIDSS Data Release 10+ (1″ resolution), the GALEX Data Release 6 (3″ resolution) and the VLA FIRST (5″ resolution) catalogs and also inspected their imaging data. This was done with the help of the topcat VO-enabled table processing software (Taylor, 2005) and cds aladin VO image browser (Bonnarel et al., 2000) and its results were used in the next step. We note that at the typical magnitude limit of UKIDSS surveys Vega mag, non-detection of a NIR counterpart translates to for the minimum X-ray flux of our base sample . After this test we found one object (XMM0838+24, see below) that has required .
In this paper we present these 2 HLX candidates that satisfied chosen constraints and passed the SED test above.
3 Data analysis
In this paper we chose to work with science ready data conveniently available through the Virtual Observatory framework. X-ray data in present study were taken from XMM-Newton’s 3XMM-DR5 catalog (Rosen et al., 2015) accessible from the catalog website444http://xmm-catalog.irap.omp.eu and Chandra Source Catalog Release 1.1 (Evans et al., 2010) which we queried through the CDS VizieR service. Other tabular catalog data were accessed in a similar way using VO tools such as cds aladin and topcat.
We performed photometric and astrometric analysis of the flux calibrated optical and NIR images obtained through the CADC. For this purpose we used SExtractor software (Bertin & Arnouts, 1996) coupled with PSFEx (Bertin, 2011), versions 2.19.5 and 3.17.1 respectively. We used SExtractor’s built-in star/galaxy classifiers CLASS_STAR and SPREAD_MODEL and depending on their results took either PSF or Petrosian magnitude as an optical/NIR flux estimate. For photometric upper limit estimates we used either measured magnitudes of stars at signal-to-noise ratio of 5, respective instrument exposure time calculator estimate, or reduction pipeline values from FITS headers, whichever is brighter.
We used the following approach to compute and ratios. X-ray flux was taken from the 3XMM-DR5 unless indicated other. For optical flux we first converted literature or this paper measurements to AB magnitudes and obtained spectral flux density estimate. Same procedure was followed to obtain NIR spectral flux density. Then assuming it does not change much within the bandwidth of SDSS or UKIDSS filter we computed total flux within a bandpass and used it to compute the ratio with given .
4 Results
Positional information such as X-ray coordinates and their uncertainties on selected HLX candidates is presented in Table 1. We give the main properties of the candidates in Table 2. There we also present some parameters of the sources derived under the assumption that they are associated with the optical galaxies. Available properties of the assumed host galaxies are listed in Table 3. In this Section we present the facts we have on the individual candidates.
| Source | Short name | RA | Dec | Pos. err. | ||
|---|---|---|---|---|---|---|
| ID | J2000 | J2000 | (arcsec) | (deg) | (deg) | |
| 201082602010056 | XMM1226+12 | 12:26:47.76 | +12:55:04.2 | 1.0 | 279.6357 | 74.6640 |
| 203022602010004 | XMM0838+24 | 08:38:39.47 | +24:53:09.5 | 0.9 | 199.8610 | 33.7771 |
Note. — Source IDs are given from the srcid column in the 3XMM-DR5 catalog. Positional error is the coordinate uncertainty. and are the Galactic longitude and latitude respectively.
| Source | Flux | Luminosity | Mass | Distance | Separation | Pos. err. | |
|---|---|---|---|---|---|---|---|
| ID | () | () | () | (Mpc) | (arcsec) | (arcsec) | |
| 201082602010056 | (opt) | 754 | 9.1 | 1.0 | |||
| 203022602010004 | (NIR) | 128 | 24.4 | 0.9 |
Note. — Distances derived from the SDSS redshifts are given to a candidate host galaxy (see also Table 3 for other host galaxies properties). The flux column gives the observed 0.2–12 keV flux which is taken from the 3XMM-DR5 catalog. is the ratio of the observed X-ray flux to the detected counterpart or detection limit flux in the optics or in the NIR. The luminosity is computed from the observed X-ray flux column with the assumption that the X-ray source is associated with the galaxy. The mass is calculated from the luminosity using simple Eddington luminosity scaling: , rounded to two significant digits. The separation is given with respect to a host galaxy nucleus. The positional error column is the total position uncertainty in arcseconds calculated by combining the statistical error and the systematic error, taken from the 3XMM-DR5 catalog (sc_poserr column).
| Source | SDSS DR12 objid | Type | Petrosian radius | Redshift |
|---|---|---|---|---|
| ID | ID | (arcsec) | ||
| 201082602010056 | 1237661813349351502 | 4.2 | 0.158 | |
| 203022602010004 | 1237664667887599821 | 14.1 | 0.029 |
Note. — Galaxies types are estimated from SDSS imaging and spectral information. Question mark means that classification is not certain.
4.1 Source 201082602010056 (= XMM 1226+12)
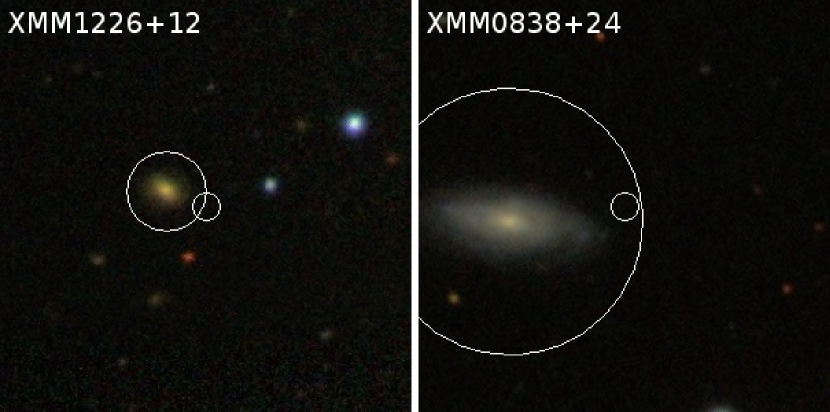
Source 3XMM J122647.7+125504555See full details on this source in the 3XMM-DR5 catalog at http://xmm-catalog.irap.omp.eu/source/201082602010056 (XMM-Newton unique persistent catalog identifier 201082602010056, hereafter source XMM1226+12 for brevity; we follow the same nomenclature for another source) was observed on Jul 1, 2002 as part of observation 0108260201. The source is detected next to the Sa galaxy (see its thumbnail in the Fig. 3). Judging from its SDSS optical spectrum (namely, its position on the Baldwin–Phillips–Terlevich (BPT) diagram (Baldwin et al., 1981)) the assumed host galaxy itself is not active. XMM-Newton catalog flux estimate is .
The source is present in Liu (2011) catalog of X-ray sources from Chandra survey of nearby galaxies where it is associated with NGC 4406 (M86) galaxy at 16.8 Mpc which projects some 8.9′ away. M86 has major semi-axis of 4.5′ according to de Vaucouleurs et al. (1991). These Chandra data were obtained on Mar 9, 2005 and measured X-ray flux is in 0.3–8 keV band. The source is also included in Chandra Source Catalog (Evans et al., 2010) as CXO J122647.7+125505 and its ACIS aperture-corrected net flux from the same observation is estimated as in 0.5–7 keV band.
| Filter | Date | Exp. time | Mag. limit | Seeing |
|---|---|---|---|---|
| (s) | (AB mag) | (arcsec) | ||
| Jan 17, 2005 | 1440 | 25.4 | 1.0 | |
| Apr 17, 2005 | 900 | 24.8 | 1.7 | |
| Apr 01, 2008 | 6984 | 27.0 | 0.8 | |
| Apr 03, 2008 | 4809 | 26.3 | 1.0 |
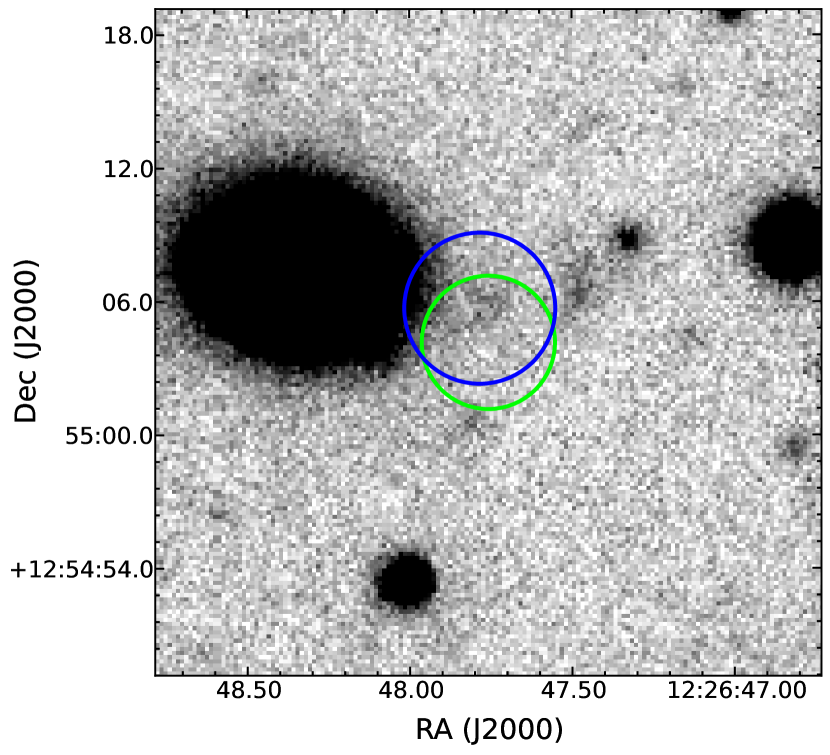
CADC archive has wealth of imaging data in this field as it belongs to Virgo galaxy cluster. We analysed several deep Megacam frames (see the observation log in Table 4). On the deepest band exposure an optical source is visible within combined XMM-Newton and Chandra positional uncertainty (see Fig. 4) at RA=12:26:47.77, Dec=+12:55:06.0. Further we refer to it as to the source A. SExtractor classifies source A as a galaxy and it is indeed apparent that it is extended. Petrosian AB magnitude estimate is whereas if one assumes that source A is a blend, its brightest component has PSF modelled magnitude . However, on the shallower band exposure obtained on Jan 17, 2005 source A is only marginally visible, it is classified as star and has Petrosian AB magnitude of and PSF magnitude . There is no source visible within combined XMM-Newton and Chandra positional uncertainty on Megacam image obtained on Apr 17, 2005 up to image limiting magnitude 24.8. On the deep band frame with almost 7 ksec exposure time and better night conditions source A is marginally resolved into 3 components, two of which have PSF magnitude , and the third fainter one has . Moreover, another source (source B) is detected at 2.5 level at coordinates RA=12:26:47.69, Dec=+12:55:04.0 in the south-west region of the combined X-ray positional uncertainty with . It is also barely visible in the deepest band exposure so we consider source B to be a real object rather than a background fluctuation.
There is no counterpart visible in the UKIDSS Large Area Survey image of this field up to its limiting magnitude of 18.3 (Vega).
4.2 Source 203022602010004 (= XMM 0838+24)
Source 203022602010004666See full details on this source in the 3XMM-DR5 catalog at http://xmm-catalog.irap.omp.eu/source/203022602010004 (IAU designation 3XMM J083839.4+245309) was observed by the XMM-Newton twice, first time on Apr 9, 2005 as part of observation 0302260201 and then on Oct 9, 2005 during observation 0302260401. For brevity in this paper we refer to it as XMM0838+24. Both XMM-Newton observations of this source are consistent with each other within respective parameter uncertainties. The source is situated some 24.4″ away from the nucleus of the galaxy SDSS J083841.25+245306.3 (see its thumbnail in the Fig. 3).
XMM0838+24 is likely associated with the source 1SXPS J083839.3+245310 from the Swift source catalog (Evans et al., 2014) which is situated 3.9 arcsec away from the XMM-Newton position. Its 0.3–10 keV band flux from power-law fit is slightly larger than that of 3XMM-DR5 and estimated to be . Swift detected this source on 4 occasions between Oct 4, 2005 and Dec 17, 2007, and 3 times between Oct 10, 2005 and Nov 25, 2007 the source was not detected though upper limits of those observations were above its mean count rate determined from when it was detected. The photon index for the source in 1SXPS catalog is rather hard, .
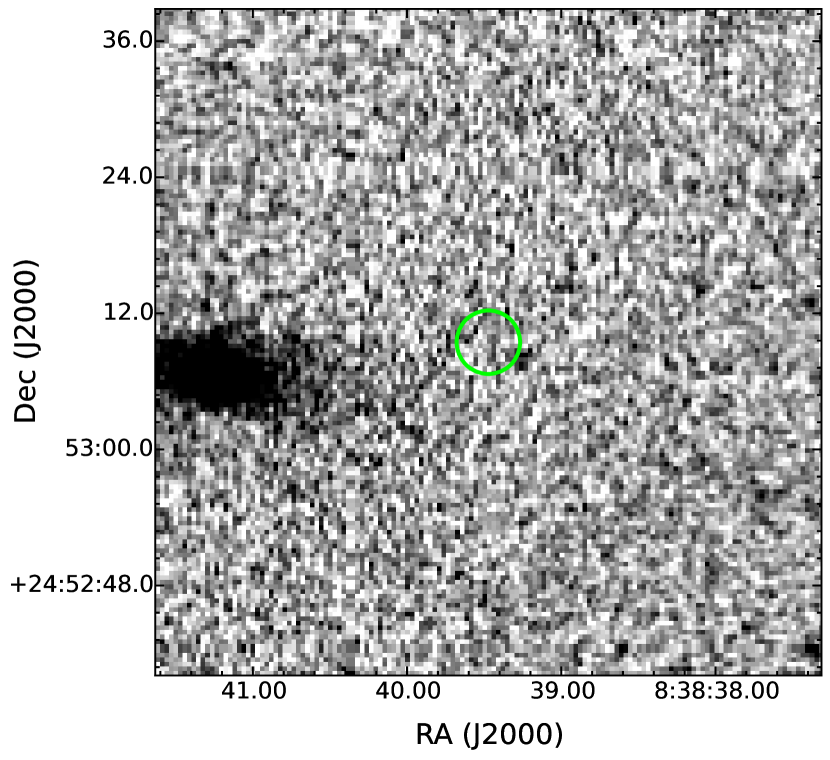
Despite that the cross-match of our base sample with UKIDSS DR10+ catalog did not give any result for this object, we inspected its field of view in band from the UKIDSS Large Area Survey (see Fig. 5). There is a single object marginally visible at signal-to-noise ratio 3 just outside of the X-ray error circle at RA=08:38:39.28, Dec=+24:53:08.0 (3.1 arcsec separation whereas error circle radius is 3.0 arcsec). Its Vega magnitude determined by PSF fitting is which is deeper than typical UKIDSS detection limit because of the good quality of observing night.
5 Discussion
5.1 Possible nature of 2 HLX candidates
Although we cannot provide the exact nature of the selected candidates based on the existing data, we can describe their chances to be conventional non-HLX objects. None of our sources could be a Galactic star: apart from our criterion built into the selection procedure, these are easily recognized in optical SDSS images. Other foreground X-ray Galactic objects are less favored as well by the fact that the sample is constructed from the SDSS survey which intentionally spans high galactic latitudes where number densities of Galactic objects are low. Both our sources lie above (see Table 1). For example, only 34 per cent of known CVs from the latest update of Ritter & Kolb (2003) catalog have a galactic latitude modulus larger than as this is the case for the source XMM0838+24. From the complete flux-limited survey of non-magnetic CVs (which comprise the majority of the local CV population) by Pretorius & Knigge (2012), we can derive the total probability to have a single CV within the search solid angle of our sample to be as low as . The typical flux of our sample translates to an observed luminosity of the order of at a maximum distance of 10 kpc that we can attribute to foreground Galactic objects at these latitudes. This upper luminosity limit is far below the Eddington luminosity for any type of compact stellar mass object but still within a reasonable range for radiatively inefficient BH accretion. Existing data therefore cannot completely rule out the Galactic nature of the sources, though by construction, high galactic latitudes make this hypothesis less probable, especially for XMM1226+12 situated at the latitude of almost . Below we discuss other non-extensive possibilities for each of two sources individually.
The expected host galaxy for the source XMM 1226+12 shows no sign of being an AGN, so it is unlikely that (see Table 2) comes from the host galaxy itself, the origin of such X-ray emission in a normal galaxy is unclear. XMM-Newton and Chandra observations of this source at different epoch with different flux estimates favor for its intrinsic X-ray variability even considering slight mismatch of X-ray bands. This in turn makes its explanation as a superposition of fainter X-ray sources unlikely. In the deepest band exposure of this field there is an extended source A within the combined positional uncertainty of X-ray coordinates, which is resolved in 3 components in band image, however, at low significance level. If it was an inherently extended object it should be detectable in a 1440 sec image at the same flux level which is above the detection limit of that image. If it is indeed a blend of several point objects like suggested by band image analysis, then we see the only one above the detection limit at 1440 sec exposure. We hence assume that source A is a blend of several point-like objects and use its PSF magnitude in band to compute lower limit . Unfortunately, the most shallow exposure of 900 sec was obtained during the night with worse than median weather conditions and has limiting magnitude that does not allow us to constrain optical variability of source A or its components. Non-detection of the NIR counterpart in UKIDSS means its .
Because of the high value and lower limit this source is unlikely a background AGN. One plausible explanation was suggested by Liu (2011) who associated this X-ray object to M86 at 16.8 Mpc away. On the sky plane XMM1226+12 is situated about twice the major semi-axis of ellipse of M86 away from its center at the positional angle of 30 degrees to the major axis, in the gap between M86 and NGC 4438 which is clearly seen as minimum on a radial distance distribution of M86 sources from Liu (2011) catalog. If XMM1226+12 nevertheless belongs to M86, it could be a low-mass X-ray binary (LMXB) with a projected distance of 43 kpc. Liu (2011) estimates its X-ray luminosity to be which is increased to if we consider observed XMM-Newton flux. This would make this source one of the brightest black hole LMXBs in M86. However if this X-ray object is associated with either source A or source B, distance modulus of 31 mag to M86 implies its absolute optical magnitude , a bit brighter than one expects for LMXBs (van Paradijs & McClintock, 1994; Revnivtsev et al., 2012). It is then valid to assume that this could be a LMXB situated in a low-mass globular cluster (GC), especially given that at this radial distance from M86 center there are GCs per sq. arcmin (Rhode & Zepf, 2004) translating into decent probability of a chance superposition with our background galaxy of about 10 per cent. However colors of both brightest component of source A () and source B (, considering deepest band magnitude limit) are too blue for a GC. Indeed, in 2010 edition of Harris (1996) catalog the bluest GCs have 777We transformed their colors into AB system using Jordi et al. (2006) equations., in agreement with colors of dwarf spheroidal systems from Chilingarian & Zolotukhin (2012) (see their fig. C1). Chance superposition probability of a rare blue faint GC in M86 with the background galaxy is neglible. It is therefore unlikely that either the brightest component of source A or source B are field or GC LMXB though no claim can be made about fainter sources. Data existing in the Virtual Observatory does not allow one to rule out the LMXB in M86 possibility with confidence. More observations are required for definitive conclusions on the source’s nature.
By sample construction due to the absence of radio, UV, optical and NIR counterparts the source XMM0838+24 is unlikely to be an active star, background AGN, starburst galaxy, and low/intermediate-/high-energy-peaked blazar (see Figure 2 but consider that detected X-ray flux is in any case above ).
An estimate of depends if we assume marginally visible NIR source associated with the X-ray one. If they are associated, then . Otherwise, this estimate becomes a lower limit. In case we consider maximum X-ray flux from 1SXPS catalog and non-detection in NIR, the flux ratio of XMM0838+24 becomes .
The derived luminosity for source XMM 0838+24 at 10 kpc is . It is too low for a Galactic black hole binary undergoing near-Eddington accretion but may be plausible for an isolated black hole accreting from the interstellar medium (see e.g. Maccarone (2005) and references therein). At the same time in this context indication that the observed X-ray spectrum of source XMM0838+24 does not coincide with predictions for various forms of radiatively inefficient accretion flows which are expected to have a power-law spectrum with a photon index 1.4–2.5 (see e.g. Narayan et al., 1998; Ball et al., 2001).
High-resolution X-ray and deeper optical/NIR imaging and spectroscopic observations are required to shed light on the association of XMM0838+24 and its host galaxy and thus derive its X-ray luminosity.
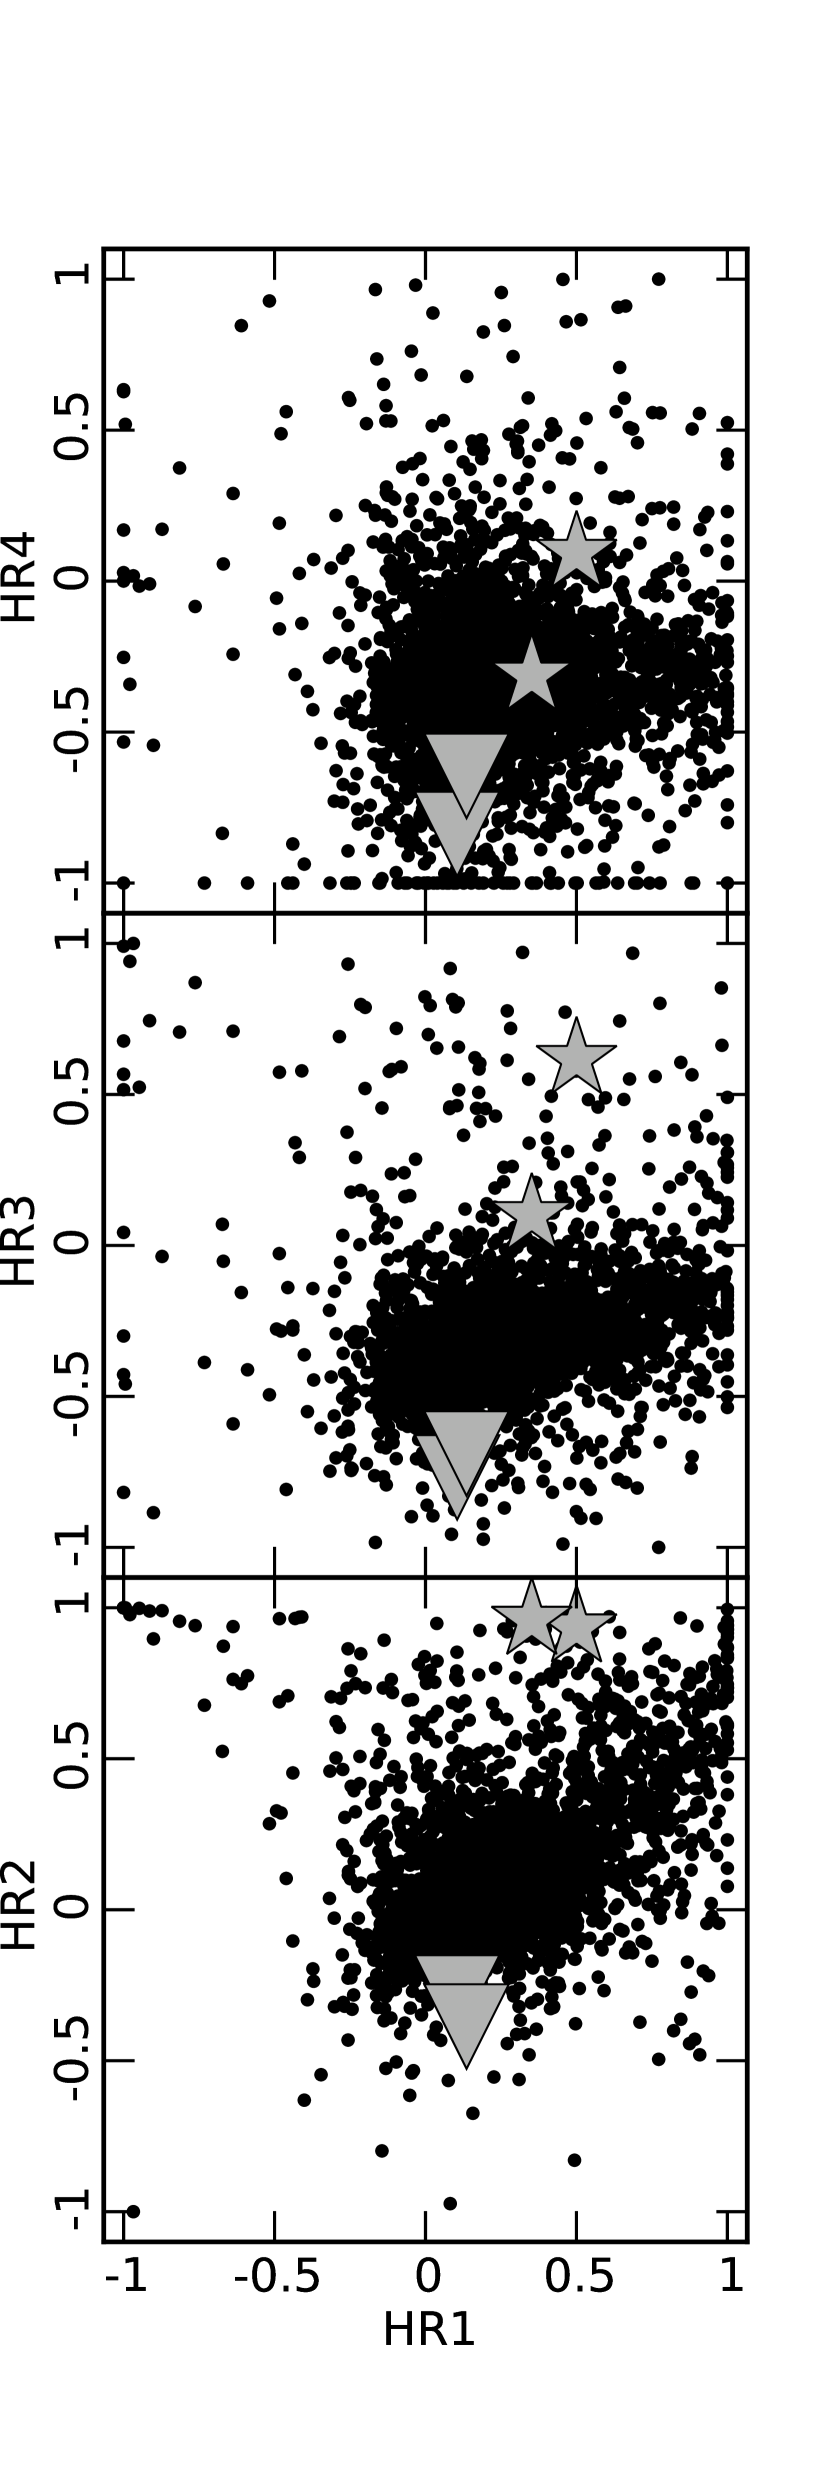
In this study we do not attempt to analyse X-ray spectra of XMM0838+24 and XMM1226+12 in detail because given their faint X-ray fluxes it would not provide any selectivity to discriminate conventional X-ray object types. However we compare their X-ray colors from the XMM-Newton source catalog to a sample of known AGN and ESO 24349 HLX1. On Fig. 6 we overplotted two “corner” states of ESO 24349 HLX1 and our HLX candidates on hardness diagrams of the known AGN population from Lin et al. (2012). Clearly, broadband properties of ESO 24349 HLX1 do not allow its unambigous separation from AGN. At the same time selected HLX candidates are situated aside from ESO 24349 HLX1 and most AGN due to systematically harder HR2 and HR3 colors. This however does not favor any particular interpretation of the nature of the candidates.
5.2 Base sample properties
We compute the number density of the HLX candidates from our base sample. From total 98 HLX candidates we expect to have at least 21 true HLX. Given the searched volume and solid angle this gives us HLX number density to be 1 object per Mpc3. This is approximately a factor of several thousand less frequent than ULXs (Swartz et al., 2011). We can normalize this density to galactic halos. In total there are 33,879 SDSS galaxies falling in the 3XMM-DR5 footprint (total observed part of the sky) which we included in our off-nuclear cross-match procedure. Hence, the density of our HLX candidates is about per galaxy. If they are all accreting IMBHs, this is too large a density for a population of “naked” IMBHs that captured stellar companions, estimated to be per galaxy (e.g. Kuranov et al., 2007). At the same time this does not contradict the expected density of IMBHs that carry baryonic remnants remaining after inefficient galaxy mergers expected at the level of few per galaxy (Volonteri & Perna, 2005). Such light satellites are to have peripheral orbits almost unaffected by orbital decay, in line with significant galactocentric projected distances we observe in our candidates sample (15 kpc in the case of the source XMM0838+24 and 33 kpc for the source XMM1226+12). We also note that like lower luminosity ULXs, two presented HLX candidates reside in late type galaxies, which is different from the ESO 24349 HLX1 host. It is however too early to speculate on the environmental properties on the HLX candidates before the confirmation of their association with the assumed host galaxies.
6 Conclusions
In this study we presented a method to find off-nuclear X-ray sources in the vicinities of galaxies with known distances. Under the assumption that the X-ray sources are associated with the possible host galaxies, we searched for X-ray sources in the luminosity range typical for hyperluminous X-ray objects. Constructed base sample of 98 X-ray sources has at most contaminants thus providing support for the existence of the HLX population. We used public multi-wavelength surveys and data archives accessible through the Virtual Observatory to constrain spectral energy distributions of X-ray sources in a way that minimizes their chance to be conventional X-ray objects such as background AGN, blazars, star-forming galaxies or foreground Galactic objects. In this paper we provide details on 2 HLX candidates from the base sample that satisfy criteria or with existing data and discuss their possible nature. Further follow up observations of the candidates are required to confirm them as HLXs, namely deeper and higher resolution X-ray imaging, optical identification and then optical spectroscopy in order to secure association with a host galaxy.
Appendix A Details on the sample selection
As an effort to make our research results reproducible we give full technical details of the queries written in the Structured Query Language (sql) we performed to construct the resulting sample of HLX candidates. These queries were launched to spectroscopical SDSS DR12 database in the SDSS CasJobs888http://skyserver.sdss3.org/casjobs/ interface. Column names are derived either from 3XMM-DR5 catalog or from SDSS DR12 catalog. Table names are self-explanatory.
After preparing the input X-ray source list (table mydb..xmm, 309 327 records) we first got the nearest SDSS spectral object within 2′ from the X-ray coordinates of each X-ray object (82 710 matches):
SELECT
  *, dbo.fGetNearestSpecObjIDEq(SC_RA, SC_DEC, 2.0) AS specobjid
INTO
  mydb..xmm_match_specdr12
FROM
  mydb..xmm
WHERE dbo.fGetNearestSpecObjIDEq(SC_RA, SC_DEC, 2.0) IS NOT NULL
Then we used the following query to perform the off-nuclear cross-match (see Fig. 1 for the illustration of its positional criterion) between input X-ray list and list of SDSS spectral objects selected at previous step, to get additional photometrical information, calculate distance (discarding those further than 800 Mpc) and X-ray luminosity, filter only those X-ray objects with luminosities between and , and not closer 3 * SC_POSERR arcsec (but at least 5″) to galaxy center and not further than 3 * SC_POSERR + 2 * petroRad_r arcsec (373 matches):
SELECT
  p.objid, p.ra AS sdss_ra, p.dec AS sdss_dec, p.petroRad_r,
  p.petroR50_r, p.petroR90_r, x.*,
  dbo.fDistanceEq(x.SC_RA, x.SC_DEC, p.ra, p.dec) * 60. AS separation,
  dbo.fCosmoDl(s.z,DEFAULT,DEFAULT,DEFAULT,DEFAULT,DEFAULT) AS distance,
  x.SC_EP_8_FLUX * 4 * 3.1415926 *
    power(dbo.fCosmoDl(s.z,DEFAULT,DEFAULT,DEFAULT,DEFAULT,DEFAULT) * 3.08e24, 2) AS luminosity
INTO
  mydb..xmm_match_specdr12_offnuclear
FROM
  photoObjAll AS p
JOIN
  specObjAll AS s ON s.bestobjid = p.objid
JOIN
  mydb..xmm_match_specdr12 AS x ON s.specobjid = x.specobjid
WHERE
  dbo.fDistanceEq(x.SC_RA, x.SC_DEC, p.ra, p.dec) * 60. > 3 * x.SC_POSERR
  AND dbo.fDistanceEq(x.SC_RA, x.SC_DEC, p.ra, p.dec) * 60. > 5.
  AND dbo.fDistanceEq(x.SC_RA, x.SC_DEC, p.ra, p.dec) * 60. < 3 * SC_POSERR + 2 * p.petrorad_r
  AND s.z > 0
  AND x.SC_EP_8_FLUX * 4 * 3.1415926 *
    power(dbo.fCosmoDl(s.z,DEFAULT,DEFAULT,DEFAULT,DEFAULT,DEFAULT) * 3.08e24, 2) > 1e41
  AND x.SC_EP_8_FLUX * 4 * 3.1415926 *
    power(dbo.fCosmoDl(s.z,DEFAULT,DEFAULT,DEFAULT,DEFAULT,DEFAULT) * 3.08e24, 2) < 1e44
  AND dbo.fCosmoDl(s.z,DEFAULT,DEFAULT,DEFAULT,DEFAULT,DEFAULT) < 800
Adding additional constraint on X-ray flux: SC_EP_8_FLUX > 5e-14 to this query make it to be our base sample of 98 HLX candidates.
As a last step we select high X-ray-to-optical ratio candidates. That is, we discard those sources that have optical counterparts in SDSS DR12 within 3 * SC_POSERR, other than the host spectroscopical galaxy itself:
SELECT
  *
INTO
  mydb..xmm_match_specdr12_offnuclear_fxfopt
FROM
  mydb..xmm_match_specdr12_offnuclear
WHERE
  SRCID NOT IN (
    SELECT
      x.SRCID
    FROM
      mydb..xmm_match_specdr12_offnuclear AS x, photoPrimary AS p
    WHERE
      p.objid = dbo.fGetNearestObjIDEq(x.SC_RA, x.SC_DEC, 3 * SC_POSERR / 60.)
      AND p.objid <> x.objid
    )
This resulted in a list of 61 sources which we discarded hence keeping only 37 “optically quiet” sources for further more detailed inspection in this paper.
References
- Alam et al. (2015) Alam, S., Albareti, F. D., Allende Prieto, C., et al. 2015, ArXiv e-prints
- Bachetti et al. (2013) Bachetti, M., Rana, V., Walton, D. J., et al. 2013, ApJ, 778, 163
- Baldwin et al. (1981) Baldwin, J. A., Phillips, M. M., & Terlevich, R. 1981, PASP, 93, 5
- Ball et al. (2001) Ball, G. H., Narayan, R., & Quataert, E. 2001, ApJ, 552, 221
- Bauer et al. (2004) Bauer, F. E., Alexander, D. M., Brandt, W. N., et al. 2004, AJ, 128, 2048
- Becker et al. (1995) Becker, R. H., White, R. L., & Helfand, D. J. 1995, ApJ, 450, 559
- Belczynski et al. (2010) Belczynski, K., Bulik, T., Fryer, C. L., et al. 2010, ApJ, 714, 1217
- Bertin (2011) Bertin, E. 2011, in Astronomical Society of the Pacific Conference Series, Vol. 442, Astronomical Data Analysis Software and Systems XX, ed. I. N. Evans, A. Accomazzi, D. J. Mink, & A. H. Rots, 435
- Bertin & Arnouts (1996) Bertin, E., & Arnouts, S. 1996, A&AS, 117, 393
- Bonnarel et al. (2000) Bonnarel, F., Fernique, P., Bienaymé, O., et al. 2000, A&AS, 143, 33
- Chilingarian & Zolotukhin (2012) Chilingarian, I. V., & Zolotukhin, I. Y. 2012, MNRAS, 419, 1727
- Comastri et al. (2002) Comastri, A., Mignoli, M., Ciliegi, P., et al. 2002, ApJ, 571, 771
- Dadina et al. (2013) Dadina, M., Masetti, N., Cappi, M., et al. 2013, A&A, 559, A86
- Davis et al. (2011) Davis, S. W., Narayan, R., Zhu, Y., et al. 2011, ApJ, 734, 111
- de Vaucouleurs et al. (1991) de Vaucouleurs, G., de Vaucouleurs, A., Corwin, Jr., H., et al. 1991, Third Reference Catalogue of Bright Galaxies. Volume I: Explanations and references. Volume II: Data for galaxies between 0h and 12h. volume iii: data for galaxies between 12h and 24h.
- Dowler et al. (2011) Dowler, P., Rixon, G., & Tody, D. 2011, ArXiv e-prints
- Elvis et al. (2009) Elvis, M., Civano, F., Vignali, C., et al. 2009, ApJS, 184, 158
- Evans et al. (2010) Evans, I. N., Primini, F. A., Glotfelty, K. J., et al. 2010, ApJS, 189, 37
- Evans et al. (2014) Evans, P. A., Osborne, J. P., Beardmore, A. P., et al. 2014, ApJS, 210, 8
- Farrell et al. (2009) Farrell, S. A., Webb, N. A., Barret, D., Godet, O., & Rodrigues, J. M. 2009, Nature, 460, 73
- Farrell et al. (2012) Farrell, S. A., Servillat, M., Pforr, J., et al. 2012, ApJ, 747, L13
- Feng & Soria (2011) Feng, H., & Soria, R. 2011, New Astronomy Reviews, 55, 166
- Fryer & Kalogera (2001) Fryer, C. L., & Kalogera, V. 2001, ApJ, 554, 548
- Georgakakis et al. (2008) Georgakakis, A., Nandra, K., Laird, E. S., Aird, J., & Trichas, M. 2008, MNRAS, 388, 1205
- Godet et al. (2009) Godet, O., Barret, D., Webb, N. A., Farrell, S. A., & Gehrels, N. 2009, ApJ, 705, L109
- Godet et al. (2014) Godet, O., Lombardi, J., Antonini, F., et al. 2014, ArXiv e-prints
- Godet et al. (2012) Godet, O., Plazolles, B., Kawaguchi, T., et al. 2012, ApJ, 752, 34
- Greene & Ho (2004) Greene, J. E., & Ho, L. C. 2004, ApJ, 610, 722
- Harris (1996) Harris, W. E. 1996, AJ, 112, 1487
- Heger et al. (2003) Heger, A., Fryer, C. L., Woosley, S. E., Langer, N., & Hartmann, D. H. 2003, ApJ, 591, 288
- Heida et al. (2013) Heida, M., Jonker, P. G., Torres, M. A. P., et al. 2013, MNRAS, 433, 681
- Heida et al. (2014) —. 2014, MNRAS, 442, 1054
- Jordi et al. (2006) Jordi, K., Grebel, E. K., & Ammon, K. 2006, A&A, 460, 339
- Kuranov et al. (2007) Kuranov, A. G., Popov, S. B., Postnov, K. A., Volonteri, M., & Perna, R. 2007, MNRAS, 377, 835
- Lasota et al. (2011) Lasota, J.-P., Alexander, T., Dubus, G., et al. 2011, ApJ, 735, 89
- Lawrence et al. (2007) Lawrence, A., Warren, S. J., Almaini, O., et al. 2007, MNRAS, 379, 1599
- Lin et al. (2012) Lin, D., Webb, N. A., & Barret, D. 2012, ApJ, 756, 27
- Liu (2011) Liu, J. 2011, ApJS, 192, 10
- Liu & Mirabel (2005) Liu, Q. Z., & Mirabel, I. F. 2005, A&A, 429, 1125
- Maccarone (2005) Maccarone, T. J. 2005, MNRAS, 360, L30
- Martin et al. (2005) Martin, D. C., Fanson, J., Schiminovich, D., et al. 2005, ApJ, 619, L1
- Mignoli et al. (2004) Mignoli, M., Pozzetti, L., Comastri, A., et al. 2004, A&A, 418, 827
- Miniutti et al. (2006) Miniutti, G., Ponti, G., Dadina, M., et al. 2006, MNRAS, 373, L1
- Moretti et al. (2003) Moretti, A., Campana, S., Lazzati, D., & Tagliaferri, G. 2003, ApJ, 588, 696
- Narayan et al. (1998) Narayan, R., Mahadevan, R., & Quataert, E. 1998, in Theory of Black Hole Accretion Disks, ed. M. A. Abramowicz, G. Bjornsson, & J. E. Pringle, 148
- Nieppola et al. (2006) Nieppola, E., Tornikoski, M., & Valtaoja, E. 2006, A&A, 445, 441
- Petrosian (1976) Petrosian, V. 1976, ApJ, 209, L1
- Pretorius & Knigge (2012) Pretorius, M. L., & Knigge, C. 2012, MNRAS, 419, 1442
- Revnivtsev et al. (2012) Revnivtsev, M. G., Zolotukhin, I. Y., & Meshcheryakov, A. V. 2012, MNRAS, 421, 2846
- Rhode & Zepf (2004) Rhode, K. L., & Zepf, S. E. 2004, AJ, 127, 302
- Ritter & Kolb (2003) Ritter, H., & Kolb, U. 2003, A&A, 404, 301
- Rosen et al. (2015) Rosen, S. R., Webb, N. A., Watson, M. G., et al. 2015, ArXiv e-prints
- Ruiz et al. (2010) Ruiz, A., Miniutti, G., Panessa, F., & Carrera, F. J. 2010, A&A, 515, A99
- Servillat et al. (2011) Servillat, M., Farrell, S. A., Lin, D., et al. 2011, ApJ, 743, 6
- Sutton et al. (2015) Sutton, A. D., Roberts, T. P., Gladstone, J. C., & Walton, D. J. 2015, MNRAS, 450, 787
- Sutton et al. (2013) Sutton, A. D., Roberts, T. P., & Middleton, M. J. 2013, MNRAS, 435, 1758
- Sutton et al. (2012) Sutton, A. D., Roberts, T. P., Walton, D. J., Gladstone, J. C., & Scott, A. E. 2012, MNRAS, 423, 1154
- Swartz et al. (2011) Swartz, D. A., Soria, R., Tennant, A. F., & Yukita, M. 2011, ApJ, 741, 49
- Tao et al. (2011) Tao, L., Feng, H., Grisé, F., & Kaaret, P. 2011, ApJ, 737, 81
- Taylor (2005) Taylor, M. B. 2005, in Astronomical Society of the Pacific Conference Series, Vol. 347, Astronomical Data Analysis Software and Systems XIV, ed. &. P. Shopbell, M. Britton, 29
- van Paradijs & McClintock (1994) van Paradijs, J., & McClintock, J. E. 1994, A&A, 290, 133
- Volonteri & Perna (2005) Volonteri, M., & Perna, R. 2005, MNRAS, 358, 913
- Walton et al. (2011) Walton, D. J., Roberts, T. P., Mateos, S., & Heard, V. 2011, MNRAS, 416, 1844
- Walton et al. (2013) Walton, D. J., Fuerst, F., Harrison, F. A., et al. 2013, arXiv, 2633
- Webb et al. (2012) Webb, N., Cseh, D., Lenc, E., et al. 2012, Science, 337, 554
- Webb et al. (2014) Webb, N. A., Godet, O., Wiersema, K., et al. 2014, ApJ, 780, L9