.
Strongly correlated two-dimensional plasma explored from entropy measurements
Abstract
Charged plasma and Fermi liquid are two distinct states of electronic matter intrinsic to dilute two-dimensional electron systems at elevated and low temperatures, respectively. Probing their thermodynamics represents challenge because of lacking an adequate technique. Here we report thermodynamic method to measure the entropy per electron in gated structures. Our technique appears to be three orders of magnitude superior in sensitivity to the ac calorimetry, allowing entropy measurements with only 108 electrons. This enables us to investigate the correlated plasma regime, previously inaccessible experimentally in two-dimensional electron systems in semiconductors. In experiments with clean two-dimensional electron system in Si-based structures we traced entropy evolution from the plasma to Fermi-liquid regime by varying electron density. We reveal that the correlated plasma regime can be mapped onto the ordinary non-degenerate Fermi gas with an interaction-enhanced temperature dependent effective mass. Our method opens up new horizons in studies of low-dimensional electron systems.
Interaction between conduction electrons is well known to become more and more important as dimensionality is reduced and as carrier density decreases. Consequently, the dilute two dimensional (2D) electron systems exhibit a variety of spectacular interaction effects such as the fractional quantum Hall effect nobel_lecture , metal-insulator transition (MIT) in 2D kravchenko ; finkelstein_Science , strong enhancement in the effective mass and spin susceptibility pudalovFL ; clarke-natphys_2008 , etc. The vast majority of these phenomena are explored using charge transport and Coulomb dragdrag measurements. The apparent simplicity of these techniques, however, is spoiled by an indirect character of the results whose interpretation requires specific theoretical models. In contrast, thermodynamic measurements carry more direct information on the electron-electron correlations. However, these measurements are harder because of the smallness of thermodynamic quantities for a dilute single-layer 2D system confining, typically, electrons.
By now, only electron compressibility eisenstein_PRL_1992 ; allison ; dultz , spin magnetization tenehdmudb , and chemical potential pudalov_1986 have been measured in low density 2D carrier systems, whereas the major thermodynamic parameter - entropy - has never been explored.
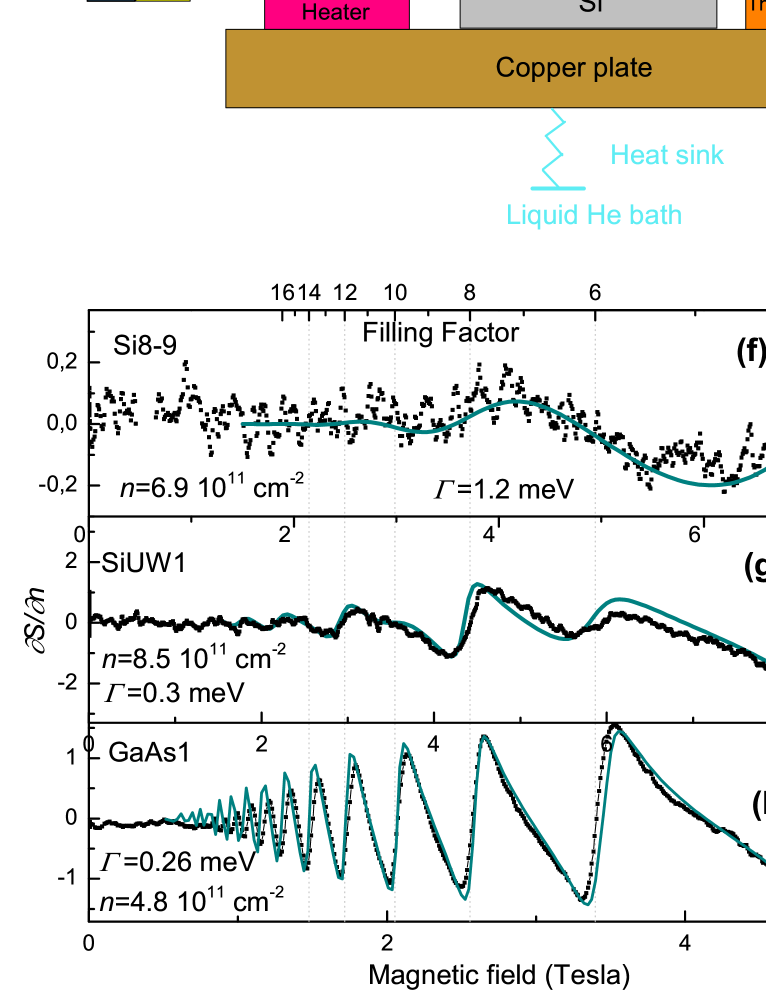
Here we show how the entropy per electron, , can be measured for 2D electron systems ( is the electron density). According to the Maxwell relation , the sought for entropy is found from the temperature derivative of the chemical potential. In order to measure of the 2D electron layer, we use a gated structure (shown schematically in Fig. 1a) where the 2D electrons and the gate act as two plates of a capacitor. When temperature is modulated, the chemical potential of the 2D layer varies causing the capacitor recharging.
Results
The experimental set-up is similar to the one used in Ref. tenehdmudb for spin magnetization measurements. The sample (either Si-MOSFET, or GaAs-FET) and the copper sample holder are kept in a thermal contact with a wire heater which modulates their temperature: . In our experiments, temperature typically varies from 2.4 to 26 K, and is modulated at the frequency Hz with an amplitude K. See Supplementary Note 1 for details concerning temperature modulation.
Modulation of the sample temperature changes the chemical potential and, hence, causes recharging of the gated structure. Therefore, is directly determined in the experiment from the measured recharging current:
| (1) |
Here stands for the capacitance between the gate electrode and 2D electron layer. Both and values were measured using a miniature thermometer attached to the copper sample chamber, and was determined in the same experiment. Using the PPMS-9 cryomagnetic system we applied magnetic field up to 9 T either parallel or perpendicular to the sample plane.We used the following four samples: a Schottky-gated GaAl/AlGaAs heterostructure (sample GaAs1) with peak mobility about 20 m2V-1s-1, and three Si-MOS structures (SiUW1, SiUW2 and Si8-9) with the peak mobilities about 3 m2V-1s-1, 3 m2V-1s-1 and 0.5 m2V-1s-1, respectively. For more details concerning the introduced measurement technique see Supplementary Note 2.
Measurements in quantizing magnetic fields. In order to test the technique, we start from measurements of in quantizing perpendicular magnetic fields. In strong fields the energy spectrum of the system consists of a ladder of the broadened Landau levels whose density of states is shown schematically in Fig. 1b. For simplicity, we focus on the cyclotron splitting and neglect Zeeman splitting, and interaction effects. In the low-temperature limit () the entropy of the noninteracting 2D electron gas is given by
| (2) |
where is the density of states at the Fermi energy. We use throughout the paper . In order to find we express versus (see Fig. 1c) using the definition with being the Fermi-Dirac distribution function. The resulting anticipated behavior of the entropy and as a function of is plotted in Figs. 1d and 1e, respectively.
We emphasize that the calculated entropy vanishes together with in the gaps between Landau levels. As temperature increases and becomes larger than the level broadening , the entropy dips get smeared (see Figs. 1d,e) being averaged over energy interval . Finally, in the high temperature limit , the level quantization is washed out and the entropy should approach the monotonic dependence anticipated for zero magnetic field (see below).
In Figs. 1f,g,h the calculated entropy is compared with the measured magnetic field dependence of for three different samples. The cyan curves show a fit ( for details of the fit see Supplementary Note 3) of the data with the theoretical model (given in Supplementary Note 4) for noninteracting electrons using a bare band mass and a realistic level broadening. The data for the most disordered sample Si8-9 demonstrates only cyclotron gaps resolved at the filling factors and ( for (100) Si-MOS structures, the 2D electron layer has additional twofold valley degeneracy). In order to fit the data at (spin-gap) for the clean sample SiUW1 we used an enhanced g-factor . As known, enhancement of the spin gap due to the inter-level exchange interaction is a precursor of the quantum Hall ferromagnetism Girvin .
The good agreement of the data for GaAs1 sample with the noninteracting theory (Fig. 1h), allows us to compare our method with the state-of-the-art ac calorimetry performed with similar GaAs-samples wang . It appears that our technique has three orders of magnitude higher resolution than the ac calorimetry (see Supplementary Note 5). Importantly, it is also free from the lattice specific heat contribution.
We now consider the interacting 2D electron system in Si-MOSFET samples. Since the density of states in the middle of the gap (at or ) is negligibly small, the entropy at both points should be close to zero. This implies that the area (positive signal) and area (negative signal) should completely compensate each other, as shown in Fig. 1i. This integral property is not affected by correlation effects and is fulfilled in the experimental data with a good accuracy. We can now evaluate the entropy of the system:
| (3) |
In the ideal case, for integration one would have to choose where by definition. However, the 2D system can never be fully depleted: below a threshold density it becomes nonconducting and fails to recharge. For our temperature range and in magnetic fields T we could deplete the samples SiUW1 and SiUW2 down to densities cm-2 which correspond to GOhm resistance of the 2D electron system. Therefore in a strong magnetic field it is more practical to choose as the initial point for the integration such that it corresponds to an even filling factor ( or in our case) where the gap is large. This choice ensures the value to be close to zero.
The integrated entropy is shown in Fig. 1j. As expected from Fig. 1i, at even filling factors () the entropy is almost zero. This fact supports our method of entropy reconstruction.
Measurements in zero perpendicular field. We now turn to more delicate thermodynamic effects for the 2D electron system in zero perpendicular field. For noninteracting 2D electron gas with a simple parabolic spectrum () the density of states is constant . Here denotes the total (spin and valley) spectrum degeneracy, and is the band mass (for (100)Si-MOS , and ando_review ). In the degenerate limit , the entropy is independent of density, , with the exponential accuracy. In the opposite limit , the temperature is the dominant parameter and the entropy per electron agrees with that for the ideal Boltzman gas . For arbitrary temperature, the well-known result for a noninteracting 2D electron gas is given as
| (4) |
With high-mobility Si-MOSFET samples, in contrast to the ubiquitous charge transport, our thermodynamic technique provides an access to the very dilute regime ) cm-2. For such low densities and interaction enhanced quasiparticles effective mass one can readily enter the non-degenerate regime . Moreover, in this regime the typical electron-electron interaction energy is about several meV, i.e. an order of magnitude higher than both, temperature and the Fermi energy ( is the effective dielectric constant for the Si/SiO2 interface) ando_review . Such strong interaction modifies the spectrum and brings us to an unexplored novikov regime of a correlated 2D charged plasma.
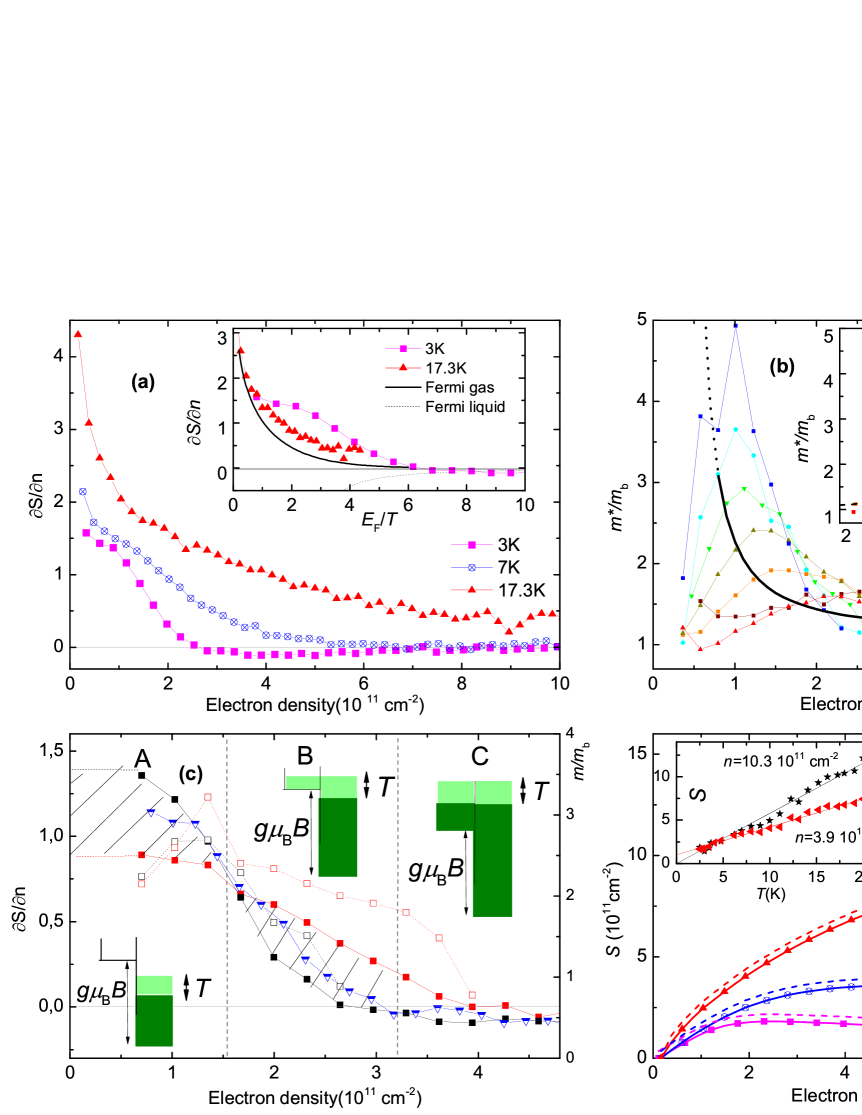
In the low temperature Fermi-liquid (FL) regime, the zero-field entropy is given by Eq. (2) in which is replaced by the density of quasiparticle states at the Fermi level, LL9 . In contrast to the noninteracting case, depends on the electron density via the effective mass which includes renormalization due to electron-electron interaction. Then one finds from Eq. (2) that ; this relates the measured quantity to the . In this regime, the entropy per electron is expected to be negative (see insert to Fig. 2a) since electron-electron interaction increases the effective mass, pudalovFL .
As we found, the mass extracted from our data in the FL regime agrees reasonably with the effective mass measured from damping of the amplitude of quantum oscillations pudalovFL (for more detail, see Supplementary note 6).
As density decreases, the electron system inevitably enters the correlated plasma regime for which the FL theory is inapplicable. There were experimental indications (see pudalov-spinless ; shashkinMindep , and Figs 3a,b of Ref. pudalovFL ) that electron-electron interactions preserve parabolic spectrum in the 2D Fermi-liquid in the wide energy range, rather than in the vicinity of the Fermi-level. We expect therefore that even in the plasma regime the entropy should carry signatures of the interaction-enhanced effective mass.
Examples of the density dependence for several temperatures are shown in Fig. 2a. Qualitatively, the data is consistent with the above expectations: (i) the larger the temperature, the higher is the entropy (area under the curve); (ii) as the Fermi energy (electron density) increases, tends to zero, and (iii) for the lowest temperatures and highest densities, becomes negative, in accord with that anticipated for the Fermi liquid. The inset of Fig. 2a shows that the experimental data are systematically higher than the theoretical dependence for noninteracting Fermi gas, calculated from Eq. (4) (with the bare band mass 0.19 ). Since the entropy is proportional to the density of states averaged over the energy interval , we attribute such excessive entropy regions to the modified effective mass. Lacking a microscopic theory for non-degenerate strongly interacting electron system, we fitted our results using Eq. (4) with a density dependent effective mass as a fitting parameter.
Thus extracted effective mass for different temperatures is shown in Fig. 2b. In the high temperature limit the kinetic energy of electrons is given by temperature; hence, the 2D electron gas turns out to be weakly interacting, and is expected to be described by Eq. (4) with the density-independent effective mass close to the band mass value .
In general, for a given temperature the effective mass exhibits a reentrant behavior: as density decreases first grows, then passes through a maximum, and falls down approaching a value of the order of . The lower the temperature, the higher maximum value the effective mass reaches. The enhanced effective mass is in a qualitative agreement with the low-temperature Shubnikov-de Haas measurements of Ref. pudalovFL (shown with a thick curve in Fig. 2b).
The low density region, where the effective mass falls as density decreases, corresponds to a non-degenerate strongly correlated electron plasma regime (). We are not aware of any theory describing this domain. In order to treat the data in this regime we suggest the following phenomenological approach. For the degenerate clean 2D Fermi liquid, renormalization of its physical parameters, and, particularly, the effective mass, is governed by a single dimensionless variable equal to the ratio of the potential interaction energy to the kinetic Fermi energy, ando_review . Here stands for the effective Bohr radius with average dielectric constant.
As explained above, when temperature increases, the interactions for a given density weaken and can not be characterized anymore by . Correspondingly, to describe our data set over the wide range of densities and temperatures, we suggest a phenomenological effective interaction parameter which interpolates the two limits, of the degenerate Fermi liquid and non-degenerate correlated plasma. It appears that all nonmonotonic dependencies for various temperatures collapse onto a single curve, when we choose , , and (see the inset in Fig. 2b). Some supporting reasonings from the plasma physics can be found in Supplementary Note 7, though the precision of our measurements is not too high to exclude other possible functional forms.
Role of the in-plane magnetic field. In order to have a deeper insight into the effective mass renormalization in the low density regime, we repeat the same measurements with the in-plane magnetic fields , and 9 T, which produce Zeeman splitting and 1 meV, respectively (see Fig. 2c). At low densities (, region in Fig. 2c) the plasma is spin-polarized by T. Therefore, both, and at T are expected to be less than the respective zero field values.
Region is located in the vicinity of the critical density for sample Si-UW2 (cm-2) and below it. If the free spins existed in the 2D system in the region , as the Mott-Wigner scenario of the 2D MIT predicts camjayi , they would be fully polarized by the magnetic field (i.e. at both T and T), and the entropy would fall significantly, by (where is the density of the free spins). However, in 5.5 Tesla field (KK), there is only a small (%) drop of the entropy per electron, which well corresponds to a partial polarization of itinerant electrons, as seen in Fig.2c.
To further show that the drop of entropy in parallel field is simply due to Zeeman polarization of the plasma, we extract the effective mass for the Fermi gas [using Eq. (4) for as it was done above and Eq. (8) from Supplementary note 8 for the Zeeman field] from our and 9 Tesla data (see Fig. 2c). The resulting mass is shown in Fig. 2c with empty symbols. In region (plasma regime), the effective masses for and T agree with each other to within 10%, thus justifying our Fermi-plasma approach.
In region , for both and T-cases the system is almost Fermi-liquid, where as explained above should be negative and small. In the crossover (plasma-to-liquid) regime the signal changes sign (Fig. 2c). For 9T-field the sign change happens at higher density than that for ; respectively, the extracted mass at 9T exceeds essentially the one at zero field. Qualitatively, this is because the nondegenerate minority subband produces the gaseous-like large contribution to the 9T data. The crossover regime requires more detailed consideration.
In region , the density of states and hence the entropy should be the same at 9 T and at zero field. This means that the total area under the curves in Fig. 2c should be the same. Indeed the hatched areas in Fig. 2c do compensate each other.
Integration of entropy in zero field. Integration of the signal from zero density produces the entropy shown in Fig.2d. We neglect the low-density experimentally inaccessible domain because it may lead only to a slight shift of the result, as shown by the dashed lines in Fig. 2d. Plotting the extracted entropy as a function of temperature, we see that for high electron density ( cm-2) it develops linearly-in- (see insert to Fig. 2d), extrapolating to zero at zero temperature, as it should be for a FL according to the 3rd law of thermodynamics.
For lower density ( cm-2) the dependence does not extrapolate linearly to zero at . It is possible that for this density the low- FL regime is not achieved yet, and for even lower temperatures should tend to zero with an increased slope, corresponding to the enhanced effective mass.
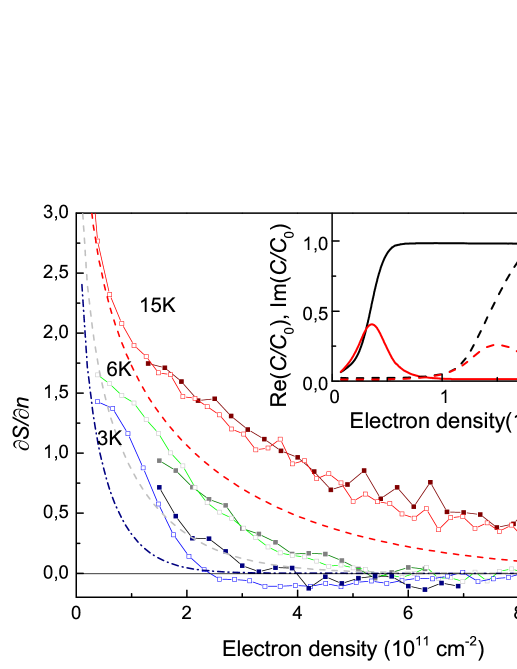
Role of disorder To further elucidate whether the mass growth originates from interelectron interactions or from disorder, we performed similar measurements with a more disordered sample Si8-9 whose mobility is lower by a factor of six (see Fig. 3 and Supplementary Note 9 where transport data are shown ). We note that sample Si8-9 shows no signatures of the metal-to-insulator transition. The threshold density in Si8-8 is much higher than in Si-UW2 (see inset in Fig. 3), therefore only the data above cm-2 are available. Firstly, as well as for the high-mobility sample SiUW-2, the signal () for Si8-9 exceeds considerably the expected signal for the Fermi gas (dashed lines in Fig. 3). Secondly, within the density range where data are available for both samples, they are close to each other for all three temperatures. The above facts signify that the effective mass enhancement is disorder-independent.
Discussion
Interestingly, the explored domain of low densities (cm-2) and temperatures (2.5 K K) belonging to the correlated plasma regime is exactly the regime of the strong “metallicity” and the metal-insulator transition (MIT) for 2D electron systems in high mobility Si-MOSFETs kravchenko ; clarke-natphys_2008 . The observation that the domain of densities in the vicinity of the 2D MIT critical density falls into the strongly-interacting plasma regime and can be parametrized with the temperature-dependent interaction parameter is novel for MIT physics. It points to the necessity of refining the existing theoretical approaches, because most of theoretical models camjayi ; altmas ; finkelstein_Science ; spivak ; dsh ; meir assume degenerate system. We note that our findings do not exclude quantum phase transition or divergency of the effective mass at even lower temperatures.
It is worth of noting here that everywhere we indirectly assume that our system is uniform down to the lowest densities. We can do so because we probe the 2D system on the (0.3-1)s time scale rather than the ps-scale as in transport measurements. For this reason, the regions (if any), poorly-conductive in transport, are well rechargeable in entropy measurements and the criteria of the inhomogeneity (that is a drop in the rechargeable area, i.e. in the capacitance) is shifted deep to the lower density side. In our case for high mobility Si samples we do not observe drop of the capacitance down to half the critical density (see the insert to Fig. 3). This result is similar to that for n-GaAs in Ref.allison ) and therefore we believe that our system is relatively uniform, in the above sense and in the explored elevated temperature range. In Supplementary note 10 we give numerical arguments that the potential nonuniformity is not essential for thermodynamic measurements unless the sample fails to recharge.
To summarize, in order to measure the equilibrium thermodynamic entropy of 2D electron systems we developed the capacitive technique, whose sensitivity enables measurements with electrons only. The key-feature of the method consists in measuring the entropy per electron, , rather than the heat capacitance as in the conventional ac-calorimetry. We traced the entropy evolution in the wide ranges of electron density and temperature, from the low-temperature FL regime to the regime of non-degenerate strongly correlated electron plasma.
We demonstrate that the plasma regime may be phenomenologically mapped to the ideal Fermi gas with a renormalized mass. To characterize the renormalization of the effective mass we introduce an effective interaction parameter which is temperature and density dependent. Our experimental findings are challenging for the theory of the strongly correlated 2D plasma.
Methods
Temperature modulation and measurements. In order to modulate the temperature and to avoid its possible gradients we used a copper cylindric sample holder of the diameter 10-15 mm and the height mm with two Ohm twisted pair manganine heaters wound onto it. One heater was used to control the average temperature of the holder, the other was used for temperature modulation.
The sample and thermometer were glued to the bottom of the holder with heat-conductive varnish. As a thermometer to detect the holder temperature we used either Au:Fe-Cu thermocouple or RuO2 chip resistor. The RuO2 resistance was measured at elevated frequency ( Hz) and then its modulation at the frequency was detected with a separate lock-in amplifier.
Entropy per electron measurements. The signal was detected on a double modulation frequency . For details concerning the choice of the frequency and explanation why the electrons are in thermal equilibrium with the sample we refer to the Supplementary Note 1.
In order to measure femtoampere modulation current a special care was taken to shield the sample from the heater, to ground the measurement circuit properly and to suppress vibrations. The scheme of the home-made amplifier (current-to-voltage converter) and the analysis of its operation are given in Supplementary Note 2.
Samples and characterization. The parameters of the samples used are summarized in the Supplementary Table 1. Electron density in the studied systems was determined by using either the low-field Hall effect or the magnetocapacitance dips in the quantum Hall Effect regime. Both methods give almost the same density value. See Supplementary Note 11 for details. For GaAs gated heterojunctions, measurements and integration of in a wide range of densities were impossible because of extremely large equilibration times and pA-level leakage in Schottky-gate at low densities (high negative gate voltages) .
Theoretical background. All required theoretical basis is summarized in Supplementary Note 8 (2D systems in zero magnetic field) and Supplementary Note 4 (2D systems in finite magnetic field).
Acknowledgements
We thank I. Gornyi, G. Minkov, D. Polyakov and M. Reznikov for discussions. The work was funded by the Russian Science Foundation under the grant No. 14-12-000879. The measurements were done using the equipment of the LPI shared facilities center.
References
- (1) H. Stormer, From Nobel Lectures, Physics 1996-2000, Editor Gosta Ekspong, World Scientific Publishing Co., Singapore, 2002
- (2) S. V. Kravchenko, G. V. Kravchenko, J. E. Furneaux, V. M. Pudalov, and M. D’Iorio;Possible metal-insulator transition at B=0 in two dimensions; Phys. Rev. B 50, 803 (1994).
- (3) A. Punnoose and A.M. Finkel’stein, Metal-Insulator Transition in Disordered Two-Dimensional Electron Systems, Science 14, 289-291 (2005).
- (4) V. M. Pudalov, M. E. Gershenson, H. Kojima, et al. Low-Density Spin Susceptibility and Effective Mass of Mobile Electrons in Si Inversion Layers; Phys. Rev. Lett. 88, 196404, (2002).
- (5) W. R. Clarke, C. E. Yasin, A. R. Hamilton, et al., Impact of long- and short-range disorder on the metallic behaviour of two-dimensional systems; Nat. Phys. 4, 55-59 (2008).
- (6) R. Pillarisetty, Hwayong Noh, D. C. Tsui,et al; Frictional Drag between Two Dilute Two-Dimensional Hole Layers Phys. Rev. Lett. 89, 016805, (2002).
- (7) J. P. Eisenstein, L. N. Pfeiffer, K. W. West; Negative compressibility of interacting two-dimensional electron and quasiparticle gases; Phys. Rev. Lett. 68, 674-677 (1992).
- (8) G. Allison, E.A.Galaktionov, A.K.Savchenko, et al.;Thermodynamic Density of States of Two-Dimensional GaAs Systems near the Apparent Metal-Insulator Transition; Phys. Rev. Lett. 96, 216407 (2006).
- (9) S.C.Dultz and H.W.Jiang, Thermodynamic Signature of a Two-Dimensional Metal-Insulator Transition, Phys. Rev. Lett. 84, 4689-4692, (2000).
- (10) N.Teneh,A. Yu. Kuntsevich, V. M. Pudalov, M. Reznikov; Spin-Droplet State of an Interacting 2D Electron System; Phys. Rev. Lett. 109, 226403 (2012).
- (11) V.M.Pudalov, S.G.Semenchinskii, Quantum oscillations of the density and Fermi energy of electrons at an inversion layer in magnetic field, Pis’ma ZhETF, 44(11), 526-529 (1986). [JETP Lett. 44(11), 677-681 (1986)].
- (12) D.S. Novikov; Temperature-dependent Drude transport in a two-dimensional electron gas, Phys. Rev. B 79, 235304, (2009).
- (13) J. K. Wang, J. H. Campbell, D. C. Tsui, A. Y. Cho, Heat capacity of the two-dimensional electron gas in GaAs/AlxGa1-xAs multiple-quantum-well structures; Phys. Rev. B, 38, 6174-6184, (1988).
- (14) T. Ando, A. Fowler, F.Stern, Electronic properties of two-dimensional systems, Rev. Mod. Phys. 54, 437-672, (1982).
- (15) L. P. Pitaevskii, E. M. Lifshitz, Statistical Physics. Part II, Course of Theoretical Physics, vol. 9, Butterworth-Heinemann, 1980.
- (16) S.M. Girvin and A. H. MacDonald, in: Perspectives on Quantum Hall Effects (Wiley, New York, 1997).
- (17) A. A. Shashkin, M. Rahimi, S. Anissimova, et al., Spin-Independent Origin of the Strongly Enhanced Effective Mass in a Dilute 2D Electron System; Phys. Rev. Lett. 91, 046403, (2003).
- (18) V. M. Pudalov, M. E. Gershenson, and H. Kojima, Probing electron interactions in a two-dimensional system by quantum magneto-oscillations, Phys. Rev. B 90, 075147 (2014).
- (19) A. Camjayi, K. Haule, V. Dobrosavljevic, G. Kotliar, Coulomb correlations and the Wigner-Mott transition, Nat. Phys. 4, 932 - 935 (2008).
- (20) B.L.Alsthuler and D.L.Maslov, Theory of Metal-Insulator Transitions in Gated Semiconductors, Phys. Rev. Lett. 82, 145-148 (1999).
- (21) Y.Meir, Two-species percolation and scaling theory of the metal-insulator transition in two dimensions, Phys.Rev. B 61 16470-16476 (2000).
- (22) B. Spivak, Properties of the strongly correlated two-dimensional electron gas in Si MOSFET s, Phys. Rev. B 64, 085317 (2001).
- (23) S. Das Sarma, E. H. Hwang, and Qiuzi Li, Two-dimensional metal-insulator transition as a potential fluctuation driven semiclassical transport phenomenon, Phys. Rev. B 88, 155310, (2013).
Strongly correlated two-dimensional plasma explored from entropy measurements.
SUPPLEMENTARY ONLINE MATERIALS.
Supplementary Note 1. Temperature modulation
The modulation heater was excited with a current at a frequency . Correspondingly, the heating power was modulated at the double frequency (typically, Hz):
| (5) |
![[Uncaptioned image]](/html/1511.05419/assets/x4.png)
Supplementary Figure 1. The schematics of the sample chamber. Diameter of the can is 14 mm, height is 4 mm.
The sample and the thermometers are placed in a cylindrical copper sample holder. The thermal equilibration time of the sample holder at 4.2 K is short; it may be estimated as s where denotes the density, the thermal conductivity, the specific heat, and is the characteristic sample area across the heat flow. The equilibration time of the single-crystalline silicon chip is also small, s.The low equilibration times ensure the absence of the temperature gradients over the sample area. When the sample, sample holder and thermometer are glued together and placed in a 4He-heat-exchanging gas (see Supplementary Fig. 1) the equilibration time increases being limited by heat conductance of the glue. The thermalization time of the RuO2 thermometer is larger because of its ceramic body. The sample holder aims to achieve thermal equilibrium of all components inside it at a temperature modulation period. It is actively heated with the wire heater and is passively cooled via the heat sink to the cold bath. To minimize the heat flow directly from the sample and thermometer, they are thermally disconnected from the cold bath by the 10 cm long manganin wires. We note that a similar set-up is also used in the ac-calorimetry (see Ref. kraftmakher for a review).
To evaluate the equilibration time experimentally we measured versus electron density at various modulation frequencies (see Supplementary Fig. 2). As one can see, at low frequencies (below 1 Hz), the signal is frequency-independent. It means that both the sample and thermometer have the same temperature modulation . As frequency increases, the signal starts to deviate from the initial value. It means that for the sample and thermometer become different (i.e., thermal link to the sample is too weak). We therefore restricted our measurements to low frequencies (Hz).
![[Uncaptioned image]](/html/1511.05419/assets/x5.png)
Supplementary figure 2. Measured versus electron density for sample Si-UW2 at different frequencies . , .
Provided the thermal equilibration time of the holder with the sample is much less than , one can phenomenologically describe the system as a heat reservoir of the capacitance connected to the cold bath with a weak link . Modulated heating causes: (i) increase of the temperature of the holder and (ii) its modulation. For the modulation one can write the following heat balance equation:
| (6) |
It’s solution can be written as
| (7) |
where
| (8) |
In the high frequency limit, (several Hz in our case), the temperature modulation amplitude is inversely proportional to the frequency (see insert to Supplementary Fig. 2). The measured current (“signal” for shortness) is thus frequency independent (see Eq. (1) in the main text).
An important issue for low-temperature measurements with 2D systems is why we are sure that electrons are in a thermal equilibrium with the lattice. This problem is in fact crucial only at ultra low temperatures. For our experiments, at K, there are solid arguments for the absence of electron overheating. The thermalization of electron system with the lattice is very effective, its rate is s-1 at 3K, where W/K cm2 is the energy relaxation rate measured for similar Si-MOSFET samples in Ref. prus and J/Kcm2 is the specific heat of 2D electrons in (100)Si-MOSFETs at 3K. Therefore, the electron temperature may differ from the holder temperature only due to potential overheating by external RF fields. In a separate experiments we checked that in a similar environment there are no signatures of the overheating (the phase breaking time develops as without saturation, and Shubnikov-de Haas amplitude grows as temperature decreases down to 1.5 K). This is not surprising because we have filtered the side high-frequency signals in our measurements set-up.
Supplementary note 2. Measurement setup and samples studied.
For most of measurements the power modulation frequency, Hz, was chosen as a compromise between the noise level, possibility to achieve low temperatures and possibility to access the low electron densities deep in the insulating regime. In our experiment the lowest available base temperature is 2 K without modulation heating. With increase of the amplitude of temperature modulation the average temperature grows. The amplitude of temperature modulation determines the sensitivity of our measurements. We chose the modulation amplitude equal to 0.05 K for which the lowest temperature was equal to 2.4 K. To access the low electron densities deep in the insulating regime the modulation frequency is restricted by the inverse recharging time, , where is the resistance of 2DEG and the contact, and is the geometrical capacitance.
From the electrical point of view, temperature in our measurement is just an external parameter; it does not differ from, e.g., magnetic field . The procedure to measure in the insulating regime () is justified in Ref. jetpl . One needs to measure a complex capacitance at the same frequency as the signal, to account for the phase shift. The same procedure is applicable here and allows us to perform measurements deep in the insulating regime (GOhm, cm-2).
![[Uncaptioned image]](/html/1511.05419/assets/x6.png)
Supplementary Figure 3. The diagram of the measurement circuit. is the sample with grounded 2DEG, is an external voltage source. GOhm and pF form the feedback impedance.
The diagram of our measurement setup is shown in Supplementary Fig. 3. The sample is shown as capacitor . When an external parameter is modulated, the ac current flows through the feedback (FB) of the current amplifier and causes ac voltage at the output , where . We use AD 820 operational amplifier with input impedance Ohm pF. The output voltage is measured with a lock-in amplifier. The gate voltage is set by the external voltage source through the summing amplifier. The sample capacitance value can be measured in situ, using the input. An ac voltage at the input causes the current through the feedback.
To separate the physics of interactions and disorder we selected for these studies several samples: high-mobility Si-MOSFETs Si-UW1 and Si-UW2, low-mobility Si-MOSFET Si8-9 and Schottky-gated GaAs/AlGaAs heterojunction. The relevant sample parameters are summarized in the Supplementary Table 1.
Supplementary table 1. Samples’ properties
Sample
Density range,
range,
Capacitance,
Area,
Peak mobility,
1011 cm-2
meV
pF
mm2
mVs
SiUW1
0.3-12
0.2-7.5
700
4
3
SiUW2
0.3-12
0.2-7.5
680
4
3
Si8-9
1.5-12
0.9-7.5
630
4
0.5
GaAs1
0.4-5
1.7-20
1100
5
20
Supplementary note 3.Testing the technique in quantizing magnetic fields.
In order to obtain a quantitative information from magnetooscillations of , we fit the data according to Eqs. (16) and (21). The fit was performed using three adjustable parameters, the level broadening , effective mass and -factor. In fact, the effective mass and -factor are very close to their band values. In particular, for GaAs1 sample one can neglect Zeeman effects below 3 Tesla. The examples of data fit are shown in Figs. 1b and 1d of the main text.
![[Uncaptioned image]](/html/1511.05419/assets/x7.png)
Supplementary Figure 4. Magnetooscilations of the entropy per electron. Black dots show the dependence for sample SiUW1 at cm-2 for K (dots). Light cyan line is a fit using Eq.21 with , ,meV; dark cyan line is the fit with , ,meV.
In higher field and at low temperatures the interlevel exchange interaction increases the spin and cyclotron gaps (precursors of quantum Hall ferromagnetism Girvin ), and opens the valley gaps pudalov-valley_1985 in Si-based structures. This makes a simple noninteracting theory inapplicable. In particular, features related with the valley gaps are clearly seen at in Figs. 1i and 1j of the main text. Quantitatively, in order to account for the gap increase we may use enhanced g-factor. Supplementary Figure 4 illustrates two examples of fitting the same data for Si-UW1 sample with (bare value) and with enhanced . The latter fit allows to resolve the Zeeman feature. We thus show that our data reproduce reliably the previous results. Detailed study of the oscillatory phenomena by means of entropy is beyond the scope of the present work and will be published elsewhere.
Supplementary Note 4.Thermodynamics in a perpendicular magnetic field
.0.1 2D noninteracting electrons
In the presence of the perpendicular magnetic field the thermodynamic potential is given as (we disregard the Zeeman splitting for a moment)
| (9) |
where the density of states
| (10) |
Here we introduce the function to describe the broadening of a Landau level by disorder. It satisfies the normalization condition: . The typical width of a Landau level can be estimated as . As usual, by means of the Poisson resummation formula, for we find the Lifshitz-Kosevich-type expression LK :
| (11) |
Here denotes the zero-field thermodynamics potential and the parameter characterizes the Landau level broadening:
| (12) |
In the absence of disorder and . For commonly used models of the disorder Landau level broadening the functions and the Fourier coefficients are summarized in Supplementary Table 2.
Supplementary table 2. The function for different models of Landau level broadening. Here denotes the Bessel function.
Lorentzian
Gaussian
Semicircle
We mention that as follows from Eq. (9) in the limit of small temperature , the entropy is given by the result (33). In the case of the Lorentzian Landau level broadening the density of states at the Fermi energy becomes
| (13) |
In the limit Eq. (13) implies that the entropy is almost zero for the chemical potential outside a Landau level, : . In case of the chemical potential inside a Landau level, , the entropy is large: .
Equation (11) results in the following dependence of the electron density on the chemical potential, temperature and magnetic field
| (14) |
Using the following thermodynamic identity (see e.g. LL5 )
| (15) |
we find that
| (16) |
Equations (14) and (16) determine the dependence of the derivative on the electron density , temperature and magnetic field. In the case of weak oscillation, (), we can simplify Eq. (16) as
| (17) |
In the presence of the weak Zeeman splitting, the partition function can be found by means of following substitution:
| (18) |
Then for we find
| (19) |
Hence the electron density is given as
| (20) |
and the derivative of the entropy becomes as follows
| (21) |
.0.2 Interacting 2D electron system
For 3D electron system the Lifshitz-Kosevich expression for magnetooscillations of the thermodynamic potential obtained in the absence of interaction can be used for the case of interaction provided one takes into account standard Fermi-liquid renormalization of the quasiparticle spectrum L ; BG . For two-dimensional electron system, it is not the case, in general CS . For classically weak perpendicular magnetic field, modification of the Lifshitz-Kosevich-type expression for a 2D electron interacting disordered system has been studied in Refs. MMR ; AGM .
As follows from the results of Ref. AGM , for classically weak magnetic field, , [in this case the Landau levels are almost completely broadened and ], the derivative has small harmonic oscillations with the magnetic field:
| (22) |
Here is the Landau level degeneracy, and . Apart from the standard Fermi-liquid renormalization of the effective mass, and the Dingle temperature , there is additional temperature dependence of the amplitude of the oscillations due to combined effect of interaction and disorder which is described by the . In the ballistic regime, , and for Coulomb type scattering the function is given as AGM :
| (23) |
In the diffusive regime, , the expression for can be found in Ref. AGM .
Supplementary Note 5. Comparing with the ac calorimetry
Strictly speaking, the method described above allows us to measure , whereas the ac calorimetry measures specific heat . Both methods, however, allow one to evaluate the entropy change. In the quantizing regime, when the entropy oscillates one can integrate both and , and to calculate the respective changes in entropy between its neighboring maximum and minimum. We compare the smallest oscillation one may resolve with each particular method.
The ac calorimetry measurements in a sample with density cm-2, mobility mVs (both comparable to our GaAs1 sample) and in a similar temperature range (1.7- 4.6 K) were done with a stack of 75 quantum wells, with 50 times larger total area wang . The smallest oscillation was observed at in 3 Tesla.
In our measurements with GaAs1 sample (Fig 1 in the main text) at 2.5 K we observed huge oscillations at the same field of 3 Tesla. The oscillations were clearly observed down to 1 Tesla, where they had a factor of 50 lower amplitude. This implies that our technique has times better sensitivity per unit area than the ac-calorimetry. Remarkably, the value we measure is of purely electronic origin and has no contribution from the lattice specific heat.
Supplementary note 6. Fermi-liquid regime
![[Uncaptioned image]](/html/1511.05419/assets/x8.png)
Supplementary Figure 5. The lowest temperature negative signal(normalized by temperature).
At the lowest temperatures in the Fermi-liquid regime the entropy per electron is negative, , due to renormalization of the effective mass (see Ref.ando_review and Supplementary Note 8). Using the definition of density of states:
| (24) |
and definition of entropy in degenerate Fermi system (here is the interaction renormalized mass, and we set throughout the Supplementary notes), we may compare the lowest temperature negative data with that calculated with the effective mass independently measured from Shubnikov-de-Haas effect PudFL . The comparison in Supplementary Fig. 5 shows a reasonable qualitative agreement.
Supplementary note 7.Degenerate and non-degenerate Fermi-liquid regime.
In low temperature Fermi-liquid regime the strength of interaction is parameterized by the ratio of typical interaction and kinetic energies, . Here , the average dielectric constant at the interface ando_review , and the Fermi energy . At high temperatures, , the kinetic energy is determined by the temperature. Therefore, one might expect that the effective interaction parameter should depend not only on electron density, but also on temperature. In the case of very high temperatures , it is natural to choose to be proportional to the ratio . At the intermediate temperatures there are other energy scales related with the interaction: i) the plasmon frequency at the Fermi wave vector , ; ii) the electron-electron collision rate which is of the order of where denotes the 2D Debye wave vector PRA1 ; PRA2 . Therefore, we introduce phenomenologically a generalized dependence that interpolates the two known limits: . Theoretically, we expect three different possibilities for the parameter at : i) is determined by the ratio , i.e., and ; ii) is determined by the ratio , i.e., and ; iii) is determined by the ratio , i.e., and . Although all three definitions might be formally possible, the last one, obviously, does not fit the highest temperature limit .
![[Uncaptioned image]](/html/1511.05419/assets/x9.png)
Supplementary Figure 6. Effective mass versus effective interaction parameter . (a,b) The values were determined in various ways (the formulae are shown) using the Hall density. (c) The same as (b) using the density determined from SdH effect.
Experimentally our data are somewhat scattered and collected in a limited temperature and density range. The value of the effective mass relies also on measurement of the electron density which can be defined in two different manners giving different results. If we trust the Hall density, the best fit of experimental data is achieved for , and (see Supplementary Fig. 6a ). However, we cannot find for this fit a physical interpretation. Among possibilities described above the best fit is achieved for the case (ii) with (see Supplementary Fig. 6b). Changing the definition of density (“Hall density” versus “QHE density”) modifies slightly the optimal value of and does not improve considerably the agreement between the fit and the data (see Supplementary Fig. 6c ).
Supplementary note 8. Thermodynamics in zero perpendicular magnetic field.
.0.3 2D Ideal Fermi gas
The thermodynamic potential per unit area of the ideal Fermi gas is given as (see e.g. LL5 )
| (25) |
Here is the single-particle density of states. Provided , where takes into account possible spin and valley degeneracy, denotes the Heaviside step function, and we set from here onwards, we find the following temperature dependence of the chemical potential for a fixed electron density:
| (26) |
Here denotes the Fermi energy. Hence the derivative of the entropy with respect to the electron density is as follows (see Eq. (4) in the main text)
| (27) |
In the presence of a parallel magnetic field , the thermodynamic potential can be written as
| (28) |
with given by Eq. (25). Here stands for the Zeeman splitting (). Hence we obtain the following chemical potential at a fixed total electron density:
| (29) |
| (30) |
Therefore the derivative of the entropy with respect to the electron density becomes
| (31) |
.0.4 2D Fermi liquid
The Fermi liquid concept is applicable to the low temperature regime only. The well-known low- expression for the specific heat (see e.g. LL9 )
| (32) |
implies the following expression for the entropy
| (33) |
Here is the quasiparticle density of states at the Fermi level, the effective mass depends on the electron density via the Landau coupling constant . Hence, we find
| (34) |
In fact, as well-known, there is non-analytic correction of the order to the lowest order Fermi-liquid result (32). CB ; MC ; MPE This implies that
| (35) |
In the limit of large electron density, it is known CB that . Here denotes the Riemann zeta function. In the limit of strong interaction, , the function is determined by the quasiparticle backscattering amplitudes at the Fermi surface for charge and spin channels MC ; MPE . We note here that the above formulae are given for the review purpose only. We did not observe signatures of the nonanalytic corrections in our experiments.
In the presence of weak short-ranged disorder, , where stands for the elastic transport time, the function can be written in terms of Landau interaction parameters in charge () and spin/isospin () channelsCA :
| (36) |
In addition, in the case of weak short-ranged disorder, one needs to take into account in Eq. (35) the renormalization of the effective mass Finkelstein1 ; Finkelstein2 ; Castellani1986 ; CA due to combined effect of interaction and disorder: ,
| (37) |
where (the Euler constant )CA . Here denotes the dimensionless (in units of ) Drude conductivity. In the case of long range Coulomb interaction, one needs to take the limit in Eqs. (36) and (37).
Supplementary Note 9. Comparison of the thermodynamic and transport data.
![[Uncaptioned image]](/html/1511.05419/assets/x10.png)
Supplementary Figure 7. Resistivity data. (a)Temperature dependence of resistivity for sample Si-43 (similar to Si-UW2 and Si-UW1) from Ref. AMP . Electron densities from bottom to top are(in units of cm-2): 9.9, 8.12. 6.33, 5.43, 4.54,3.19,2.75,2.30, 2.07,1.85, 1.67, 1.49,1.34,1.25, 1.16, 1.075, 1.03, 0.985, 0.954, 0.895, 0.806, 0.770, 0.716. (b) Temperature dependence of resistivity for the disordered sample Si-39 (the same wafer as Si8-9) from Ref. AMP for various densities. Densities from bottom to top are (in units of cm-2): 5.5,4.8,4.4,4.2,4.0,3.9,4.0,3.9,3.7,3.4,3.1,2.9. (c)Density dependence of the resistivity for samples Si-UW2 (solid line) and Si8-9 (dashed line) for a fixed temperature of 3K.
In zero magnetic field, the high-mobility Si-MOSFETs exhibit a metal-to-insulator transition (MIT). There are several theoretical suggestions that this transition is a QPT, and several experimental papers demonstrating scaling of various physical properties (transport, magnetization, thermo-EMF), in support of this view. On the high density side of the transition there is a strong ”metallic“ () conductivity region. A reasonable question arises how the thermodynamic features reported here are related with the strong metallicity and MIT?
Using our high-temperature method we of course cannot address the QPT physics.
In Supplementary figures 7a and 7b we compare the temperature dependencies of the resistivity for the high mobility (clean) and low mobility (disordered) samples. It is worth noting the low mobility MOSFETs which do not demonstrate the apparent MIT, also have metallic (though weak) temperature dependence of resistivity (see Refs. AMP ; PBr for more detailed comparison of clean and disordered samples). Comparison of the resistivity for two studied samples at a fixed temperature of 3K (see Supplementary Fig. 7c) clearly shows that the dissimilarity in their transport data (caused by different disorder) is irrelevant to the similarity in the entropy behavior (see the main text).
Supplementary note 10.Testing the role of potential fluctuations.
In the equilibrium, the ele trochemical potential value is the same over the sample area. Inevitable (in high mobility samples) long-range disorder potential fluctuations force the local Fermi (kinetic) energy and the local density to fluctuate and can even lead a system to microscopic phase separation. What we measure is , averaged over the sample area. In this connection, a natural question arises: to what extent are the local potential fluctuation important?
Indeed, the upturn in the inverse compressibility allison ; dultz usually observed at low densities (close to the metal-insulator transition) is commonly accepted fogler ; shi ; ghoshal as the firm evidence for the development of an inhomogeneous two-phase state. Local compressibility measurements ilani1 ; ilani2 also directly demonstrate spatial inhomogeneity.
There are however several experimental arguments showing that in the explored range of parameters in our measurements the sample inhomogeneities are irrelevant:
-
•
Most of experimental indications of charge inhomogeneities were obtained at much lower temperatures. The local observations of the spatial non-uniformity in high-mobility GaAs samples were done well below 1 K ilani1 ; ilani2 . Our magnetization measurements with high-mobility Si samples teneh ; teneh2 revealed the spin “droplets” with an enhanced spin (4 x single electron spin), persisting in the 2D system on top of the Fermi liquid. These spin droplets however melt very rapidly with temperature (spin susceptibility behaves roughly as teneh ; teneh2 ) and at K the droplets have negligible impact on thermodynamics. The absence of spin droplets is confirmed also by our entropy measurements at 3K in 5.5 Tesla parallel magnetic field (see the corresponding paragraphs of the main text). There was a certain activity on transport detection of droplet-related features in mesoscopic scale 2D systems ghosh ; baenninger ; goswami . In all these papers signatures of droplets also arise only at low temperatures ( K).
-
•
We note that the upturn of the inverse compressibility corresponds to reduction of the sample capacitance. In the above cited studies the onset of the inhomogeneous phase occurs close to or below . The compressibility measurements in Refs. allison ; dultz were done with GaAs- based systems. With our high mobility 2D electron system in Si-UW2 sample we did not observe capacitance reduction over the whole explored range of densities, down to cm, similar to that for n-GaAs in Ref. allison . For even lower densities the sample closes (i.e. fails to recharge), and its capacitance sharply drops down, impeding measurements for lower densities. The low mobility sample Si8-9 closes at higher densities cm-2, however, it didn’t manifest the MIT making senseless the question of the relation between the and .
-
•
As said above, an inhomogeneous sample state might set for , where the capacitance sharply drops and the entropy measurements are inaccessible. Correspondingly, in the measurements (Fig. 2a of the main text), the data are missing in this range. In order to fill this gap, for simplicity, we have postulated for . One might think that we loose an entropy related to this lowest density interval , when we integrate the measured signal from 0 to . However, the integrated entropy (see insert to Fig.2d) for density cm-2 extrapolates to zero as temperature goes to zero, in accord with the 3rd Law of thermodynamics. This result means that the inaccessible interval does not contain notable amount of either excessive, or missing entropy. In other words, the entropy contribution from the localized (on inhomogeneities) phase is negligible and does not affect the measured averaged over the sample area.
-
•
The value also allows to make upper estimate of the screened potential fluctuation amplitude: (otherwise, the hills of potential landscape exceed the Fermi level, the effective area of the sample and, hence, the capacitance start reducing). In a simple noninteracting picture the fluctuating dips of potential are responsible for band tail (see Supplementary Fig. 8a). We model the band tail within the simple Fermi-gas approach to see how it affects the signal. Below we present results for two shapes of the band tail (a smooth one, Supplementary Fig. 8b, and the step-like one, Supplementary Fig. 8c).
![[Uncaptioned image]](/html/1511.05419/assets/x11.png)
Supplementary Figure 8. Testing the role of semiclassical effect of disorder potential.(a) Schematics of the spatial potential landscape. (b) The density of states with a smooth band tail (formula is given in the Figure). (c) The density of states with a step-like band tail.
![[Uncaptioned image]](/html/1511.05419/assets/x12.png)
Supplementary figure 9. Disorder impact on entropy per electron. The dependencies at different temperatures (a - 6K, b-3K) calculated for 2DEG in Si with tails in density of states: solid blue line , solid wine line , solid red line is a two-step-like function(see Supplementary Figure 8). Dashed lines correspond to the right axes and show effective mass determined from the respective data.
In order to find at given density and temperature and for given dependence we solve numerically the equation with respect to :
(38) Further, we take a derivative . At K (Supplementary Fig. 9a), the for 2D systems with and without the band tail is almost indistinguishable. The effective mass was determined from the data using Eq. 4 of the main text(i.e. in the same manner as it was done for the data processing). As a result, at K we observe only a few percent difference in the effective mass determined for the model with and without the band tail. At K (which is almost the lowest temperature in our experiments) the effective mass at higher densities exceeds the band value by up to (Supplementary Fig. 9b) and tends to drop slightly for low densities.
The above consideration shows that within our constraints on nonuniformity of the system, and in the framework of the noninteracting model the thermodynamics of the non-degenerate Fermi gas at relatively high temperatures is not affected by potential fluctuations.
![[Uncaptioned image]](/html/1511.05419/assets/x13.png)
Supplementary Figure 10. QHE features, used to determine the carrier density. Capacitance measured at elevated frequency (red dots, right axis) and for Si-UW2 at 2.6K (black dots, left axis) in the QHE regime Tesla.
![[Uncaptioned image]](/html/1511.05419/assets/x14.png)
Supplementary Figure 11. Two ways to determine electron density.Electron density versus gate voltage for sample Si-UW2 at 2.6 K determined from Hall effect at 1 Tesla (blue dots) and from positions of QHE dips in capacitance at 9 Tesla using Eq.(39) (red dots and line). Equations denote linear interpolations of the dependencies. The inset shows the corresponding effective mass determined from Eq. 4 of the main text from data using both definitions of density for K.
Supplementary note 11. Carrier density control.
Being able to measure , the capacitance, resistivity and the Hall resistivity we can estimate electron density and relate it to the features in thermodynamic quantities. In the quantum Hall effect (QHE) regime, capacitance sharply drops at integer filling factors:
| (39) |
Due to these sharp features, the electron density can be quantified in the QHE regime of strong magnetic fields and high carrier densities, and, consequently, may be related to the gate voltage , , similar to that in the plane capacitor ando_review . As one can see from Supplementary Fig. 10, the capacitance drops exactly correspond to the respective features in . Information about electron density canalso be obtained from the low-field Hall effect measured in both field directions with subsequent data antisymmetrization. For an ideal 2D system, both methods should give the same value for electron density. Practically, however, Hall density is usually a little bit higher JETPLett-Hall_2005 .
Both methods become inadequate in the insulating regime ( cm-2) where quantization is suppressed, current flow becomes nonuniform and the “Hall-insulator” state often forms, in which the Hall voltage is irrelevant to the carrier density Hall_insulator . In this regime we can estimate electron density only by its extrapolation from higher densities. Supplementary Figure 11 shows comparison of the two methods for density determination. The insert to Supplementary Fig. 11 shows the effect of the chosen density definition on the effective mass. It is seen that although definition of density for low affects effective mass considerably, it does not change qualitatively the dependence and conclusions of our paper (see the main text).
References
- (1) Y. Kraftmakher, Modulation Calorimetry: Theory and applications. Springer-Verlag Berlin Heidenberg, 2004.
- (2) O. Prus, M. Reznikov, U. Sivan, V.M. Pudalov; Cooling of Electrons in a Silicon Inversion Layer; Phys. Rev. Lett. 88, 016801, (2002).
- (3) M. Reznikov, A.Yu. Kuntsevich, N. Teneh, and V. M.Pudalov, Thermodynamic magnetization of of two-dimensional electron gas measured over wide range of densities. Pis’ma ZhETF 92, 518-522 (2010) [JETP Lett. 92, 470-474 (2010)].
- (4) S.M. Girvin and A. H. MacDonald, in Perspectives on Quantum Hall Effects (Wiley, New York, 1997).
- (5) V.M. Pudalov, S.G. Semenshinskii, and V.S. Edel’man, Valley splitting in the electron spectrum of a Si inversion layer; Pis’ma ZhETF 41, 265-267 (1985); [JETP Lett. 41, 325-328 (1985)].
- (6) I. M. Lifshitz and A. M. Kosevich, On the theory of magnetic susceptibility of metals at low temperatures, Zh. Eksp. Teor. Fiz. 29, 730-742 (1955) [Sov. Phys. JETP 2, 636-648 (1956)].
- (7) L. D. Landau, E. M. Lifshitz, Statistical Physics. Part I, Course of Theoretical Physics, vol. 5, Butterworth-Heinemann, 1980.
- (8) J. M. Luttinger, Theory of the de Haas-van Alphen Effect for a System of Interacting Fermions; Phys. Rev. 121, 1251-1258 (1961).
- (9) Yu. A. Bychkov and L. P. Gor’kov; Quantum oscillations of the thermodynamic quantities of a metal in a magnetic field according to the Fermi fluid model; JETP 14, 1132-1140 (1962).
- (10) S. Curnoe and P.C.E. Stamp, Quantum Oscillations of Electrons and of Composite Fermions in Two Dimensions: Beyond the Luttinger Expansion; Phys. Rev. Lett. 80, 3312-3315 (1998).
- (11) G. W. Martin, D. L. Maslov, and M. Yu. Reizer; Quantum magneto-oscillations in a two-dimensional Fermi liquid; Phys. Rev. B 68, 241309(R) (2003).
- (12) Y. Adamov, I. V. Gornyi, and A. D. Mirlin; Interaction effects on magneto-oscillations in a two-dimensional electron gas; Phys. Rev. B 73, 045426 (2006)
- (13) J.K.Wang, J.H. Campbell, D. C. Tsui, A. Y. Cho, Heat capacity of the two-dimensional electron gas in GaAs/AlxGa1-xAs multiple-quantum-well structures; Phys. Rev. B, 38, 6174-6184, (1988).
- (14) V. M. Pudalov, M. E. Gershenson, H. Kojima, et al. Low-Density Spin Susceptibility and Effective Mass of Mobile Electrons in Si Inversion Layers; Phys. Rev. Lett. 88, 196404, (2002).
- (15) T. Ando, A. B. Fowler, and F. Stern, Electronic properties of two-dimensional systems, Rev. Mod. Phys. 54, 437-672, (1982).
- (16) K.I. Golden, D. Lu, Dynamical theory of classical surface plasmas; Phys. Rev. A 31, 1763-1775, (1985).
- (17) K.I. Golden, G. Kalman,P. Wyns; Response function and plasmon dispersion for strongly coupled Coulomb liquids: Two-dimensional electron liquid; Phys. Rev. A 41, 6940-6948 (1990).
- (18) L. P. Pitaevskii, E. M. Lifshitz, Statistical Physics. Part II, Course of Theoretical Physics, vol. 9, Butterworth-Heinemann, 1980.
- (19) D. Coffey and K. S. Bedell;Nonanalytic contributions to the self-energy and the thermodynamics of two-dimensional Fermi liquids; Phys. Rev. Lett. 71, 1043-1046 (1993).
- (20) A. V. Chubukov, D. L. Maslov, S. Gangadharaiah, and L. I. Glazman; Singular perturbation theory for interacting fermions in two dimensions; Phys. Rev. B 71, 205112 (2005).
- (21) H. Meier, C. Pépin, and K. B. Efetov; Low-energy excitations and singular contributions in the thermodynamics of clean Fermi liquids; Phys. Rev. B 84, 205131 (2011).
- (22) G. Catelani and I. L. Aleiner, Interaction corrections to thermal transport coefficients in disordered metals: the quantum kinetic equation approach; ZhETF 127 372-411,(2005)[JETP 100, 331-369 (2005)].
- (23) For review, see A.M. Finkelstein, Electron liquid in disordered conductors, vol. 14 of Soviet Scientific Reviews, ed. by I.M. Khalatnikov (Harwood Academic Publishers, London, 1990).
- (24) For review, see A.M. Finkelstein; Disordered electron liquid with interactions; Int. J. Mod. Phys. B 24, 1855-1894 (2010).
- (25) C. Castellani, C. Di Castro, P. A. Lee, M. Ma, S. Sorella, and E. Tabet; Enhancement of the spin susceptibility in disordered interacting electrons and the metal-insulator transition; Phys. Rev. B 33, 6169-6176 (1986).
- (26) B.L.Altshuler, D.L.Maslov, and V.M.Pudalov, Metal-insulator transition in 2D: resistance in the critical region, Physica E, 9, 209-225 (2001).
- (27) V.M. Pudalov, G. Bru nthaler, A. Prinz, G. Bauer; Metal-insulator transition in two dimensions; Physica E 3, 79-88 (1998).
- (28) G. Allison, E.A.Galaktionov, A.K.Savchenko, et al., Thermodynamic Density of States of Two-Dimensional GaAs Systems near the Apparent Metal-Insulator Transition, Phys. Rev. Lett. 96, 216407 (2006).
- (29) S.C.Dultz and H.W.Jiang, Thermodynamic Signature of a Two-Dimensional Metal-Insulator Transition; Phys. Rev. Lett. 84, 4689-4692, (2000).
- (30) M.M.Fogler,Nonlinear screening and percolative transition in a two-dimensional electron liquid; Phys. Rev. B 69, 121409 (R) (2004).
- (31) Junren Shi and X.C. Xie, Droplet State and the Compressibility Anomaly in Dilute 2D Electron Systems; PRL 88, 086401 (2002).
- (32) A. Ghosal, A.D.Guclu, C.J.Umrigar, et al., Correlation Induced Inhomogeneity in Circular Quantum Dots; Nat.Phys. 2, 336-340, (2006).
- (33) S.Ilani, A.Yacoby, D.Mahalu, and H.Shtrikman, Unexpected Behavior of the Local Compressibility near the B=0 Metal-Insulator Transition; Phys. Rev. Lett. 84, 3133-3136 (2000).
- (34) S.Ilani, A.Yacoby, D.Mahalu, and H.Shtriktman, Microscopic Structure of the Metal-Insulator Transition in Two Dimensions ; Science 292, 1354-1357 (2001).
- (35) N.Teneh,A. Yu. Kuntsevich, V. M. Pudalov, M. Reznikov; Spin-Droplet State of an Interacting 2D Electron System; Phys. Rev. Lett. 109, 226403 (2012).
- (36) N. Teneh, A. Yu. Kuntsevich, V. M. Pudalov, T.M. Klapwijk, M. Reznikov, Thermodynamic magnetization of a strongly interacting two-dimensional system, Preprint at http://arxiv.org/abs/0910.5724 (2009).
- (37) A. Ghosh, C. J. B. Ford, M. Pepper, H. E. Beere, and D. A. Ritchie, Possible Evidence of a Spontaneous Spin Polarization in Mesoscopic Two-Dimensional Electron Systems, Phys. Rev. Lett., 92, 116601, (2004).
- (38) M. Baenninger, A. Ghosh, M. Pepper, H.E. Beere, I. Farrer, D.A. Ritchie, Low-Temperature Collapse of Electron Localization in Two Dimensions, Phys. Rev. Lett. 100, 016805 (2008).
- (39) S. Goswami, C. Siegert, M. Baenninger, M. Pepper, I. Farrer, D. A. Ritchie, A. Ghosh, Highly Enhanced Thermopower in Two-Dimensional Electron Systems at Millikelvin Temperatures, Phys. Rev. Lett 103, 026602 (2009).
- (40) A. Yu. Kuntsevich, D. A. Knyazev, V. I. Kozub, V. M. Pudalov, G. Brunthaler, and G. Bauer, Nonmonotonic temperature dependence of the Hall resistance of a two-dimensional electron system in silicon; Pis’ma ZhETF 81, 502-506 (2005); [JETP Lett. 81, 409-412 (2005)]
- (41) S.V. Kravchenko, J.E. Furneaux, and V.M. Pudalov,Hall insulator in two-dimensional electron system in silicon in the extreme quantum limit, Phys. Rev. B 49(3), 2250-2252 (1994).