Cyanide photochemistry and Nitrogen fractionation in the MWC 480 disk
Abstract
HCN is a commonly observed molecule in Solar System bodies and in interstellar environments. Its abundance with respect to CN is a proposed tracer of UV exposure. HCN is also frequently used to probe the thermal history of objects, by measuring its degree of nitrogen fractionation. To address the utility of HCN as a probe of disks, we present ALMA observations of CN, HCN, H13CN and HC15N toward the protoplanetary disk around Herbig Ae star MWC480, and of CN and HCN toward the disk around T Tauri star DM Tau. Emission from all molecules is clearly detected and spatially resolved, including the first detection of HC15N in a disk. Toward MWC 480, CN emission extends radially more than 1 exterior to the observed cut-off of HCN emission. Quantitative modeling further reveals very different radial abundance profiles for CN and HCN, with best-fit outer cut-off radii of 300 AU and 11010 AU, respectively. This result is in agreement with model predictions of efficient HCN photodissociation into CN in the outer-part of the disk where the vertical gas and dust column densities are low. No such difference in CN and HCN emission profiles are observed toward DM Tau, suggestive of different photochemical structures in Herbig Ae and T Tauri disks. We use the HCN isotopologue data toward the MWC 480 disk to provide the first measurement of the ratio in a disk. We find a low disk averaged ratio of 200100, comparable to what is observed in cloud cores and comets, demonstrating interstellar inheritance and/or efficient nitrogen fractionation in this disk.
Subject headings:
astrochemistry, ISM: molecules, protoplanetary disks, radio lines; techniques: high angular resolution1. Introduction
| Line | Frequency | Beam | PA | Channel width | Noise | |
|---|---|---|---|---|---|---|
| GHz | K | arcsec | mJy beam-1 channel-1 | |||
| CN | 340.24777 | 32.6 | 0.1 | |||
| HCN | 354.50548 | 42.5 | 0.1 | |||
| 259.0118 | 24.9 | 0.2 | ||||
| 258.1571 | 24.8 | 0.2 |
Note: Two values are given for the beam, PA and noise, corresponding to the parameters in MWC 480 and DM Tau, respectively.
Protoplanetary disks are characterized by radial and vertical temperature and UV radiation gradients due to the exposure of disk surfaces to stellar and interstellar radiation, and attenuation of this radiation by dust and gas (Calvet et al., 1991; Herczeg et al., 2002). This radiation and temperature structure should result in a chemically stratified disk structure. Atoms and radicals (e.g. CN) alone are expected to survive in the UV-illuminated disk surface (Bergin et al., 2003). Molecules that are readily photo dissociated by UV radiation are mainly present in a protected layer between the disk surface and the cold midplane. In the midplane freeze-out of heavy atoms is expected to be nearly complete (Dutrey et al., 1997; Qi et al., 2013). The existence of these cold disk regions may be conductive to efficient fractionation of heavy isotopes into specific molecules as is introduced below.
Due to their different levels of photo resistance, CN/HCN ratio has been proposed as a tracer of UV radiation fields in disks (Fuente et al., 1993). In addition to different vertical scale heights, Jonkheid et al. (2007) proposed that CN emission should be much more extended than HCN emission in disks around Herbig Ae stars due to UV penetration down to the midplane in the outer low-density disk. In the outer disk region, the disk molecular layer is effectively absent, resulting in a lack of HCN emission. Whether a similar structure should be expected around T Tauri stars is unclear because Herbig Ae stars are orders of magnitude more luminous than T Tauri stars. Öberg et al. (2011) used 3″ Submillimeter Array (SMA) observations of CN and HCN in a sample of disks to search for differences in the CN and HCN emission radii, and identified low-significance differences in a handful of cases. Chapillon et al. (2012) observed CN and HCN emission at an angular-resolution of towards two T Tauri stars and one Herbig Ae star, but could not constrain the relative radial distribution because of different excitation characteristics of the observed HCN and CN lines.
HCN isotopologue ratios are potential probes of the disk thermal history. HCN is expected to become enriched in 15N (chemically fractionated) at low temperatures due to a small difference in zero-point energies for the 14N and 15N isotopologues (Terzieva & Herbst, 2000; Rodgers & Charnley, 2008). Based on this scenario, the nitrogen isotopic compositions of different bodies in the Solar System (the Sun, rocky planets, gaseous planets, comets, meteorites, etc) have been used to understand their origin (see Mumma & Charnley, 2011, and references therein). There are, however, other potential sources of 15N enrichment than chemical fractionation (Heays et al., 2014, and see Discussion). Measurements of nitrogen fractionation in analogs to the Solar Nebula are therefore key to interpreting Solar System isotopic data.
In this paper we present ALMA observations of CN and HCN, and the HCN isotopologues H13CN and HC15N towards the protoplanetary disks around Herbig Ae star MWC 480. We also present CN and HCN data toward the disk around T Tauri star DM Tau to enable a comparison between T Tauri and Herbig Ae photochemistry. Both stars are located in the Taurus star forming region at a distance of 140 pc, and are known to present large, chemically rich disks (Dutrey et al., 1997; Henning et al., 2010; Öberg et al., 2010; Chapillon et al., 2012; Öberg et al., 2015). The observations are data reduction process are described in section 2. The observational results and analysis are presented in section 3 and a discussion is given in section 4. We summarize our findings an conclude in section 5.
2. Observations and data reduction
2.1. CN and HCN
The HCN and CN , lines were observed towards MWC 480 and DM Tau with the Atacama Large (sub-)Millimeter Array (ALMA) during Cycle 0 (PI: E. Chapillon, proposal 2011.0.00629). The Band 7 observations were carried out in October 2012 with 23 antennas. The total on-source observing time was 34 min and the baselines lengths ranged between 21 and 384 m. The frequency bandpass was calibrated by observing the bright quasar J0423-013 at the begining of the observing run. The phase and amplitude temporal variations were calibrated by regularly observing the nearby quasars J0423-013, J01510-180 and Callisto. J01510-180 was used to derive the absolute flux scale. Two spectral windows of 468 MHz bandwidth and 122 kHz spectral resolution were centered on the CN and HCN lines.
The data were calibrated by the ALMA staff using standard procedures, and retrieved from the public archive. We further self-calibrated the data in phase and amplitude in CASA, taking advantage of the bright continuum emission in both sources. The solutions of the self-calibration derived for the continuum were applied to each spectral window. The continuum was then subtracted from the visibilities using channels free of line emission to produce the spectral line cubes. The images were obtained by deconvolution of the visibilities using the CLEAN algorithm in CASA, with Briggs weighting and a robust parameter of 0.5, resulting in an angular resolution of . A clean mask was created for each channel to select only regions with line emission during the cleaning process. Table 1 summarizes the observational parameters of the lines.
2.2. and
The and lines were observed towards MWC 480 with ALMA during Cycle 2 as part of project 2013.1.00226 (PI: K.I. Öberg). These observations, partially described in Öberg et al. (2015), are part of a larger survey that did not include DM Tau. In brief, the Band 6 observations were carried out in June 2014 with 33 antennas with baseline lengths spanning between 18 and 650 m. The total on-source observing time was 24 min. The quasar J05101800 was observed to calibrate the amplitude and phase temporal variations, as well as the frequency bandpass. The same quasar was used to derive the absolute flux scale, as no planet was available during the observations. Two spectral windows of 59 MHz bandwidth and 61 kHz channel spacing covered the and lines.
A description of the phase and amplitude calibration, as well as the self-calibration, can be found in Öberg et al. (2015). The self-calibrated visibilities were cleaned in CASA using a robust parameter of 1.0, yielding an angular resolution of (see Table 1). This selection of robustness parameter allowed us to improve the signal-to-noise ratio of the weak and lines, while maintaining a good angular resolution. A clean mask was created for each channel, similarly to CN and HCN, to select only regions with line emission during the cleaning process.
3. Observational results and analysis
3.1. Spatial distribution of CN and HCN
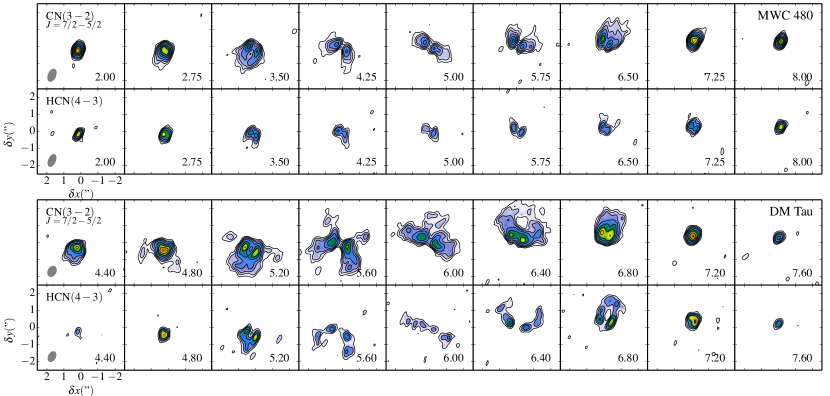
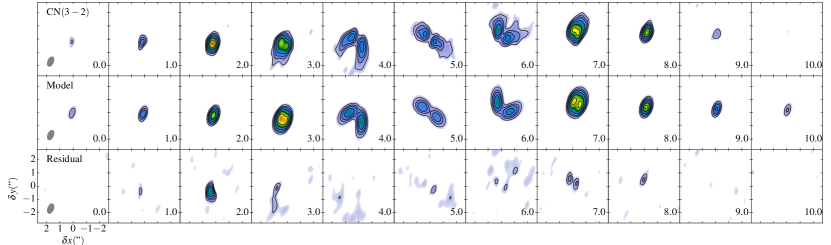
Figure 1 shows the channel maps of the CN , and HCN lines in the MWC 480 and DM Tau disks. The velocity pattern characteristic of Keplerian rotation is seen for both lines and disks. Toward MWC 480, the HCN emission is clearly more compact than the CN emission in all channels. Such a difference in emission patterns is not observed toward the DM Tau disk. Furthermore, DM Tau exhibits a much more complex emission pattern in both the CN and HCN lines. The CN ‘butterfly’ shape in some of the central channels is caused by spectrally resolved hyperfine components. HCN seems to present an outer ring, whose potential origin is discussed in section 4.
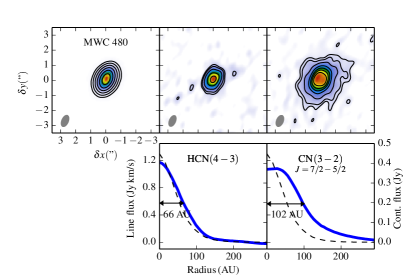
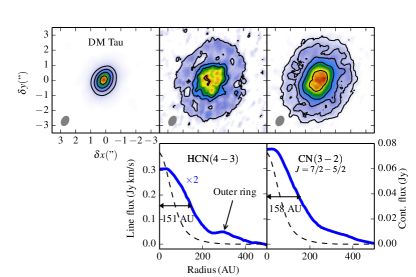
Fig. 2 shows the continuum, and velocity integrated maps and azimuthally averaged radial profiles of the CN and HCN lines towards MWC 480 and DM Tau. Toward MWC 480, these data representations confirm the noted differences in CN and HCN emission regions in Fig. 1. CN emission is detectable at a 2 larger radius compared to HCN. The best-fit half-light radius for the HCN and CN emission toward MWC 480 are 66 and 102 AU, respectively. We further note that the HCN emission has a similar size to that of the dust continuum emission, which is shown in dashed-line in Fig. 2. In contrast, toward DM Tau the best-fit half-radius for HCN and CN are similar, 151 and 158 AU, respectively. The HCN outer ring hinted at in the DM Tau channel maps is also confirmed as a ‘bump’ around 300 AU in the radial profile. No such ring is seen toward MWC 480.
| Parameter | Value | Ref. | |
|---|---|---|---|
| Scale height | 16 AU | Guilloteau et al. (2011) | |
| 1.25 | |||
| Surface density | 0.18 | Guilloteau et al. (2011) | |
| 0.75 | |||
| 81 AU | |||
| Temperature | 23 K | Piétu et al. (2007) | |
| 0.5 | |||
| 1.5 | Dartois et al. (2003) | ||
To quantify the HCN and CN radial abundance profiles we modeled the CN and HCN emission using the procedure and disk density and temperature structure described in (Öberg et al., 2015). Key parameters adopted in the model are listed in Table 2. In brief, we model molecular abundances by defining them as power-laws , with the abundance with respect to total hydrogen at AU. We also included an outer cut-off radius, . We ran grids of models for different outer radius , power-law indexes and molecular abundances . The line emission was calculated using the radiative transfer code LIME (Brinch & Hogerheijde, 2010) assuming non-LTE excitation with collision rates from (Dumouchel et al., 2010) for HCN and from Lique et al. (2010) for CN. For the HCN isotopologues, we use the collisional rates of HCN. The model fitting was done in the plane by computing , the weighted difference between model and observations, for the real and imaginary parts of the complex visibilities. The best-fit models were obtained by minimizing .
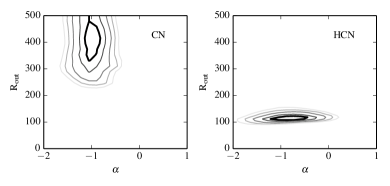
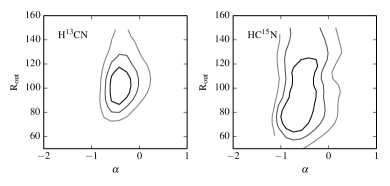
Fig. 4 shows the resulting contours of the distribution for the HCN and CN abundance profiles. The best fit model of both CN and HCN lines corresponds to a decreasing abundance profile as a function of radius, with . The best-fit outer-radius of the HCN emission is 110 AU, while the outer-radius of the CN emission is constrained to AU, i.e. larger than HCN. The best-fit abundances at 100 AU of CN and HCN are given in Table 3 but they are highly model dependent, i.e. they depend strongly on the assumed vertical abundance profile, and should not be directly compared with model predictions. Table 3 lists the best fit parameters together with what are formally 7 error bars based on the data SNR. In our case the data SNR is high enough that we are dominated by stochastic noise from the radiative transfer code and the 7 error bar represents the deviation from the best fit model where there is a clear, visual misfit between model and data.
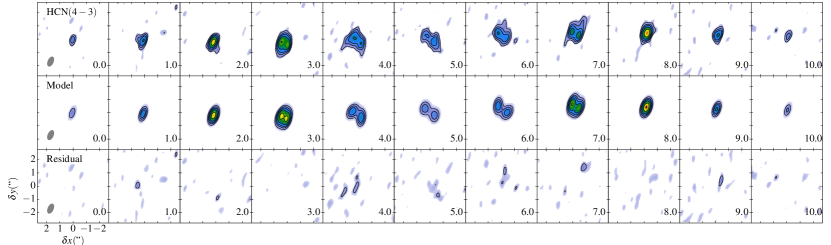
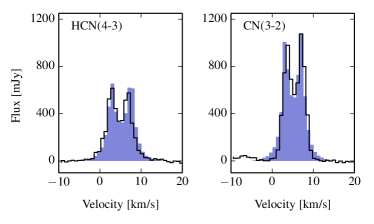
Figure 3 shows the excellent fit between our best-fit model and the data. Except for the low-velocity CN channels there are no significant residuals, and those residuals are due to the second hyperfine component of CN, which is not included in our model. This hyperfine component is weak in MWC 480, but it is clearly seen in DM Tau (see Fig. 1). The good fit is also apparent when comparing the disk-integrated spectra (Fig. 5), where the spectra are extracted using a Keplerian mask.
3.2. HCN isotopologues
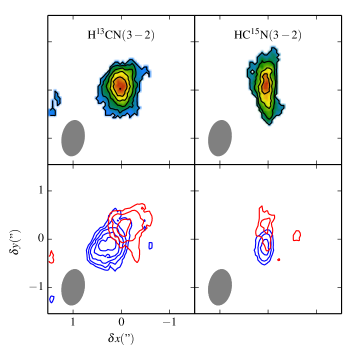
Figure 6 displays the moment-zero maps of the and lines in MWC 480 together with the integrated emission of the blue and red shifted part of the the spectra, illustrating the disk rotation. The emission of the two isotopologues is compact, visually similar to the dust continuum and the HCN line emission.
We modeled the emission of the HCN isotopologues following the same procedure as for CN and HCN above. Figure 8 shows the distribution for the and abundance profiles. The best fit parameters are listed in Table 3. The good fit of the best-fit model to the data disk integrated spectra (extracted using a Keplerian mask) is shown in Fig. 7. The best-fit model abundances at 100 AU are given in Table 3. Similarly to CN and HCN, the absolute abundances are uncertain, due to an unknown vertical abundance profile. Assuming that the HCN isotopologue emission originates in the same disk layer and that the lines are optically thin, their abundance ratio should be robust, however. This abundance ratio is 2.81.4 and holds for the entire disk out to 100 AU since both lines are best fit by the same power-law index of .
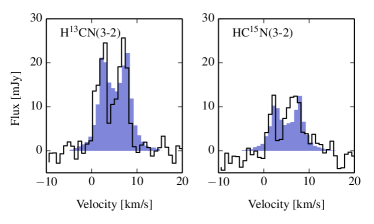
In the MWC 480 disk, the integrated HCN density flux ratio is , which is lower than the 12C/13C isotopic ratios observed in the ISM, indicating that the HCN line is partially optically thick. We therefore use as a proxy of HCN to calculate the nitrogen fractionation in HCN. Assuming an isotopic ratio of 12C/13C, we derive a disk HCN isotopologue ratio HC14N/. To estimate this error we included a 30% uncertainty in the C isotopic ratio, as this value has been shown to vary both with time and density (Roueff et al., 2015). The main uncertainty (%), however, arises from the error in the measured ratio.
| CN | HCN | |||
|---|---|---|---|---|
| -1 | -1 | -0.5 | -0.5 | |
| [AU] |
Note: The absolute abundances are largely uncertain, due to the unknown vertical abundance and temperature profiles. However, because and are expected to be, for the most part, co-spatial their abundance ratio does not suffer greatly from uncertainties in the vertical temperature profile. Therefore, the inferred ratios is robust.
4. Discussion
4.1. Photochemistry: CN and HCN
The observed CN and HCN disk emission profiles in the MWC 480 disk are well-fit by power-law abundance profiles with a radial cut-off that is two times larger for CN compared to HCN. CN is thus significantly more radially extended than HCN, i.e. we can exclude with a high level of confidence that excitation alone is responsible for the different HCN and CN emission profiles. This result is consistent with chemical model predictions of survival of CN and rapid photodissociation of HCN in the outer, low-density disk (Aikawa et al., 2002; Jonkheid et al., 2007). Indeed, these models predict that the CN abundance can remain constant and even increase with radius because radical formation is favored at low densities, and because CN is a major HCN photodissociation product. HCN, on the other hand, should only be present in the high-density parts of the disk where a shielded molecular layer exists.
The same models also predict a different vertical structure of CN and HCN, with the CN abundance peaking close to the disk surface in the inner disk regions. Constraining the vertical abundances of these molecules requires multiple line transitions and/or direct observations of vertical emission patterns in edge-on disks. In the meantime, the derived abundance ratio of the two molecules remains relatively unconstrained.
The emission of CN and HCN in the disk around T tauri star DM Tau exhibit different patterns compared to MWC 480. First, the spatial distribution (the extension of the emission) is similar for CN and HCN in the DM Tau disk. This difference between MWC 480 and DM Tau may be explained by the fact that the UV field around DM Tau should be substantially lower. Less vertical disk column may therefore be required to shield the outer disk regions, resulting in a shielded molecular layer out to many 100s of AU in the DM Tau disk. Second, HCN exhibits a low SNR outer ring around 300 AU, best identified in the azimuthally-averaged emission profile. The gap demarcating the main HCN disk from the outer ring is faintly seen in CN as well. This gap may be the result of micron-sized dust depletion at the same radius due to dust dynamics, which would enable UV radiation to penetrate down toward the midplane, photo-dissociating HCN. Such a dust lane has been observed toward TW Hya in scattered light (Debes et al., 2013). Similar high-quality scattered light observations toward DM Tau could resolve this question. If this scenario is confirmed, these ALMA observations suggest that CN/HCN observations could be developed into a powerful probe of dust distributions and dynamics in the outer regions of disks.
4.2. Nitrogen fractionation in the MWC480 disk
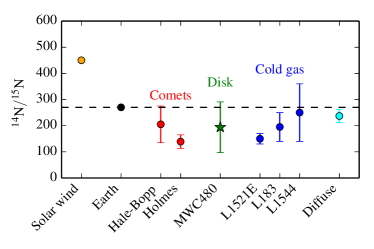
We used observations of HCN isotopologues to determine the level of nitrogen fractionation in the MWC 480 disk. Fig. 9 shows the measured ratio in the MWC 480 disk compared with different Solar system bodies and the ISM. Observations of the ratio in our Solar System reveal a clear difference between gaseous and rocky bodies (Mumma & Charnley, 2011). A low N fractionation (i.e., high ) is observed toward the Sun and Jupiter (Marty et al., 2011), while a high fractionation (i.e., low ) is observed in the rocky planets, comets and meteorites (Bockelée-Morvan et al., 2008). Isotopic ratios in the coma of comets are determined remotely through high-resolution radio and optical spectroscopy. The ROSETTA space mission will hopefully provide in-situ measurements of the ratio in the coma of comet 67P/Churyumov-Gerasimenko. Comets display the highest 15N enhancements among Solar System bodies (Mumma & Charnley, 2011). Prior to this study the only other place where such high nitrogen fractionation is found is cold pre-stellar cores (Hily-Blant et al., 2013; Wampfler et al., 2014). The cometary 15N abundance could thus signify an interstellar inheritance.
Interstellar inheritance is not the only possibility, however. Distinguishing between pre-Solar and Solar Nebula origins of nitrogen fractionation requires observations of nitrogen fractionation in protoplanetary disks. In general, HCN (isotopologue) formation begins with atomic nitrogen. At low temperatures 15N is preferentially incorporated into cyanides resulting in fractionation. Observations of HCN and HNC fractionation toward protostars present a tentative trend of the with temperature, supporting this scenario (Wampfler et al., 2014). The second mechanism to produce an enhancement in 15N in HCN is isotope selective photodissociation of 14N15N over 14N2, resulting in an enhanced atomic 15N/14N ratio. Theoretical models have shown that this mechanism can increase the ratio by up to a factor 10 in protoplanetary disks (Heays et al., 2014).
Pre-stellar inheritance, low-temperature chemical fractionation in cold disk regions, and photochemically driven fractionation in disk atmospheres could thus all explain the observed nitrogen fractionation in comets. The presented HCN isotopologue observations in the MWC 480 disk cannot distinguish between these scenarios. Future, higher SNR and/or higher resolution disk studies could, however. The three scenarios should present very different radial and vertical profiles. Inheritance should produce an almost uniform ratio across the disk. Low-temperature chemical fractionation should result in a lower ratio in HCN in the outer, cold disk that is still protected from radiation and also a decreasing ratio toward the disk midplane. Finally, nitrogen fractionation from selective photodissociation should result in the lowest ratio in HCN closer to the disk atmosphere. In addition to detailed studies of individual sources, observations of the averaged ratio in disks exposed to different stellar radiation fields will also bring insight into the origin of N fractionation. If low-temperature chemical fractination is the dominant mechanism producing , then a multi-source study should result in a trend of increasing ratio with stellar radiation field. In contrast, the opposite behaviour should be observed if most of the is produced by selective photodissociation in the surface layers. These observations will reveal how frequently protoplanetary disks are seeded with 15N enriched molecules, and whether additional enrichment occurs in the disk phase, changing the fractionation pattern during planet formation. The clear HC15N detection in MWC 480 after 20 min integrated demonstrates that such observations will be readily achievable toward a sample of disks in a reasonable time frame.
5. Summary and Conclusions
Spatially and spectrally resolved ALMA observations toward the protoplanetary disk surrounding Herbig Ae star MWC 480 clearly show that its CN emission is times more extended than its HCN emission. We constructed a parametric model of the disk to obtain the underlying abundance profile of the two species and found that the observed difference in emission profiles correspond to similarly different abundance profiles for CN and HCN. This confirms theoretical model predictions which show that HCN is only abundant in disk regions where the radiation field has been attenuated sufficiently to prevent its photodissociation, while CN can survive in the outer low-density, unshielded disk regions. This difference in CN and HCN radial extent is not seen toward the disk around T Tauri star DM Tau, suggestive of different photochemical structures in disks around low and intermediate mass stars. The DM Tau disk also presents an intriguing outer ring in HCN (and potentially in CN). Observation of CN and HCN coupled to detailed modeling clearly have great potential as tracers of UV radiation field strengths across protoplanetary disks.
We also presented the first detection of the and isotopologues in a protoplanetary disk. We modeled the and emission, and derive a disk average for the isotopic ratio of in MWC 480. This value, which is lower than the Solar one, is similar to what has been measured in comets and in the cold ISM. These observations show that with the current ALMA capabilities it is remarkable easy to detect the faint lines of rare istopologues of common molecules in protoplanetary disks making new detections in the near future very likely. Observations at higher sensitivity in MWC 480, as well as in other sources, should allow us to resolve variations of the ratio across the disk, and directly address the current fractionation puzzle of why different objects in our Solar system present different N enrichment levels.
References
-
Aikawa et al. (2002)
Aikawa, Y., van Zadelhoff, G. J., van Dishoeck, E. F., & Herbst, E. 2002, A&A, 386, 622
-
Bergin et al. (2003)
Bergin, E., Calvet, N.,
D’Alessio, P., & Herczeg, G. J. 2003, ApJ, 591, L159
-
Bockelée-Morvan et al. (2008)
Bockelée-Morvan, D., Biver, N., Jehin, E., et al. 2008, ApJ, 679,
L49
-
Brinch & Hogerheijde (2010)
Brinch, C.,
& Hogerheijde, M. R. 2010, A&A, 523, A25
-
Calvet et al. (1991)
Calvet, N., Patino, A.,
Magris, G. C., & D’Alessio, P. 1991, ApJ, 380, 617
-
Calvet et al. (2005)
Calvet, N., D’Alessio,
P., Watson, D. M., et al. 2005, ApJ, 630, L185
-
Chapillon et al. (2012)
Chapillon, E., Guilloteau, S., Dutrey, A., Piétu, V., & Guélin, M. 2012, A&A, 537, A60
-
Chapillon et al. (2012)
Chapillon, E.,
Dutrey, A., Guilloteau, S., et al. 2012, ApJ, 756, 58
-
Cleeves et al. (2014)
Cleeves, L. I., Bergin,
E. A., Alexander, C. M. O. ’., et al. 2014, Science, 345, 1590
-
Dartois et al. (2003)
Dartois, E., Dutrey, A.,
& Guilloteau, S. 2003, A&A, 399, 773
-
Debes et al. (2013)
Debes, J. H.,
Jang-Condell, H., Weinberger, A. J., Roberge, A., & Schneider,
G. 2013, ApJ, 771, 45
-
Dumouchel et al. (2010)
Dumouchel, F.,
Faure, A., & Lique, F. 2010, MNRAS, 406, 2488
- Dutrey et al. (1997) Dutrey, A., Guilloteau, S., & Guelin, M. 1997, A&A, 317, L55
-
Fuente et al. (1993)
Fuente, A., Martin-Pintado, J., Cernicharo, J., & Bachiller, R. 1993, A&A, 276, 473
-
Fuente et al. (2003)
Fuente, A., Rodrıguez-Franco, A., Garcıa-Burillo, S., Martın-Pintado, J., & Black, J. H. 2003, A&A, 406, 899
-
Gerin et al. (2009)
Gerin, M., Marcelino, N.,
Biver, N., et al. 2009, A&A, 498, L9
-
Guilloteau et al. (2011)
Guilloteau, S.,
Dutrey, A., Piétu, V., & Boehler, Y. 2011, A&A, 529, A105
-
Heays et al. (2014)
Heays, A. N., Visser, R.,
Gredel, R., et al. 2014, A&A, 562, A61
-
Herczeg et al. (2002)
Herczeg, G. J., Linsky,
J. L., Valenti, J. A., Johns-Krull, C. M., & Wood, B. E. 2002,
ApJ, 572, 310
-
Henning et al. (2010)
Henning, T.,
Semenov, D., Guilloteau, S., et al. 2010, ApJ, 714, 1511
-
Hily-Blant et al. (2013)
Hily-Blant, P.,
Bonal, L., Faure, A., & Quirico, E. 2013, Icarus, 223, 582
-
Jonkheid et al. (2007)
Jonkheid, B., Dullemond, C. P., Hogerheijde, M. R., & van Dishoeck, E. F. 2007, A&A, 463, 203
-
Lique et al. (2010)
Lique, F.,
Spielfiedel, A., Feautrier, N., et al. 2010, J. Chem. Phys., 132, 024303
-
Lucas & Liszt (1998)
Lucas, R., & Liszt,
H. 1998, A&A, 337, 246
-
Marty et al. (2011)
Marty, B., Chaussidon, M.,
Wiens, R. C., Jurewicz, A. J. G., & Burnett, D. S. 2011, Science,
332, 1533
-
Mumma & Charnley (2011)
Mumma, M. J.,
& Charnley, S. B. 2011, ARA&A, 49, 471
- Öberg et al. (2015) Öberg, K. I., Guzmán, V. V., Furuya, K., et al. 2015, Nature, 520, 198
-
Öberg et al. (2010)
Öberg, K. I., Qi,
C., Fogel, J. K. J., et al. 2010, ApJ, 720, 480
-
Öberg et al. (2011)
Öberg, K. I., Qi,
C., Fogel, J. K. J., et al. 2011, ApJ, 734, 98
-
Piétu et al. (2007)
Piétu, V., Dutrey, A.,
& Guilloteau, S. 2007, A&A, 467, 163
-
Qi et al. (2013)
Qi, C., Öberg,
K. I., & Wilner, D. J. 2013, ApJ, 765, 34
-
Rodgers & Charnley (2008)
Rodgers,
S. D., & Charnley, S. B. 2008, ApJ, 689, 1448
-
Roueff et al. (2015)
Roueff, E., Loison, J. C.,
& Hickson, K. M. 2015, A&A, 576, A99
-
Simon et al. (2000)
Simon, M., Dutrey, A.,
& Guilloteau, S. 2000, ApJ, 545, 1034
-
Terzieva & Herbst (2000)
Terzieva, R.,
& Herbst, E. 2000, MNRAS, 317, 563
- Wampfler et al. (2014) Wampfler, S. F., Jørgensen, J. K., Bizzarro, M., & Bisschop, S. E. 2014, A&A, 572, A24